


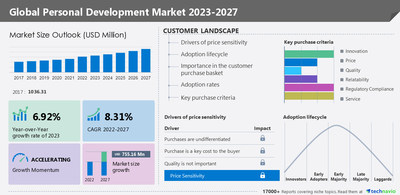
NEW YORK, Nov. 28, 2022 /PRNewswire/ -- According to Technavio, the global personal development market size is projected to grow by USD 755.16 million from 2022 to 2027. The market is estimated to grow at a CAGR of 8.31% during the forecast period. North America held the largest share of the global market in 2022, and the market in the region is estimated to witness an incremental growth of 32%.

Discover some insights on market size before buying full report, request a free sample report!
Global Personal Development Market - Parent Market Analysis
Technavio categorizes the global personal development market as a part of the specialized consumer services market, which covers revenue generated by consumer service providers, including residential services, home security services, legal services, personal services, renovation, and personal development, consumer auction services, wedding services, and funeral services. Technavio calculates the global specialized consumer services market size based on revenue generated by various specialized consumer service providers such as residential service, home security service, legal service, personal service, renovation and personal development, consumer auction service, wedding service, and funeral service providers.
Find insights on parent market & value chain analysis, download an exclusive sample!
Global Personal development Market - Five Forces
The global personal development market is fragmented, and the five forces analysis covers–
- Bargaining Power of Buyers
- Threat of New Entrants
- Threat of Rivalry
- Bargaining Power of Suppliers
- Threat of Substitutes
- Interpretation of porter five model helps to strategize the business, for entire details - buy report!
Global Personal Development Market – Customer Landscape
The report includes the market's adoption lifecycle, from the innovator's stage to the laggard's stage. It focuses on adoption rates in different regions based on the penetration. Furthermore, the report also includes key purchase criteria and drivers of price sensitivity to help companies evaluate and develop their growth strategies.
Global Personal Development Market - Segmentation Assessment
Segment Overview
Technavio has segmented the market based on distribution channel, type, and region.
- The offline distribution channel segment will grow at the highest rate during the forecast period. The segment has witnessed continuous growth over recent years with increasing favorable demographics and higher per capita income. In addition, parents' increasing awareness of the essential skills required for the overall development of their child is fostering the growth of the offline segment.
Geography Overview
By geography, the global personal development market is segmented into APAC, North America, Europe, the Middle East and Africa, and South America. The report provides actionable insights and estimates the contribution of all regions to the growth of the global personal development market.
- North America held a 32% share of the global personal development market in 2022. The market in the region is estimated to grow at the fastest pace during the forecast period. The growth of the regional market is driven by factors such as the increasing demand for personal development training, the rising number of smart device users, and the expanding number of mobile broadband connections. People in the region increasingly seek strategies to improve their physical and mental well-being. Also, skills that focus on self-awareness, such as emotions, character characteristics, habits, individual values, and the psychological needs that determine individuals' day-to-day conduct, are becoming more important. All these factors have made North America one of the major markets for personal development globally.
Global Personal development Market – Market Dynamics
Key factor driving market growth
- The rise in cost-effective content development is one of the key factors driving the growth of the market.
- Vendors in the market are making significant investments in content marketing strategies in the B2B space. This is helping them to connect with their target audience more effectively.
- Vendors are developing very consistent, high-quality, and engaging content to influence audience decisions. They are taking advantage of online platforms and focusing on the weak points of the audience to attract them.
- Such strategies adopted by vendors are driving the growth of the global personal development market.
Recent trends influencing the market
- The rising adoption of cloud computing in the academic sector is the major trend in the market.
- Ed-tech companies in the market are embracing cloud to provide high-quality and flexible learning options to students of personal development.
- The preference for online content is also increasing among students as it is cost-effective and can be accessed from anywhere.
- Many vendors are helping educational institutions to develop and improve their digital library systems using cloud services.
- This trend will have a positive impact on the growth of the global personal development market during the forecast period.
Major challenges hindering market growth
- The increasing adoption of open-source solutions will challenge the growth of the market.
- Open-source personal development solutions in the market are available for free. They are easily available in the form of magazine articles, YouTube videos, and motivational speakers.
- Most audiences prefer them instead of paid solutions as they are capable of delivering the same knowledge as paid sources.
- These open-source solutions are creating a great number of challenges for the growth of market vendors, which is negatively impacting the growth of the market.
What are the key data covered in this personal development market report?
- CAGR of the market during the forecast period
- Detailed information on factors that will drive the growth of the personal development market between 2023 and 2027
- Precise estimation of the size of the personal development market and its contribution to the parent market
- Accurate predictions about upcoming trends and changes in consumer behavior
- Growth of the personal development market industry across APAC, North America, Europe, Middle East and Africa, and South America
- Thorough analysis of the market's competitive landscape and detailed information about vendors
- Comprehensive analysis of factors that will challenge the growth of personal development market vendors
Gain instant access to 17,000+ market research reports.
Technavio's SUBSCRIPTION platform
Related Reports:
- The professional development market share in the US is expected to be valued at USD 3.75 billion by 2026 with a progressing CAGR of 5.52%. The market is segmented by end-user (K-12, higher education, and pre-K-12) and type (online and offline).
- The corporate training market share in US is expected to increase by USD 1.21 billion from 2021 to 2026, and the market's growth momentum will accelerate at a CAGR of 6.49%. The market is segmented by product (technical courses and non-technical courses), end-user (manufacturing, healthcare, BFSI, IT, and others), method (blended learning, offline learning, and online learning), and geography (US).
Personal Development Market Scope | |
Report Coverage | Details |
Page number | 156 |
Base year | 2022 |
Historical year | 2017-2021 |
Forecast period | 2023-2027 |
Growth momentum & CAGR | Accelerate at a CAGR of 8.31% |
Market growth 2023-2027 | USD 755.16 million |
Market structure | Fragmented |
YoY growth (%) | 6.92 |
Regional analysis | North America, Europe, APAC, South America, and the Middle East and Africa |
Performing market contribution | North America at 32% |
Key consumer countries | US, Canada, China, Japan, India, and Germany |
Competitive landscape | Leading companies, Competitive Strategies, Consumer engagement scope |
Key companies profiled | Coursera Inc., Dale Carnegie and Associates Inc., edX LLC, Esalen Institute, Franklin Covey Co., Hay House Publishing, Landmark Worldwide Enterprises Inc., LinkedIn Corp., Nutrisystem Inc., Omega Institute, OpenSesame Inc., Pluralsight Inc., SkillPath, SkillShare Inc., Skillsoft Corp. |
Market dynamics | Parent market analysis, Market growth inducers and obstacles, Fast-growing and slow-growing segment analysis, COVID-19 impact and recovery analysis and future consumer dynamics, and market condition analysis for the forecast period. |
Customization purview | If our report has not included the data that you are looking for, you can reach out to our analysts and get segments customized. |
Table of contents:
1 Executive Summary
- 1.1 Market overview
- Exhibit 01: Executive Summary – Chart on Market Overview
- Exhibit 02: Executive Summary – Data Table on Market Overview
- Exhibit 03: Executive Summary – Chart on Global Market Characteristics
- Exhibit 04: Executive Summary – Chart on Market by Geography
- Exhibit 05: Executive Summary – Chart on Market Segmentation by Distribution Channel
- Exhibit 06: Executive Summary – Chart on Market Segmentation by Type
- Exhibit 07: Executive Summary – Chart on Incremental Growth
- Exhibit 08: Executive Summary – Data Table on Incremental Growth
- Exhibit 09: Executive Summary – Chart on Vendor Market Positioning
2 Market Landscape
- 2.1 Market ecosystem
- Exhibit 10: Parent market
- Exhibit 11: Market Characteristics
3 Market Sizing
- 3.1 Market definition
- Exhibit 12: Offerings of vendors included in the market definition
- 3.2 Market segment analysis
- Exhibit 13: Market segments
- 3.3 Market size 2022
- 3.4 Market outlook: Forecast for 2022-2027
- Exhibit 14: Chart on Global - Market size and forecast 2022-2027 ($ million)
- Exhibit 15: Data Table on Global - Market size and forecast 2022-2027 ($ million)
- Exhibit 16: Chart on Global Market: Year-over-year growth 2022-2027 (%)
- Exhibit 17: Data Table on Global Market: Year-over-year growth 2022-2027 (%)
4 Historic Market Size
- 4.1 Global personal development market 2017 - 2021
- Exhibit 18: Historic Market Size – Data Table on Global personal development market 2017 - 2021 ($ million)
- 4.2 Distribution channel Segment Analysis 2017 - 2021
- Exhibit 19: Historic Market Size – Distribution channel Segment 2017 - 2021 ($ million)
- 4.3 Type Segment Analysis 2017 - 2021
- Exhibit 20: Historic Market Size – Type Segment 2017 - 2021 ($ million)
- 4.4 Geography Segment Analysis 2017 - 2021
- Exhibit 21: Historic Market Size – Geography Segment 2017 - 2021 ($ million)
- 4.5 Country Segment Analysis 2017 - 2021
- Exhibit 22: Historic Market Size – Country Segment 2017 - 2021 ($ million)
5 Five Forces Analysis
- 5.1 Five forces summary
- Exhibit 23: Five forces analysis - Comparison between2022 and 2027
- 5.2 Bargaining power of buyers
- Exhibit 24: Chart on Bargaining power of buyers – Impact of key factors 2022 and 2027
- 5.3 Bargaining power of suppliers
- Exhibit 25: Bargaining power of suppliers – Impact of key factors in 2022 and 2027
- 5.4 Threat of new entrants
- Exhibit 26: Threat of new entrants – Impact of key factors in 2022 and 2027
- 5.5 Threat of substitutes
- Exhibit 27: Threat of substitutes – Impact of key factors in 2022 and 2027
- 5.6 Threat of rivalry
- Exhibit 28: Threat of rivalry – Impact of key factors in 2022 and 2027
- 5.7 Market condition
- Exhibit 29: Chart on Market condition - Five forces 2022 and 2027
6 Market Segmentation by Distribution Channel
- 6.1 Market segments
- Exhibit 30: Chart on Distribution Channel - Market share 2022-2027 (%)
- Exhibit 31: Data Table on Distribution Channel - Market share 2022-2027 (%)
- 6.2 Comparison by Distribution Channel
- Exhibit 32: Chart on Comparison by Distribution Channel
- Exhibit 33: Data Table on Comparison by Distribution Channel
- 6.3 Online - Market size and forecast 2022-2027
- Exhibit 34: Chart on Online - Market size and forecast 2022-2027 ($ million)
- Exhibit 35: Data Table on Online - Market size and forecast 2022-2027 ($ million)
- Exhibit 36: Chart on Online - Year-over-year growth 2022-2027 (%)
- Exhibit 37: Data Table on Online - Year-over-year growth 2022-2027 (%)
- 6.4 Offline - Market size and forecast 2022-2027
- Exhibit 38: Chart on Offline - Market size and forecast 2022-2027 ($ million)
- Exhibit 39: Data Table on Offline - Market size and forecast 2022-2027 ($ million)
- Exhibit 40: Chart on Offline - Year-over-year growth 2022-2027 (%)
- Exhibit 41: Data Table on Offline - Year-over-year growth 2022-2027 (%)
- 6.5 Market opportunity by Distribution Channel
- Exhibit 42: Market opportunity by Distribution Channel ($ million)
7 Market Segmentation by Type
- 7.1 Market segments
- Exhibit 43: Chart on Type - Market share 2022-2027 (%)
- Exhibit 44: Data Table on Type - Market share 2022-2027 (%)
- 7.2 Comparison by Type
- Exhibit 45: Chart on Comparison by Type
- Exhibit 46: Data Table on Comparison by Type
- 7.3 Self-awareness and skillset enhancement - Market size and forecast 2022-2027
- Exhibit 47: Chart on Self-awareness and skillset enhancement - Market size and forecast 2022-2027 ($ million)
- Exhibit 48: Data Table on Self-awareness and skillset enhancement - Market size and forecast 2022-2027 ($ million)
- Exhibit 49: Chart on Self-awareness and skillset enhancement - Year-over-year growth 2022-2027 (%)
- Exhibit 50: Data Table on Self-awareness and skillset enhancement - Year-over-year growth 2022-2027 (%)
- 7.4 Mental health - Market size and forecast 2022-2027
- Exhibit 51: Chart on Mental health - Market size and forecast 2022-2027 ($ million)
- Exhibit 52: Data Table on Mental health - Market size and forecast 2022-2027 ($ million)
- Exhibit 53: Chart on Mental health - Year-over-year growth 2022-2027 (%)
- Exhibit 54: Data Table on Mental health - Year-over-year growth 2022-2027 (%)
- 7.5 Physical health - Market size and forecast 2022-2027
- Exhibit 55: Chart on Physical health - Market size and forecast 2022-2027 ($ million)
- Exhibit 56: Data Table on Physical health - Market size and forecast 2022-2027 ($ million)
- Exhibit 57: Chart on Physical health - Year-over-year growth 2022-2027 (%)
- Exhibit 58: Data Table on Physical health - Year-over-year growth 2022-2027 (%)
- 7.6 Market opportunity by Type
- Exhibit 59: Market opportunity by Type ($ million)
8 Customer Landscape
- 8.1 Customer landscape overview
- Exhibit 60: Analysis of price sensitivity, lifecycle, customer purchase basket, adoption rates, and purchase criteria
9 Geographic Landscape
- 9.1 Geographic segmentation
- Exhibit 61: Chart on Market share by geography 2022-2027 (%)
- Exhibit 62: Data Table on Market share by geography 2022-2027 (%)
- 9.2 Geographic comparison
- Exhibit 63: Chart on Geographic comparison
- Exhibit 64: Data Table on Geographic comparison
- 9.3 North America - Market size and forecast 2022-2027
- Exhibit 65: Chart on North America - Market size and forecast 2022-2027 ($ million)
- Exhibit 66: Data Table on North America - Market size and forecast 2022-2027 ($ million)
- Exhibit 67: Chart on North America - Year-over-year growth 2022-2027 (%)
- Exhibit 68: Data Table on North America - Year-over-year growth 2022-2027 (%)
- 9.4 Europe - Market size and forecast 2022-2027
- Exhibit 69: Chart on Europe - Market size and forecast 2022-2027 ($ million)
- Exhibit 70: Data Table on Europe - Market size and forecast 2022-2027 ($ million)
- Exhibit 71: Chart on Europe - Year-over-year growth 2022-2027 (%)
- Exhibit 72: Data Table on Europe - Year-over-year growth 2022-2027 (%)
- 9.5 APAC - Market size and forecast 2022-2027
- Exhibit 73: Chart on APAC - Market size and forecast 2022-2027 ($ million)
- Exhibit 74: Data Table on APAC - Market size and forecast 2022-2027 ($ million)
- Exhibit 75: Chart on APAC - Year-over-year growth 2022-2027 (%)
- Exhibit 76: Data Table on APAC - Year-over-year growth 2022-2027 (%)
- 9.6 South America - Market size and forecast 2022-2027
- Exhibit 77: Chart on South America - Market size and forecast 2022-2027 ($ million)
- Exhibit 78: Data Table on South America - Market size and forecast 2022-2027 ($ million)
- Exhibit 79: Chart on South America - Year-over-year growth 2022-2027 (%)
- Exhibit 80: Data Table on South America - Year-over-year growth 2022-2027 (%)
- 9.7 Middle East and Africa - Market size and forecast 2022-2027
- Exhibit 81: Chart on Middle East and Africa - Market size and forecast 2022-2027 ($ million)
- Exhibit 82: Data Table on Middle East and Africa - Market size and forecast 2022-2027 ($ million)
- Exhibit 83: Chart on Middle East and Africa - Year-over-year growth 2022-2027 (%)
- Exhibit 84: Data Table on Middle East and Africa - Year-over-year growth 2022-2027 (%)
- 9.8 US - Market size and forecast 2022-2027
- Exhibit 85: Chart on US - Market size and forecast 2022-2027 ($ million)
- Exhibit 86: Data Table on US - Market size and forecast 2022-2027 ($ million)
- Exhibit 87: Chart on US - Year-over-year growth 2022-2027 (%)
- Exhibit 88: Data Table on US - Year-over-year growth 2022-2027 (%)
- 9.9 Germany - Market size and forecast 2022-2027
- Exhibit 89: Chart on Germany - Market size and forecast 2022-2027 ($ million)
- Exhibit 90: Data Table on Germany - Market size and forecast 2022-2027 ($ million)
- Exhibit 91: Chart on Germany - Year-over-year growth 2022-2027 (%)
- Exhibit 92: Data Table on Germany - Year-over-year growth 2022-2027 (%)
- 9.10 China - Market size and forecast 2022-2027
- Exhibit 93: Chart on China - Market size and forecast 2022-2027 ($ million)
- Exhibit 94: Data Table on China - Market size and forecast 2022-2027 ($ million)
- Exhibit 95: Chart on China - Year-over-year growth 2022-2027 (%)
- Exhibit 96: Data Table on China - Year-over-year growth 2022-2027 (%)
- 9.11 Canada - Market size and forecast 2022-2027
- Exhibit 97: Chart on Canada - Market size and forecast 2022-2027 ($ million)
- Exhibit 98: Data Table on Canada - Market size and forecast 2022-2027 ($ million)
- Exhibit 99: Chart on Canada - Year-over-year growth 2022-2027 (%)
- Exhibit 100: Data Table on Canada - Year-over-year growth 2022-2027 (%)
- 9.12 Japan - Market size and forecast 2022-2027
- Exhibit 101: Chart on Japan - Market size and forecast 2022-2027 ($ million)
- Exhibit 102: Data Table on Japan - Market size and forecast 2022-2027 ($ million)
- Exhibit 103: Chart on Japan - Year-over-year growth 2022-2027 (%)
- Exhibit 104: Data Table on Japan - Year-over-year growth 2022-2027 (%)
- 9.13 India - Market size and forecast 2022-2027
- Exhibit 105: Chart on India - Market size and forecast 2022-2027 ($ million)
- Exhibit 106: Data Table on India - Market size and forecast 2022-2027 ($ million)
- Exhibit 107: Chart on India - Year-over-year growth 2022-2027 (%)
- Exhibit 108: Data Table on India - Year-over-year growth 2022-2027 (%)
- 9.14 Market opportunity by geography
- Exhibit 109: Market opportunity by geography ($ million)
10 Drivers, Challenges, and Trends
- 10.1 Market drivers
- 10.2 Market challenges
- 10.3 Impact of drivers and challenges
- Exhibit 110: Impact of drivers and challenges in 2022 and 2027
- 10.4 Market trends
11 Vendor Landscape
- 11.1 Overview
- 11.2 Vendor landscape
- Exhibit 111: Overview on Criticality of inputs and Factors of differentiation
- 11.3 Landscape disruption
- Exhibit 112: Overview on factors of disruption
- 11.4 Industry risks
- Exhibit 113: Impact of key risks on business
12 Vendor Analysis
- 12.1 Vendors covered
- Exhibit 114: Vendors covered
- 12.2 Market positioning of vendors
- Exhibit 115: Matrix on vendor position and classification
- 12.3 Dale Carnegie and Associates Inc.
- Exhibit 116: Dale Carnegie and Associates Inc. - Overview
- Exhibit 117: Dale Carnegie and Associates Inc. - Product / Service
- Exhibit 118: Dale Carnegie and Associates Inc. - Key offerings
- 12.4 Esalen Institute
- Exhibit 119: Esalen Institute - Overview
- Exhibit 120: Esalen Institute - Product / Service
- Exhibit 121: Esalen Institute - Key offerings
- 12.5 Franklin Covey Co.
- Exhibit 122: Franklin Covey Co. - Overview
- Exhibit 123: Franklin Covey Co. - Business segments
- Exhibit 124: Franklin Covey Co. - Key offerings
- Exhibit 125: Franklin Covey Co. - Segment focus
- 12.6 Hay House Publishing
- Exhibit 126: Hay House Publishing - Overview
- Exhibit 127: Hay House Publishing - Product / Service
- Exhibit 128: Hay House Publishing - Key offerings
- 12.7 Landmark Worldwide Enterprises Inc.
- Exhibit 129: Landmark Worldwide Enterprises Inc. - Overview
- Exhibit 130: Landmark Worldwide Enterprises Inc. - Product / Service
- Exhibit 131: Landmark Worldwide Enterprises Inc. - Key offerings
- 12.8 Nutrisystem Inc.
- Exhibit 132: Nutrisystem Inc. - Overview
- Exhibit 133: Nutrisystem Inc. - Product / Service
- Exhibit 134: Nutrisystem Inc. - Key offerings
- 12.9 Omega Institute
- Exhibit 135: Omega Institute - Overview
- Exhibit 136: Omega Institute - Product / Service
- Exhibit 137: Omega Institute - Key offerings
- 12.10 Pluralsight Inc.
- Exhibit 138: Pluralsight Inc. - Overview
- Exhibit 139: Pluralsight Inc. - Product / Service
- Exhibit 140: Pluralsight Inc. - Key offerings
- 12.11 SkillPath
- Exhibit 141: SkillPath - Overview
- Exhibit 142: SkillPath - Product / Service
- Exhibit 143: SkillPath - Key offerings
- 12.12 Skillsoft Corp.
- Exhibit 144: Skillsoft Corp. - Overview
- Exhibit 145: Skillsoft Corp. - Business segments
- Exhibit 146: Skillsoft Corp. - Key offerings
- Exhibit 147: Skillsoft Corp. - Segment focus
- 12.13 Success Resources Australia Pty Ltd.
- Exhibit 148: Success Resources Australia Pty Ltd. - Overview
- Exhibit 149: Success Resources Australia Pty Ltd. - Product / Service
- Exhibit 150: Success Resources Australia Pty Ltd. - Key offerings
- 12.14 Toastmasters International
- Exhibit 151: Toastmasters International - Overview
- Exhibit 152: Toastmasters International - Product / Service
- Exhibit 153: Toastmasters International - Key offerings
- 12.15 Udemy Inc.
- Exhibit 154: Udemy Inc. - Overview
- Exhibit 155: Udemy Inc. - Product / Service
- Exhibit 156: Udemy Inc. - Key news
- Exhibit 157: Udemy Inc. - Key offerings
- 12.16 Wilson Learning Worldwide Inc.
- Exhibit 158: Wilson Learning Worldwide Inc. - Overview
- Exhibit 159: Wilson Learning Worldwide Inc. - Product / Service
- Exhibit 160: Wilson Learning Worldwide Inc. - Key offerings
- 12.17 WW International Inc.
- Exhibit 161: WW International Inc. - Overview
- Exhibit 162: WW International Inc. - Business segments
- Exhibit 163: WW International Inc. - Key offerings
- Exhibit 164: WW International Inc. - Segment focus
13 Appendix
- 13.1 Scope of the report
- 13.2 Inclusions and exclusions checklist
- Exhibit 165: Inclusions checklist
- Exhibit 166: Exclusions checklist
- 13.3 Currency conversion rates for US$
- Exhibit 167: Currency conversion rates for US$
- 13.4 Research methodology
- Exhibit 168: Research methodology
- Exhibit 169: Validation techniques employed for market sizing
- Exhibit 170: Information sources
- 13.5 List of abbreviations
- Exhibit 171: List of abbreviations
About Us
Technavio is a leading global technology research and advisory company. Their research and analysis focus on emerging market trends and provide actionable insights to help businesses identify market opportunities and develop effective strategies to optimize their market positions. With over 500 specialized analysts, Technavio's report library consists of more than 17,000 reports and counting, covering 800 technologies, spanning 50 countries. Their client base consists of enterprises of all sizes, including more than 100 Fortune 500 companies. This growing client base relies on Technavio's comprehensive coverage, extensive research, and actionable market insights to identify opportunities in existing and potential markets and assess their competitive positions within changing market scenarios.
Contact
Technavio Research
Jesse Maida
Media & Marketing Executive
US: +1 844 364 1100
UK: +44 203 893 3200
Email: media@technavio.com
Website: www.technavio.com/


SOURCE Technavio
© 2024 Benzinga.com. Benzinga does not provide investment advice. All rights reserved.
Trade confidently with insights and alerts from analyst ratings, free reports and breaking news that affects the stocks you care about.

