


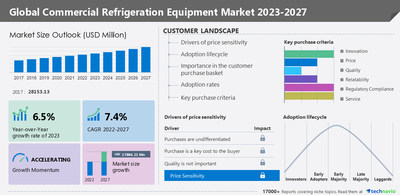
NEW YORK, Nov. 24, 2022 /PRNewswire/ -- The commercial refrigeration equipment market size is forecasted to increase by USD 17886.21 million from 2022 to 2027, at a CAGR of 7.4%, according to the recent market study by Technavio. The growth of the market will be driven by the need to increase the storage life of food products, market expansion by end-users, and the growing focus on merchandising refrigerated food and beverages.

Technavio categorizes the global commercial refrigeration equipment market as a part of the global electrical components and equipment, which covers companies engaged in the manufacturing of electric cables and wires, electrical components, and electrical equipment.
Charts & data tables about market and segment sizes for a historic period of five (2017-2021) years have been covered in this report. Download the Sample Report
Technavio has extensively analyzed 15 major vendors, including AB Electrolux, Ali Group Srl, Blue Star Ltd., Daikin Industries Ltd., Dover Corp., Felix Storch Inc., FUJIMAK Corp., HOSHIZAKI Corp., Illinois Tool Works Inc., Imbera, Lennox International Inc., Panasonic Holdings Corp., Standex International Corp., Tecumseh Products Co. LLC, TEFCOLD AS, The Middleby Corp., TURBO AIR Inc., UAB FREOR LT, Valpro Refrigeration, and Welbilt Inc.
Key Benefits for Industry Players & Stakeholders –
- The report offers information on the criticality of vendor inputs, including R&D, CAPEX, and technology.
- It also provides detailed analyses of the market's competitive landscape and vendors' product offerings.
- The report also provides a qualitative and quantitative analysis of vendors to help clients understand the wider business environment as well as the strengths and weaknesses of key market players. Data is qualitatively analyzed to categorize vendors as pure play, category focused, industry focused, and diversified; it is quantitatively analyzed to categorize vendors as dominant, leading, strong, tentative, and weak.
Expand operations in future - To get requisite details, ask for a custom report.
Customer Landscape - Analysis of Price Sensitivity, Adoption Lifecycle, Customer Purchase Basket, Adoption Rates, and Purchase Criteria by Technavio
- One of the core components of the customer landscape is price sensitivity, an analysis of which will help companies refine marketing strategies to gain a competitive advantage.
- Another key aspect is price sensitivity drivers (purchases are undifferentiated, purchase is a key cost to buyers, and quality is not important), which range between LOW and HIGH.
- Furthermore, market adoption rates for all regions have been covered.
Download the sample to get a holistic overview of the commercial refrigeration equipment market by industry experts to evaluate and develop growth strategies.
The market is segmented by product (walk-in coolers, display cases, refrigerator for drinks, and ice-making machines) and end-user (retail, restaurants, hotels, and catering units).
Segmentation by product (Inclusion/Exclusion)
- Inclusion:
- Walk-in coolers:
The walk-in coolers segment grew gradually by USD 7694.25 million between 2017 and 2021. Walk-in coolers are made in standard sizes and can be customized based on the requirements of end-users. For instance, Standex International offers Bilt2Spec customized walk-in coolers under its Master-Bilt Products brand. The availability of such products helps vendors meet the unique requirements of customers, which is driving the growth of this segment.
To get detailed insights about inclusions and exclusions, buy report.
Related Reports -
Commercial HVAC Market by Application and Geography - Forecast and Analysis 2022-2026 – size is estimated to grow by USD 22.09 billion from 2021 to 2026, with an accelerated CAGR of 4.2%, according to the recent market study by Technavio. Furthermore, this report extensively covers market segmentations by application (equipment and services) and geography (North America, Europe, Asia, and Rest of World (ROW) APAC, North America, Europe, South America, and Middle East and Africa).
Commercial Combi Ovens Market by Product, End-user, and Geography - Forecast and Analysis 2022-2026 – size is estimated to increase by USD 1.05 billion from 2021 to 2026, with an accelerated CAGR of 9.65%, according to the recent market study by Technavio. The growing inclination toward combi ovens with energy-efficient features is one of the key factors driving the market growth.
What are the key data covered in the commercial refrigeration equipment market?
- CAGR of the market during the forecast period
- Detailed information on factors that will drive the growth of the commercial refrigeration equipment market between 2023 and 2027
- Precise estimation of the size of the commercial refrigeration equipment market size and its contribution to the parent market
- Accurate predictions about upcoming trends and changes in consumer behavior
- Growth of the commercial refrigeration equipment market across APAC, North America, Europe, Middle East and Africa, and South America
- Thorough analysis of the market's competitive landscape and detailed information about vendors
- Comprehensive analysis of factors that will challenge the growth of commercial refrigeration equipment market vendors
Commercial Refrigeration Equipment Market Scope | |
Report Coverage | Details |
Page number | 120 |
Base year | 2022 |
Historic Period | 2017 -2021 |
Forecast period | 2023-2027 |
Growth momentum & CAGR | Accelerate at a CAGR of 7.4% |
Market growth 2023-2027 | USD 17886.21 million |
Market structure | Fragmented |
YoY growth (%) | 6.5 |
Regional analysis | APAC, Europe, North America, the Middle East and Africa, and South America |
Performing contribution | APAC at 44% |
Key countries | US, Canada, China, Japan, and Germany |
Competitive landscape | Leading companies, Market Positioning of Vendors, Competitive Strategies and Industry Risks |
Companies profiled | AB Electrolux, Ali Group Srl, Blue Star Ltd., Daikin Industries Ltd., Dover Corp., Felix Storch Inc., FUJIMAK Corp., HOSHIZAKI Corp., Illinois Tool Works Inc., Imbera, Lennox International Inc., Panasonic Holdings Corp., Standex International Corp., Tecumseh Products Co. LLC, TEFCOLD AS, The Middleby Corp., TURBO AIR Inc., UAB FREOR LT, Valpro Refrigeration, and Welbilt Inc. |
Market Dynamics | Parent Market Analysis; Market growth inducers and obstacles; Fast-growing and slow-growing segment analysis for the forecast period |
Customization preview | If our report has not included the data that you are looking for, you can reach out to our analysts and get segments customized. |
Browse Industrials Market Reports
Table of Contents
1 Executive Summary
- 1.1 Market overview
- Exhibit 01: Executive Summary – Chart on Market Overview
- Exhibit 02: Executive Summary – Data Table on Market Overview
- Exhibit 03: Executive Summary – Chart on Global Market Characteristics
- Exhibit 04: Executive Summary – Chart on Market by Geography
- Exhibit 05: Executive Summary – Chart on Market Segmentation by Product
- Exhibit 06: Executive Summary – Chart on Market Segmentation by End-user
- Exhibit 07: Executive Summary – Chart on Incremental Growth
- Exhibit 08: Executive Summary – Data Table on Incremental Growth
- Exhibit 09: Executive Summary – Chart on Vendor Market Positioning
2 Market Landscape
- 2.1 Market ecosystem
- Exhibit 10: Parent market
- Exhibit 11: Market Characteristics
3 Market Sizing
- 3.1 Market definition
- Exhibit 12: Offerings of vendors included in the market definition
- 3.2 Market segment analysis
- Exhibit 13: Market segments
- 3.3 Market size 2022
- 3.4 Market outlook: Forecast for 2022-2027
- Exhibit 14: Chart on Global - Market size and forecast 2022-2027 ($ million)
- Exhibit 15: Data Table on Global - Market size and forecast 2022-2027 ($ million)
- Exhibit 16: Chart on Global Market: Year-over-year growth 2022-2027 (%)
- Exhibit 17: Data Table on Global Market: Year-over-year growth 2022-2027 (%)
4 Five Forces Analysis
- 4.1 Five forces summary
- Exhibit 18: Five forces analysis - Comparison between 2022 and 2027
- 4.2 Bargaining power of buyers
- Exhibit 19: Chart on Bargaining power of buyers – Impact of key factors 2022 and 2027
- 4.3 Bargaining power of suppliers
- Exhibit 20: Bargaining power of suppliers – Impact of key factors in 2022 and 2027
- 4.4 Threat of new entrants
- Exhibit 21: Threat of new entrants – Impact of key factors in 2022 and 2027
- 4.5 Threat of substitutes
- Exhibit 22: Threat of substitutes – Impact of key factors in 2022 and 2027
- 4.6 Threat of rivalry
- Exhibit 23: Threat of rivalry – Impact of key factors in 2022 and 2027
- 4.7 Market condition
- Exhibit 24: Chart on Market condition - Five forces 2022 and 2027
5 Market Segmentation by Product
- 5.1 Market segments
- Exhibit 25: Chart on Product - Market share 2022-2027 (%)
- Exhibit 26: Data Table on Product - Market share 2022-2027 (%)
- 5.2 Comparison by Product
- Exhibit 27: Chart on Comparison by Product
- Exhibit 28: Data Table on Comparison by Product
- 5.3 Walk-in coolers - Market size and forecast 2022-2027
- Exhibit 29: Chart on Walk-in coolers - Market size and forecast 2022-2027 ($ million)
- Exhibit 30: Data Table on Walk-in coolers - Market size and forecast 2022-2027 ($ million)
- Exhibit 31: Chart on Walk-in coolers - Year-over-year growth 2022-2027 (%)
- Exhibit 32: Data Table on Walk-in coolers - Year-over-year growth 2022-2027 (%)
- 5.4 Display cases - Market size and forecast 2022-2027
- Exhibit 33: Chart on Display cases - Market size and forecast 2022-2027 ($ million)
- Exhibit 34: Data Table on Display cases - Market size and forecast 2022-2027 ($ million)
- Exhibit 35: Chart on Display cases - Year-over-year growth 2022-2027 (%)
- Exhibit 36: Data Table on Display cases - Year-over-year growth 2022-2027 (%)
- 5.5 Refrigerator for drinks - Market size and forecast 2022-2027
- Exhibit 37: Chart on Refrigerator for drinks - Market size and forecast 2022-2027 ($ million)
- Exhibit 38: Data Table on Refrigerator for drinks - Market size and forecast 2022-2027 ($ million)
- Exhibit 39: Chart on Refrigerator for drinks - Year-over-year growth 2022-2027 (%)
- Exhibit 40: Data Table on Refrigerator for drinks - Year-over-year growth 2022-2027 (%)
- 5.6 Ice-making machines - Market size and forecast 2022-2027
- Exhibit 41: Chart on Ice-making machines - Market size and forecast 2022-2027 ($ million)
- Exhibit 42: Data Table on Ice-making machines - Market size and forecast 2022-2027 ($ million)
- Exhibit 43: Chart on Ice-making machines - Year-over-year growth 2022-2027 (%)
- Exhibit 44: Data Table on Ice-making machines - Year-over-year growth 2022-2027 (%)
- 5.7 Others - Market size and forecast 2022-2027
- Exhibit 45: Chart on Others - Market size and forecast 2022-2027 ($ million)
- Exhibit 46: Data Table on Others - Market size and forecast 2022-2027 ($ million)
- Exhibit 47: Chart on Others - Year-over-year growth 2022-2027 (%)
- Exhibit 48: Data Table on Others - Year-over-year growth 2022-2027 (%)
- 5.8 Market opportunity by Product
- Exhibit 49: Market opportunity by Product ($ million)
6 Market Segmentation by End-user
- 6.1 Market segments
- Exhibit 50: Chart on End-user - Market share 2022-2027 (%)
- Exhibit 51: Data Table on End-user - Market share 2022-2027 (%)
- 6.2 Comparison by End-user
- Exhibit 52: Chart on Comparison by End-user
- Exhibit 53: Data Table on Comparison by End-user
- 6.3 Retail - Market size and forecast 2022-2027
- Exhibit 54: Chart on Retail - Market size and forecast 2022-2027 ($ million)
- Exhibit 55: Data Table on Retail - Market size and forecast 2022-2027 ($ million)
- Exhibit 56: Chart on Retail - Year-over-year growth 2022-2027 (%)
- Exhibit 57: Data Table on Retail - Year-over-year growth 2022-2027 (%)
- 6.4 Restaurants - Market size and forecast 2022-2027
- Exhibit 58: Chart on Restaurants - Market size and forecast 2022-2027 ($ million)
- Exhibit 59: Data Table on Restaurants - Market size and forecast 2022-2027 ($ million)
- Exhibit 60: Chart on Restaurants - Year-over-year growth 2022-2027 (%)
- Exhibit 61: Data Table on Restaurants - Year-over-year growth 2022-2027 (%)
- 6.5 Hotels - Market size and forecast 2022-2027
- Exhibit 62: Chart on Hotels - Market size and forecast 2022-2027 ($ million)
- Exhibit 63: Data Table on Hotels - Market size and forecast 2022-2027 ($ million)
- Exhibit 64: Chart on Hotels - Year-over-year growth 2022-2027 (%)
- Exhibit 65: Data Table on Hotels - Year-over-year growth 2022-2027 (%)
- 6.6 Catering units - Market size and forecast 2022-2027
- Exhibit 66: Chart on Catering units - Market size and forecast 2022-2027 ($ million)
- Exhibit 67: Data Table on Catering units - Market size and forecast 2022-2027 ($ million)
- Exhibit 68: Chart on Catering units - Year-over-year growth 2022-2027 (%)
- Exhibit 69: Data Table on Catering units - Year-over-year growth 2022-2027 (%)
- 6.7 Market opportunity by End-user
- Exhibit 70: Market opportunity by End-user ($ million)
7 Customer Landscape
- 7.1 Customer landscape overview
- Exhibit 71: Analysis of price sensitivity, lifecycle, customer purchase basket, adoption rates, and purchase criteria
8 Geographic Landscape
- 8.1 Geographic segmentation
- Exhibit 72: Chart on Market share by geography 2022-2027 (%)
- Exhibit 73: Data Table on Market share by geography 2022-2027 (%)
- 8.2 Geographic comparison
- Exhibit 74: Chart on Geographic comparison
- Exhibit 75: Data Table on Geographic comparison
- 8.3 APAC - Market size and forecast 2022-2027
- Exhibit 76: Chart on APAC - Market size and forecast 2022-2027 ($ million)
- Exhibit 77: Data Table on APAC - Market size and forecast 2022-2027 ($ million)
- Exhibit 78: Chart on APAC - Year-over-year growth 2022-2027 (%)
- Exhibit 79: Data Table on APAC - Year-over-year growth 2022-2027 (%)
- 8.4 Europe - Market size and forecast 2022-2027
- Exhibit 80: Chart on Europe - Market size and forecast 2022-2027 ($ million)
- Exhibit 81: Data Table on Europe - Market size and forecast 2022-2027 ($ million)
- Exhibit 82: Chart on Europe - Year-over-year growth 2022-2027 (%)
- Exhibit 83: Data Table on Europe - Year-over-year growth 2022-2027 (%)
- 8.5 North America - Market size and forecast 2022-2027
- Exhibit 84: Chart on North America - Market size and forecast 2022-2027 ($ million)
- Exhibit 85: Data Table on North America - Market size and forecast 2022-2027 ($ million)
- Exhibit 86: Chart on North America - Year-over-year growth 2022-2027 (%)
- Exhibit 87: Data Table on North America - Year-over-year growth 2022-2027 (%)
- 8.6 Middle East and Africa - Market size and forecast 2022-2027
- Exhibit 88: Chart on Middle East and Africa - Market size and forecast 2022-2027 ($ million)
- Exhibit 89: Data Table on Middle East and Africa - Market size and forecast 2022-2027 ($ million)
- Exhibit 90: Chart on Middle East and Africa - Year-over-year growth 2022-2027 (%)
- Exhibit 91: Data Table on Middle East and Africa - Year-over-year growth 2022-2027 (%)
- 8.7 South America - Market size and forecast 2022-2027
- Exhibit 92: Chart on South America - Market size and forecast 2022-2027 ($ million)
- Exhibit 93: Data Table on South America - Market size and forecast 2022-2027 ($ million)
- Exhibit 94: Chart on South America - Year-over-year growth 2022-2027 (%)
- Exhibit 95: Data Table on South America - Year-over-year growth 2022-2027 (%)
- 8.8 China - Market size and forecast 2022-2027
- Exhibit 96: Chart on China - Market size and forecast 2022-2027 ($ million)
- Exhibit 97: Data Table on China - Market size and forecast 2022-2027 ($ million)
- Exhibit 98: Chart on China - Year-over-year growth 2022-2027 (%)
- Exhibit 99: Data Table on China - Year-over-year growth 2022-2027 (%)
- 8.9 US - Market size and forecast 2022-2027
- Exhibit 100: Chart on US - Market size and forecast 2022-2027 ($ million)
- Exhibit 101: Data Table on US - Market size and forecast 2022-2027 ($ million)
- Exhibit 102: Chart on US - Year-over-year growth 2022-2027 (%)
- Exhibit 103: Data Table on US - Year-over-year growth 2022-2027 (%)
- 8.10 Germany - Market size and forecast 2022-2027
- Exhibit 104: Chart on Germany - Market size and forecast 2022-2027 ($ million)
- Exhibit 105: Data Table on Germany - Market size and forecast 2022-2027 ($ million)
- Exhibit 106: Chart on Germany - Year-over-year growth 2022-2027 (%)
- Exhibit 107: Data Table on Germany - Year-over-year growth 2022-2027 (%)
- 8.11 Canada - Market size and forecast 2022-2027
- Exhibit 108: Chart on Canada - Market size and forecast 2022-2027 ($ million)
- Exhibit 109: Data Table on Canada - Market size and forecast 2022-2027 ($ million)
- Exhibit 110: Chart on Canada - Year-over-year growth 2022-2027 (%)
- Exhibit 111: Data Table on Canada - Year-over-year growth 2022-2027 (%)
- 8.12 Japan - Market size and forecast 2022-2027
- Exhibit 112: Chart on Japan - Market size and forecast 2022-2027 ($ million)
- Exhibit 113: Data Table on Japan - Market size and forecast 2022-2027 ($ million)
- Exhibit 114: Chart on Japan - Year-over-year growth 2022-2027 (%)
- Exhibit 115: Data Table on Japan - Year-over-year growth 2022-2027 (%)
- 8.13 Market opportunity by geography
- Exhibit 116: Market opportunity by geography ($ million)
9 Drivers, Challenges, and Trends
- 9.1 Market drivers
- 9.2 Market challenges
- 9.3 Impact of drivers and challenges
- Exhibit 117: Impact of drivers and challenges in 2022 and 2027
- 9.4 Market trends
10 Vendor Landscape
- 10.1 Overview
- 10.2 Vendor landscape
- Exhibit 118: Overview on Criticality of inputs and Factors of differentiation
- 10.3 Landscape disruption
- Exhibit 119: Overview on factors of disruption
- 10.4 Industry risks
- Exhibit 120: Impact of key risks on business
11 Vendor Analysis
- 11.1 Vendors covered
- Exhibit 121: Vendors covered
- 11.2 Market positioning of vendors
- Exhibit 122: Matrix on vendor position and classification
- 11.3 AB Electrolux
- Exhibit 123: AB Electrolux - Overview
- Exhibit 124: AB Electrolux - Business segments
- Exhibit 125: AB Electrolux - Key news
- Exhibit 126: AB Electrolux - Key offerings
- Exhibit 127: AB Electrolux - Segment focus
- 11.4 Ali Group Srl
- Exhibit 128: Ali Group Srl - Overview
- Exhibit 129: Ali Group Srl - Product / Service
- Exhibit 130: Ali Group Srl - Key offerings
- 11.5 Blue Star Ltd.
- Exhibit 131: Blue Star Ltd. - Overview
- Exhibit 132: Blue Star Ltd. - Business segments
- Exhibit 133: Blue Star Ltd. - Key offerings
- Exhibit 134: Blue Star Ltd. - Segment focus
- 11.6 Daikin Industries Ltd.
- Exhibit 135: Daikin Industries Ltd. - Overview
- Exhibit 136: Daikin Industries Ltd. - Business segments
- Exhibit 137: Daikin Industries Ltd. - Key news
- Exhibit 138: Daikin Industries Ltd. - Key offerings
- Exhibit 139: Daikin Industries Ltd. - Segment focus
- 11.7 Dover Corp.
- Exhibit 140: Dover Corp. - Overview
- Exhibit 141: Dover Corp. - Business segments
- Exhibit 142: Dover Corp. - Key news
- Exhibit 143: Dover Corp. - Key offerings
- Exhibit 144: Dover Corp. - Segment focus
- 11.8 Felix Storch Inc.
- Exhibit 145: Felix Storch Inc. - Overview
- Exhibit 146: Felix Storch Inc. - Product / Service
- Exhibit 147: Felix Storch Inc. - Key offerings
- 11.9 FUJIMAK Corp.
- Exhibit 148: FUJIMAK Corp. - Overview
- Exhibit 149: FUJIMAK Corp. - Product / Service
- Exhibit 150: FUJIMAK Corp. - Key offerings
- 11.10 HOSHIZAKI Corp.
- Exhibit 151: HOSHIZAKI Corp. - Overview
- Exhibit 152: HOSHIZAKI Corp. - Business segments
- Exhibit 153: HOSHIZAKI Corp. - Key news
- Exhibit 154: HOSHIZAKI Corp. - Key offerings
- Exhibit 155: HOSHIZAKI Corp. - Segment focus
- 11.11 Illinois Tool Works Inc.
- Exhibit 156: Illinois Tool Works Inc. - Overview
- Exhibit 157: Illinois Tool Works Inc. - Business segments
- Exhibit 158: Illinois Tool Works Inc. - Key offerings
- Exhibit 159: Illinois Tool Works Inc. - Segment focus
- 11.12 Imbera
- Exhibit 160: Imbera - Overview
- Exhibit 161: Imbera - Product / Service
- Exhibit 162: Imbera - Key offerings
- 11.13 Lennox International Inc.
- Exhibit 163: Lennox International Inc. - Overview
- Exhibit 164: Lennox International Inc. - Business segments
- Exhibit 165: Lennox International Inc. - Key offerings
- Exhibit 166: Lennox International Inc. - Segment focus
- 11.14 Panasonic Holdings Corp.
- Exhibit 167: Panasonic Holdings Corp. - Overview
- Exhibit 168: Panasonic Holdings Corp. - Business segments
- Exhibit 169: Panasonic Holdings Corp. - Key news
- Exhibit 170: Panasonic Holdings Corp. - Key offerings
- Exhibit 171: Panasonic Holdings Corp. - Segment focus
- 11.15 Standex International Corp.
- Exhibit 172: Standex International Corp. - Overview
- Exhibit 173: Standex International Corp. - Business segments
- Exhibit 174: Standex International Corp. - Key offerings
- Exhibit 175: Standex International Corp. - Segment focus
- 11.16 The Middleby Corp.
- Exhibit 176: The Middleby Corp. - Overview
- Exhibit 177: The Middleby Corp. - Business segments
- Exhibit 178: The Middleby Corp. - Key offerings
- Exhibit 179: The Middleby Corp. - Segment focus
- 11.17 Welbilt Inc.
- Exhibit 180: Welbilt Inc. - Overview
- Exhibit 181: Welbilt Inc. - Business segments
- Exhibit 182: Welbilt Inc. - Key news
- Exhibit 183: Welbilt Inc. - Key offerings
- Exhibit 184: Welbilt Inc. - Segment focus
12 Appendix
- 12.1 Scope of the report
- 12.2 Inclusions and exclusions checklist
- Exhibit 185: Inclusions checklist
- Exhibit 186: Exclusions checklist
- 12.3 Currency conversion rates for US$
- Exhibit 187: Currency conversion rates for US$
- 12.4 Research methodology
- Exhibit 188: Research methodology
- Exhibit 189: Validation techniques employed for market sizing
- Exhibit 190: Information sources
- 12.5 List of abbreviations
- Exhibit 191: List of abbreviations
Technavio is a leading global technology research and advisory company. Their research and analysis focus on emerging market trends and provide actionable insights to help businesses identify market opportunities and develop effective strategies to optimize their market positions. With over 500 specialized analysts, Technavio's report library Their client base consists of enterprises of all sizes, including more than 100 Fortune 500 companies. This growing client base relies on Technavio's comprehensive coverage, extensive research, and actionable market insights to identify opportunities in existing and potential markets and assess their competitive positions within changing market scenarios.
Contact
Technavio Research
Jesse Maida
Media & Marketing Executive
US: +1 844 364 1100
UK: +44 203 893 3200
Email: media@technavio.com
Website: www.technavio.com/


SOURCE Technavio
© 2024 Benzinga.com. Benzinga does not provide investment advice. All rights reserved.
Trade confidently with insights and alerts from analyst ratings, free reports and breaking news that affects the stocks you care about.

