


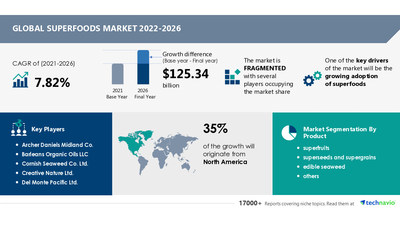
NEW YORK, Nov. 22, 2022 /PRNewswire/ -- The superfoods market size is expected to grow by USD 125.34 billion from 2021 to 2026. In addition, the growth momentum of the market will accelerate at a CAGR of 7.82% during the forecast period. The superfoods market is driven by the growing adoption of superfoods. In addition, the application of superfood ingredients in beauty and personal care products is anticipated to be a key trend in the market. Make confident decisions using our analysis and analysis. Download a Free Sample Report

Superfoods Market Product Outlook (Revenue, USD billion, 2021-2026)
- Superfruits - size and forecast 2021-2026
- Superseeds and supergrains - size and forecast 2021-2026
- Edible seaweed - size and forecast 2021-2026
- Others - size and forecast 2021-2026
Superfoods Market Geography Outlook (Revenue, USD billion, 2021-2026)
- North America - size and forecast 2021-2026
- Europe - size and forecast 2021-2026
- APAC - size and forecast 2021-2026
- South America - size and forecast 2021-2026
- Middle East and Africa - size and forecast 2021-2026
Learn about the contribution of each segment -View a FREE PDF Sample Report
Market Segmentation
The superfruits segment will be a significant contributor to market growth during the forecast period. Exotic fruits, including goji berries, acai berries, noni, and pomegranate, have large amounts of antioxidants, vitamins, and phytochemicals that prevent diseases such as heart diseases and strokes. Each superfruit has unique health benefits. For instance, kiwi can break down protein quickly and effectively. Beetroot is a natural blood purifier and detoxifier that helps in eliminating toxins from the human body. Moreover, with the rise in COVID-19 cases in 2020, consumers started to prefer superfruits such as berries, oranges, and watermelons to strengthen the immune system. Hence, owing to the various health benefits of superfruits, their demand is expected to rise high during the forecast period.
Major Superfood Companies and their Offerings
- Archer Daniels Midland Co. - The company offers superfood products such as acidulants, alternative proteins, beans, pulses, nuts, and seeds.
- Creative Nature Ltd. - The company offers superfood products such as apple pie protein and salted caramel.
- Del Monte Pacific Ltd. - The company offers superfood products such as Del Monte Vinamilk and Del Monte Vinamilk fresh milk.
- General Mills Inc. - The company offers superfood product brands such as Cascadian Farm, Doolies, and Green Giant.
- Healthy Truth - The company offers superfood products such as organic sprouted cacao plant-based protein bars, organic sprouted mixed berry plant-based protein bars, and organic sprouted vanilla plant-based protein bars.
- ITC Ltd. - The company offers superfood products such as gluten-free flour, multi-millet mix, and ragi flour.
- Navitas LLC - The company offers superfood products such as hemp seed, mulberries, and goji berries.
- Barleans Organic Oils LLC
- Cornish Seaweed Co. Ltd.
- Nua Naturals
- Nutiva Inc.
- Nutrisure Ltd.
- Ocean Spray Cranberries Inc.
- Power Super Foods
- Rhythm Foods
- Suncore Foods Inc.
- Sunfood
- Superlife Co. Pte. Ltd.
- The Apax Group Inc.
Get lifetime access to our Technavio Insights! Subscribe to our Basic Plan billed annually at USD 5000
Related Reports
Avocado Oil Market by Product, Distribution Channel, and Geography - Forecast and Analysis 2023-2027: The health benefits of avocado oil are driving the avocado oil market growth. Avocado is rich in nutrients and has a high amount of proteins, iron, magnesium, vitamins, and minerals. It has a good amount of omega-3 fats, oleic acid, dietary fiber, folic acid, potassium, and vitamins A, B1, B2, B3, B5, B6, E, K, and C.
Fermented Food and Drinks Market by Distribution Channel, Product, and Geography - Forecast and Analysis 2022-2026: The packaging innovations and increasing marketing initiatives are driving the fermented food and drinks market growth. Many players are differentiating their products from that of their rivals by using innovative packaging. For instance, in 2017, SINGHA launched U Beer 2017 with an ABV of 5% in Thailand.
Superfoods Market Scope | |
Report Coverage | Details |
Page number | 120 |
Base year | 2021 |
Forecast period | 2022-2026 |
Growth momentum & CAGR | Accelerate at a CAGR of 7.82% |
Market growth 2022-2026 | USD 125.34 billion |
Market structure | Fragmented |
YoY growth (%) | 7.7 |
Regional analysis | North America, Europe, APAC, South America, and Middle East and Africa |
Performing market contribution | North America at 35% |
Key consumer countries | US, Canada, China, Germany, and UK |
Competitive landscape | Leading companies, Competitive strategies, Consumer engagement scope |
Key companies profiled | Archer Daniels Midland Co., Barleans Organic Oils LLC, Cornish Seaweed Co. Ltd., Creative Nature Ltd., Del Monte Pacific Ltd., General Mills Inc., Healthy Truth, ITC Ltd., Navitas LLC, Nua Naturals, Nutiva Inc., Nutrisure Ltd., Ocean Spray Cranberries Inc., Power Super Foods, Rhythm Foods, Suncore Foods Inc., Sunfood, Superlife Co. Pte. Ltd., and The Apax Group Inc. |
Market dynamics | Parent market analysis, Market growth inducers and obstacles, Fast-growing and slow-growing segment analysis, COVID-19 impact and recovery analysis and future consumer dynamics, and Market condition analysis for the forecast period. |
Customization purview | If our report has not included the data that you are looking for, you can reach out to our analysts and get segments customized. |
Browse Consumer Staples Market Reports
Table of Contents
1 Executive Summary
- 1.1 Market overview
- Exhibit 01: Executive Summary – Chart on Market Overview
- Exhibit 02: Executive Summary – Data Table on Market Overview
- Exhibit 03: Executive Summary – Chart on Global Market Characteristics
- Exhibit 04: Executive Summary – Chart on Market by Geography
- Exhibit 05: Executive Summary – Chart on Market Segmentation by Product
- Exhibit 06: Executive Summary – Chart on Incremental Growth
- Exhibit 07: Executive Summary – Data Table on Incremental Growth
- Exhibit 08: Executive Summary – Chart on Vendor Market Positioning
2 Market Landscape
- 2.1 Market ecosystem
- Exhibit 09: Parent market
- Exhibit 10: Market Characteristics
3 Market Sizing
- 3.1 Market definition
- Exhibit 11: Offerings of vendors included in the market definition
- 3.2 Market segment analysis
- Exhibit 12: Market segments
- 3.3 Market size 2021
- 3.4 Market outlook: Forecast for 2021-2026
- Exhibit 13: Chart on Global - Market size and forecast 2021-2026 ($ billion)
- Exhibit 14: Data Table on Global - Market size and forecast 2021-2026 ($ billion)
- Exhibit 15: Chart on Global Market: Year-over-year growth 2021-2026 (%)
- Exhibit 16: Data Table on Global Market: Year-over-year growth 2021-2026 (%)
4 Five Forces Analysis
- 4.1 Five forces summary
- Exhibit 17: Five forces analysis - Comparison between 2021 and 2026
- 4.2 Bargaining power of buyers
- Exhibit 18: Chart on Bargaining power of buyers – Impact of key factors 2021 and 2026
- 4.3 Bargaining power of suppliers
- Exhibit 19: Bargaining power of suppliers – Impact of key factors in 2021 and 2026
- 4.4 Threat of new entrants
- Exhibit 20: Threat of new entrants – Impact of key factors in 2021 and 2026
- 4.5 Threat of substitutes
- Exhibit 21: Threat of substitutes – Impact of key factors in 2021 and 2026
- 4.6 Threat of rivalry
- Exhibit 22: Threat of rivalry – Impact of key factors in 2021 and 2026
- 4.7 Market condition
- Exhibit 23: Chart on Market condition - Five forces 2021 and 2026
5 Market Segmentation by Product
- 5.1 Market segments
- Exhibit 24: Chart on Product - Market share 2021-2026 (%)
- Exhibit 25: Data Table on Product - Market share 2021-2026 (%)
- 5.2 Comparison by Product
- Exhibit 26: Chart on Comparison by Product
- Exhibit 27: Data Table on Comparison by Product
- 5.3 Superfruits - Market size and forecast 2021-2026
- Exhibit 28: Chart on Superfruits - Market size and forecast 2021-2026 ($ billion)
- Exhibit 29: Data Table on Superfruits - Market size and forecast 2021-2026 ($ billion)
- Exhibit 30: Chart on Superfruits - Year-over-year growth 2021-2026 (%)
- Exhibit 31: Data Table on Superfruits - Year-over-year growth 2021-2026 (%)
- 5.4 Superseeds and supergrains - Market size and forecast 2021-2026
- Exhibit 32: Chart on Superseeds and supergrains - Market size and forecast 2021-2026 ($ billion)
- Exhibit 33: Data Table on Superseeds and supergrains - Market size and forecast 2021-2026 ($ billion)
- Exhibit 34: Chart on Superseeds and supergrains - Year-over-year growth 2021-2026 (%)
- Exhibit 35: Data Table on Superseeds and supergrains - Year-over-year growth 2021-2026 (%)
- 5.5 Edible seaweed - Market size and forecast 2021-2026
- Exhibit 36: Chart on Edible seaweed - Market size and forecast 2021-2026 ($ billion)
- Exhibit 37: Data Table on Edible seaweed - Market size and forecast 2021-2026 ($ billion)
- Exhibit 38: Chart on Edible seaweed - Year-over-year growth 2021-2026 (%)
- Exhibit 39: Data Table on Edible seaweed - Year-over-year growth 2021-2026 (%)
- 5.6 Others - Market size and forecast 2021-2026
- Exhibit 40: Chart on Others - Market size and forecast 2021-2026 ($ billion)
- Exhibit 41: Data Table on Others - Market size and forecast 2021-2026 ($ billion)
- Exhibit 42: Chart on Others - Year-over-year growth 2021-2026 (%)
- Exhibit 43: Data Table on Others - Year-over-year growth 2021-2026 (%)
- 5.7 Market opportunity by Product
- Exhibit 44: Market opportunity by Product ($ billion)
6 Customer Landscape
- 6.1 Customer landscape overview
- Exhibit 45: Analysis of price sensitivity, lifecycle, customer purchase basket, adoption rates, and purchase criteria
7 Geographic Landscape
- 7.1 Geographic segmentation
- Exhibit 46: Chart on Market share by geography 2021-2026 (%)
- Exhibit 47: Data Table on Market share by geography 2021-2026 (%)
- 7.2 Geographic comparison
- Exhibit 48: Chart on Geographic comparison
- Exhibit 49: Data Table on Geographic comparison
- 7.3 North America - Market size and forecast 2021-2026
- Exhibit 50: Chart on North America - Market size and forecast 2021-2026 ($ billion)
- Exhibit 51: Data Table on North America - Market size and forecast 2021-2026 ($ billion)
- Exhibit 52: Chart on North America - Year-over-year growth 2021-2026 (%)
- Exhibit 53: Data Table on North America - Year-over-year growth 2021-2026 (%)
- 7.4 Europe - Market size and forecast 2021-2026
- Exhibit 54: Chart on Europe - Market size and forecast 2021-2026 ($ billion)
- Exhibit 55: Data Table on Europe - Market size and forecast 2021-2026 ($ billion)
- Exhibit 56: Chart on Europe - Year-over-year growth 2021-2026 (%)
- Exhibit 57: Data Table on Europe - Year-over-year growth 2021-2026 (%)
- 7.5 APAC - Market size and forecast 2021-2026
- Exhibit 58: Chart on APAC - Market size and forecast 2021-2026 ($ billion)
- Exhibit 59: Data Table on APAC - Market size and forecast 2021-2026 ($ billion)
- Exhibit 60: Chart on APAC - Year-over-year growth 2021-2026 (%)
- Exhibit 61: Data Table on APAC - Year-over-year growth 2021-2026 (%)
- 7.6 South America - Market size and forecast 2021-2026
- Exhibit 62: Chart on South America - Market size and forecast 2021-2026 ($ billion)
- Exhibit 63: Data Table on South America - Market size and forecast 2021-2026 ($ billion)
- Exhibit 64: Chart on South America - Year-over-year growth 2021-2026 (%)
- Exhibit 65: Data Table on South America - Year-over-year growth 2021-2026 (%)
- 7.7 Middle East and Africa - Market size and forecast 2021-2026
- Exhibit 66: Chart on Middle East and Africa - Market size and forecast 2021-2026 ($ billion)
- Exhibit 67: Data Table on Middle East and Africa - Market size and forecast 2021-2026 ($ billion)
- Exhibit 68: Chart on Middle East and Africa - Year-over-year growth 2021-2026 (%)
- Exhibit 69: Data Table on Middle East and Africa - Year-over-year growth 2021-2026 (%)
- 7.8 US - Market size and forecast 2021-2026
- Exhibit 70: Chart on US - Market size and forecast 2021-2026 ($ billion)
- Exhibit 71: Data Table on US - Market size and forecast 2021-2026 ($ billion)
- Exhibit 72: Chart on US - Year-over-year growth 2021-2026 (%)
- Exhibit 73: Data Table on US - Year-over-year growth 2021-2026 (%)
- 7.9 Germany - Market size and forecast 2021-2026
- Exhibit 74: Chart on Germany - Market size and forecast 2021-2026 ($ billion)
- Exhibit 75: Data Table on Germany - Market size and forecast 2021-2026 ($ billion)
- Exhibit 76: Chart on Germany - Year-over-year growth 2021-2026 (%)
- Exhibit 77: Data Table on Germany - Year-over-year growth 2021-2026 (%)
- 7.10 China - Market size and forecast 2021-2026
- Exhibit 78: Chart on China - Market size and forecast 2021-2026 ($ billion)
- Exhibit 79: Data Table on China - Market size and forecast 2021-2026 ($ billion)
- Exhibit 80: Chart on China - Year-over-year growth 2021-2026 (%)
- Exhibit 81: Data Table on China - Year-over-year growth 2021-2026 (%)
- 7.11 Canada - Market size and forecast 2021-2026
- Exhibit 82: Chart on Canada - Market size and forecast 2021-2026 ($ billion)
- Exhibit 83: Data Table on Canada - Market size and forecast 2021-2026 ($ billion)
- Exhibit 84: Chart on Canada - Year-over-year growth 2021-2026 (%)
- Exhibit 85: Data Table on Canada - Year-over-year growth 2021-2026 (%)
- 7.12 UK - Market size and forecast 2021-2026
- Exhibit 86: Chart on UK - Market size and forecast 2021-2026 ($ billion)
- Exhibit 87: Data Table on UK - Market size and forecast 2021-2026 ($ billion)
- Exhibit 88: Chart on UK - Year-over-year growth 2021-2026 (%)
- Exhibit 89: Data Table on UK - Year-over-year growth 2021-2026 (%)
- 7.13 Market opportunity by geography
- Exhibit 90: Market opportunity by geography ($ billion)
8 Drivers, Challenges, and Trends
- 8.1 Market drivers
- 8.2 Market challenges
- 8.3 Impact of drivers and challenges
- Exhibit 91: Impact of drivers and challenges in 2021 and 2026
- 8.4 Market trends
9 Vendor Landscape
- 9.1 Overview
- 9.2 Vendor landscape
- Exhibit 92: Overview on Criticality of inputs and Factors of differentiation
- 9.3 Landscape disruption
- Exhibit 93: Overview on factors of disruption
- 9.4 Industry risks
- Exhibit 94: Impact of key risks on business
10 Vendor Analysis
- 10.1 Vendors covered
- Exhibit 95: Vendors covered
- 10.2 Market positioning of vendors
- Exhibit 96: Matrix on vendor position and classification
- 10.3 Archer Daniels Midland Co.
- Exhibit 97: Archer Daniels Midland Co. - Overview
- Exhibit 98: Archer Daniels Midland Co. - Business segments
- Exhibit 99: Archer Daniels Midland Co. - Key offerings
- Exhibit 100: Archer Daniels Midland Co. - Segment focus
- 10.4 Creative Nature Ltd.
- Exhibit 101: Creative Nature Ltd. - Overview
- Exhibit 102: Creative Nature Ltd. - Product / Service
- Exhibit 103: Creative Nature Ltd. - Key offerings
- 10.5 Del Monte Pacific Ltd.
- Exhibit 104: Del Monte Pacific Ltd. - Overview
- Exhibit 105: Del Monte Pacific Ltd. - Business segments
- Exhibit 106: Del Monte Pacific Ltd. - Key offerings
- Exhibit 107: Del Monte Pacific Ltd. - Segment focus
- 10.6 General Mills Inc.
- Exhibit 108: General Mills Inc. - Overview
- Exhibit 109: General Mills Inc. - Business segments
- Exhibit 110: General Mills Inc. - Key offerings
- Exhibit 111: General Mills Inc. - Segment focus
- 10.7 Healthy Truth
- Exhibit 112: Healthy Truth - Overview
- Exhibit 113: Healthy Truth - Product / Service
- Exhibit 114: Healthy Truth - Key offerings
- 10.8 ITC Ltd.
- Exhibit 115: ITC Ltd. - Overview
- Exhibit 116: ITC Ltd. - Business segments
- Exhibit 117: ITC Ltd. - Key offerings
- Exhibit 118: ITC Ltd. - Segment focus
- 10.9 Navitas LLC
- Exhibit 119: Navitas LLC - Overview
- Exhibit 120: Navitas LLC - Product / Service
- Exhibit 121: Navitas LLC - Key offerings
- 10.10 Rhythm Foods
- Exhibit 122: Rhythm Foods - Overview
- Exhibit 123: Rhythm Foods - Product / Service
- Exhibit 124: Rhythm Foods - Key offerings
- 10.11 Sunfood
- Exhibit 125: Sunfood - Overview
- Exhibit 126: Sunfood - Product / Service
- Exhibit 127: Sunfood - Key offerings
- 10.12 Superlife Co. Pte. Ltd.
- Exhibit 128: Superlife Co. Pte. Ltd. - Overview
- Exhibit 129: Superlife Co. Pte. Ltd. - Product / Service
- Exhibit 130: Superlife Co. Pte. Ltd. - Key offerings
11 Appendix
- 11.1 Scope of the report
- 11.2 Inclusions and exclusions checklist
- Exhibit 131: Inclusions checklist
- Exhibit 132: Exclusions checklist
- 11.3 Currency conversion rates for US$
- Exhibit 133: Currency conversion rates for US$
- 11.4 Research methodology
- Exhibit 134: Research methodology
- Exhibit 135: Validation techniques employed for market sizing
- Exhibit 136: Information sources
- 11.5 List of abbreviations
- Exhibit 137: List of abbreviations
Technavio is a leading global technology research and advisory company. Their research and analysis focus on emerging market trends and provide actionable insights to help businesses identify market opportunities and develop effective strategies to optimize their market positions.
With over 500 specialized analysts, Technavio's report library consists of more than 17,000 reports and counting, covering 800 technologies, spanning across 50 countries. Their client base consists of enterprises of all sizes, including more than 100 Fortune 500 companies. This growing client base relies on Technavio's comprehensive coverage, extensive research, and actionable market insights to identify opportunities in existing and potential markets and assess their competitive positions within changing market scenarios.
Contacts
Technavio Research
Jesse Maida
Media & Marketing Executive
US: +1 844 364 1100
UK: +44 203 893 3200
Email: media@technavio.com
Website: www.technavio.com/
Newsroom: https://newsroom.technavio.org/news/superfoods-market


SOURCE Technavio
© 2024 Benzinga.com. Benzinga does not provide investment advice. All rights reserved.
Trade confidently with insights and alerts from analyst ratings, free reports and breaking news that affects the stocks you care about.

