


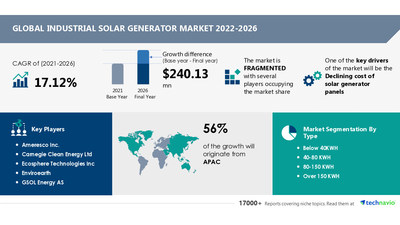
NEW YORK, Nov. 15, 2022 /PRNewswire/ -- The industrial solar generator market research report provides a detailed analysis of emerging market trends, regional outlook, competitive landscape, and a comprehensive analysis of different market segments. The industrial solar generator market is projected to grow by USD 240.13 million from 2021 to 2026, progressing at a CAGR of 17.12% during the forecast period. Technavio industrial solar generator market report has been prepared by focusing on both qualitative & quantitative aspects which cover- market trends, market drivers, Five forces analysis, challenges, key factors, Market size and forecast, Market segmentation, Geographical insights, and Competitive Landscape. View a Free Sample Report on the Industrial Solar Generator Market in MINUTES.

Industrial Solar Generator Market: Vendor Offerings
The report analyzes the market's competitive landscape and offers information on several market vendors, including:
- Ameresco Inc.: The company offers solar generators through the Simpliphi brand.
- Carnegie Clean Energy Ltd: The company offers solar generators such as PV generators.
- Enviroearth: The company offers solar generators through the Tanzania brand.
- Intech GmbH and Co. KG: The company offers solar generator such as backup generator 20 Kva.
- Jakson Group: The company offers solar generators such as solar-powered generators that are an ideal power backup for homes and commercial applications.
To find additional highlights on the growth strategies adopted by vendors and their product offerings, Read a Free Sample Report.
Industrial Solar Generator Market: Segmentation Analysis
- By Type
- Below 40kWh
- The industrial solar generator market share growth in the below 40 kWh segment will be significant during the forecast period. This type of solar generator can supply power backup during blackouts without adversely affecting the efficiency and productivity of industrial operations. It is also well-suited to handle fluctuating minor loads. There is a rising demand for small-capacity solar generators, such as those with capacities under 40 kWh due to the increase in urbanization and population.
- 40-80 kWh
- 80-150 kWh
- Over 150 kWh
- By Geography
- APAC
- APAC will account for 56% of market growth. The main markets in APAC for industrial solar generators are China, Japan, and India. The market in this region will expand more slowly than markets in other regions. The industrial solar generator market will expand in APAC due to falling solar generator panel prices.
- Europe
- North America
- South America
- Middle East and Africa
To know additional highlights and key points on various market segments and their impact in coming years, Get a Free Sample Report.
Parent market Analysis
The global industrial solar generator market is a part of the global renewable electricity market within the global utility market. The parent global renewable electricity market covers companies engaged in the generation and distribution of electricity using renewable sources.
The global independent power and renewable electricity market size include combined revenue generated by companies involved in the generation and distribution of independent power producers, gas and power marketing and trading specialists, and integrated energy merchants and renewable electricity. The market also includes manufacturers of raw materials and equipment used in the solar power market.
The following factors will drive growth in the global renewable electricity market:
- Supporting policies and targets for the deployment of renewable power
- Declining costs of renewable energy technologies
- Increasing demand for renewable power due to environmental concerns
- Technological advances
- The declining price of Li-ion batteries
To unlock information about vendor drive costs and customer service, download a free sample report.
Imperative Insights on the following aspects:
- What was the size of the global industrial solar generator industry by value?
- What will be the size of the global industrial solar generator industry in 2026?
- What factors are affecting the strength of competition in the global industrial solar generator industry?
- How has the industry performed over the last five years?
- What main segments make up the global industrial solar generator market?
Get lifetime access to our Technavio Insights! Subscribe to our "Basic Plan" billed annually at USD 5000.
Why buy?
- Add credibility to your strategies
- Refine your business plan & growth
- Get a Holistic View of the Market
Refine Your Business Goals by Buying the Industrial Solar Generator Market report, Buy the Sample Report Now!
Related Reports:
Portable Power Station Market in Europe by Source, Technology, and Geography - Forecast and Analysis 2022-2026: The report extensively covers the portable power station market in Europe segmentation by source (hybrid and direct) and technology (lithium-ion and sealed lead-acid).
Wind Energy Market by Type and Geography - Forecast and Analysis 2022-2026: The report extensively covers the wind energy market segmentation by type (onshore and offshore) and geography (APAC, North America, Europe, South America, and the Middle East and Africa).
Industrial Solar Generator Market Scope | |
Report Coverage | Details |
Page number | 120 |
Base year | 2021 |
Forecast period | 2022-2026 |
Growth momentum & CAGR | Accelerate at a CAGR of 17.12% |
Market growth 2022-2026 | $240.13 million |
Market structure | Fragmented |
YoY growth (%) | 12.27 |
Regional analysis | APAC, Europe, North America, South America, and Middle East and Africa |
Performing market contribution | APAC at 56% |
Key consumer countries | US, China, Japan, India, and Germany |
Competitive landscape | Leading companies, competitive strategies, consumer engagement scope |
Companies profiled | Ameresco Inc., Carnegie Clean Energy Ltd, Ecosphere Technologies Inc, Enviroearth, GSOL Energy AS, HCI Energy Inc., Intech GmbH and Co. KG, JA Solar Technology Co. Ltd., Jakson Group, Kirchner Solar Group GmbH, Longi green energy technology Co. Ltd, MVV Energie AG, Off Grid Europe GmbH, Photon Energy Ltd, REDAVIA GmbH, Reliance Industries Ltd., Shanghai Aiko Solar Energy Co Ltd, Silicon CPV Ltd, Tongwei Group Co. Ltd, and Xando Energy LLC |
Market Dynamics | Parent market analysis, Market growth inducers and obstacles, Fast-growing and slow-growing segment analysis, COVID-19 impact and future consumer dynamics, and market condition analysis for the forecast period. |
Customization purview | If our report has not included the data that you are looking for, you can reach out to our analysts and get segments customized. |
1 Executive Summary
- 1.1 Market Overview
- Exhibit 01: Executive Summary – Chart on Market Overview
- Exhibit 02: Executive Summary – Data Table on Market Overview
- Exhibit 03: Executive Summary – Chart on Global Market Characteristics
- Exhibit 04: Executive Summary – Chart on Market by Geography
- Exhibit 05: Executive Summary – Chart on Market Segmentation by Type
- Exhibit 06: Executive Summary – Chart on Incremental Growth
- Exhibit 07: Executive Summary – Data Table on Incremental Growth
- Exhibit 08: Executive Summary – Chart on Vendor Market Positioning
2 Market Landscape
- 2.1 Market ecosystem
- Exhibit 09: Parent market
- Exhibit 10: Market Characteristics
3 Market Sizing
- 3.1 Market definition
- Exhibit 11: Offerings of vendors included in the market definition
- 3.2 Market segment analysis
- Exhibit 12: Market segments
- 3.3 Market size 2021
- 3.4 Market outlook: Forecast for 2021-2026
- Exhibit 13: Chart on Global - Market size and forecast 2021-2026 ($ million)
- Exhibit 14: Data Table on Global - Market size and forecast 2021-2026 ($ million)
- Exhibit 15: Chart on Global Market: Year-over-year growth 2021-2026 (%)
- Exhibit 16: Data Table on Global Market: Year-over-year growth 2021-2026 (%)
4 Five Forces Analysis
- 4.1 Five forces summary
- Exhibit 17: Five forces analysis - Comparison between 2021 and 2026
- 4.2 Bargaining power of buyers
- Exhibit 18: Chart on Bargaining power of buyers – Impact of key factors 2021 and 2026
- 4.3 Bargaining power of suppliers
- Exhibit 19: Bargaining power of suppliers – Impact of key factors in 2021 and 2026
- 4.4 Threat of new entrants
- Exhibit 20: Threat of new entrants – Impact of key factors in 2021 and 2026
- 4.5 Threat of substitutes
- Exhibit 21: Threat of substitutes – Impact of key factors in 2021 and 2026
- 4.6 Threat of rivalry
- Exhibit 22: Threat of rivalry – Impact of key factors in 2021 and 2026
- 4.7 Market condition
- Exhibit 23: Chart on Market condition - Five forces 2021 and 2026
5 Market Segmentation by Type
- 5.1 Market segments
- Exhibit 24: Chart on Type - Market share 2021-2026 (%)
- Exhibit 25: Data Table on Type - Market share 2021-2026 (%)
- 5.2 Comparison by Type
- Exhibit 26: Chart on Comparison by Type
- Exhibit 27: Data Table on Comparison by Type
- 5.3 Below 40KWH - Market size and forecast 2021-2026
- Exhibit 28: Chart on Below 40KWH - Market size and forecast 2021-2026 ($ million)
- Exhibit 29: Data Table on Below 40KWH - Market size and forecast 2021-2026 ($ million)
- Exhibit 30: Chart on Below 40KWH - Year-over-year growth 2021-2026 (%)
- Exhibit 31: Data Table on Below 40KWH - Year-over-year growth 2021-2026 (%)
- 5.4 40-80 KWH - Market size and forecast 2021-2026
- Exhibit 32: Chart on 40-80 KWH - Market size and forecast 2021-2026 ($ million)
- Exhibit 33: Data Table on 40-80 KWH - Market size and forecast 2021-2026 ($ million)
- Exhibit 34: Chart on 40-80 KWH - Year-over-year growth 2021-2026 (%)
- Exhibit 35: Data Table on 40-80 KWH - Year-over-year growth 2021-2026 (%)
- 5.5 80-150 KWH - Market size and forecast 2021-2026
- Exhibit 36: Chart on 80-150 KWH - Market size and forecast 2021-2026 ($ million)
- Exhibit 37: Data Table on 80-150 KWH - Market size and forecast 2021-2026 ($ million)
- Exhibit 38: Chart on 80-150 KWH - Year-over-year growth 2021-2026 (%)
- Exhibit 39: Data Table on 80-150 KWH - Year-over-year growth 2021-2026 (%)
- 5.6 Over 150 KWH - Market size and forecast 2021-2026
- Exhibit 40: Chart on Over 150 KWH - Market size and forecast 2021-2026 ($ million)
- Exhibit 41: Data Table on Over 150 KWH - Market size and forecast 2021-2026 ($ million)
- Exhibit 42: Chart on Over 150 KWH - Year-over-year growth 2021-2026 (%)
- Exhibit 43: Data Table on Over 150 KWH - Year-over-year growth 2021-2026 (%)
- 5.7 Market opportunity by Type
- Exhibit 44: Market opportunity by Type ($ million)
6 Customer Landscape
- 6.1 Customer landscape overview
- Exhibit 45: Analysis of price sensitivity, lifecycle, customer purchase basket, adoption rates, and purchase criteria
7 Geographic Landscape
- 7.1 Geographic segmentation
- Exhibit 46: Chart on Market share by geography 2021-2026 (%)
- Exhibit 47: Data Table on Market share by geography 2021-2026 (%)
- 7.2 Geographic comparison
- Exhibit 48: Chart on Geographic comparison
- Exhibit 49: Data Table on Geographic comparison
- 7.3 APAC - Market size and forecast 2021-2026
- Exhibit 50: Chart on APAC - Market size and forecast 2021-2026 ($ million)
- Exhibit 51: Data Table on APAC - Market size and forecast 2021-2026 ($ million)
- Exhibit 52: Chart on APAC - Year-over-year growth 2021-2026 (%)
- Exhibit 53: Data Table on APAC - Year-over-year growth 2021-2026 (%)
- 7.4 Europe - Market size and forecast 2021-2026
- Exhibit 54: Chart on Europe - Market size and forecast 2021-2026 ($ million)
- Exhibit 55: Data Table on Europe - Market size and forecast 2021-2026 ($ million)
- Exhibit 56: Chart on Europe - Year-over-year growth 2021-2026 (%)
- Exhibit 57: Data Table on Europe - Year-over-year growth 2021-2026 (%)
- 7.5 North America - Market size and forecast 2021-2026
- Exhibit 58: Chart on North America - Market size and forecast 2021-2026 ($ million)
- Exhibit 59: Data Table on North America - Market size and forecast 2021-2026 ($ million)
- Exhibit 60: Chart on North America - Year-over-year growth 2021-2026 (%)
- Exhibit 61: Data Table on North America - Year-over-year growth 2021-2026 (%)
- 7.6 South America - Market size and forecast 2021-2026
- Exhibit 62: Chart on South America - Market size and forecast 2021-2026 ($ million)
- Exhibit 63: Data Table on South America - Market size and forecast 2021-2026 ($ million)
- Exhibit 64: Chart on South America - Year-over-year growth 2021-2026 (%)
- Exhibit 65: Data Table on South America - Year-over-year growth 2021-2026 (%)
- 7.7 Middle East and Africa - Market size and forecast 2021-2026
- Exhibit 66: Chart on Middle East and Africa - Market size and forecast 2021-2026 ($ million)
- Exhibit 67: Data Table on Middle East and Africa - Market size and forecast 2021-2026 ($ million)
- Exhibit 68: Chart on Middle East and Africa - Year-over-year growth 2021-2026 (%)
- Exhibit 69: Data Table on Middle East and Africa - Year-over-year growth 2021-2026 (%)
- 7.8 China - Market size and forecast 2021-2026
- Exhibit 70: Chart on China - Market size and forecast 2021-2026 ($ million)
- Exhibit 71: Data Table on China - Market size and forecast 2021-2026 ($ million)
- Exhibit 72: Chart on China - Year-over-year growth 2021-2026 (%)
- Exhibit 73: Data Table on China - Year-over-year growth 2021-2026 (%)
- 7.9 US - Market size and forecast 2021-2026
- Exhibit 74: Chart on US - Market size and forecast 2021-2026 ($ million)
- Exhibit 75: Data Table on US - Market size and forecast 2021-2026 ($ million)
- Exhibit 76: Chart on US - Year-over-year growth 2021-2026 (%)
- Exhibit 77: Data Table on US - Year-over-year growth 2021-2026 (%)
- 7.10 Japan - Market size and forecast 2021-2026
- Exhibit 78: Chart on Japan - Market size and forecast 2021-2026 ($ million)
- Exhibit 79: Data Table on Japan - Market size and forecast 2021-2026 ($ million)
- Exhibit 80: Chart on Japan - Year-over-year growth 2021-2026 (%)
- Exhibit 81: Data Table on Japan - Year-over-year growth 2021-2026 (%)
- 7.11 Germany - Market size and forecast 2021-2026
- Exhibit 82: Chart on Germany - Market size and forecast 2021-2026 ($ million)
- Exhibit 83: Data Table on Germany - Market size and forecast 2021-2026 ($ million)
- Exhibit 84: Chart on Germany - Year-over-year growth 2021-2026 (%)
- Exhibit 85: Data Table on Germany - Year-over-year growth 2021-2026 (%)
- 7.12 India - Market size and forecast 2021-2026
- Exhibit 86: Chart on India - Market size and forecast 2021-2026 ($ million)
- Exhibit 87: Data Table on India - Market size and forecast 2021-2026 ($ million)
- Exhibit 88: Chart on India - Year-over-year growth 2021-2026 (%)
- Exhibit 89: Data Table on India - Year-over-year growth 2021-2026 (%)
- 7.13 Market opportunity by geography
- Exhibit 90: Market opportunity by geography ($ million)
8 Drivers, Challenges, and Trends
- 8.1 Market drivers
- 8.2 Market challenges
- 8.3 Impact of drivers and challenges
- Exhibit 91: Impact of drivers and challenges in 2021 and 2026
- 8.4 Market trends
9 Vendor Landscape
- 9.1 Overview
- 9.2 Vendor landscape
- Exhibit 92: Overview on Criticality of inputs and Factors of differentiation
- 9.3 Landscape disruption
- Exhibit 93: Overview on factors of disruption
- 9.4 Industry risks
- Exhibit 94: Impact of key risks on business
10 Vendor Analysis
- 10.1 Vendors covered
- Exhibit 95: Vendors covered
- 10.2 Market positioning of vendors
- Exhibit 96: Matrix on vendor position and classification
- 10.3 Ameresco Inc.
- Exhibit 97: Ameresco Inc. - Overview
- Exhibit 98: Ameresco Inc. - Business segments
- Exhibit 99: Ameresco Inc. - Key offerings
- Exhibit 100: Ameresco Inc. - Segment focus
- 10.4 Carnegie Clean Energy Ltd
- Exhibit 101: Carnegie Clean Energy Ltd - Overview
- Exhibit 102: Carnegie Clean Energy Ltd - Product / Service
- Exhibit 103: Carnegie Clean Energy Ltd - Key offerings
- 10.5 Enviroearth
- Exhibit 104: Enviroearth - Overview
- Exhibit 105: Enviroearth - Product / Service
- Exhibit 106: Enviroearth - Key offerings
- 10.6 Intech GmbH and Co. KG
- Exhibit 107: Intech GmbH and Co. KG - Overview
- Exhibit 108: Intech GmbH and Co. KG - Product / Service
- Exhibit 109: Intech GmbH and Co. KG - Key offerings
- 10.7 Jakson Group
- Exhibit 110: Jakson Group - Overview
- Exhibit 111: Jakson Group - Product / Service
- Exhibit 112: Jakson Group - Key news
- Exhibit 113: Jakson Group - Key offerings
- 10.8 Kirchner Solar Group GmbH
- Exhibit 114: Kirchner Solar Group GmbH - Overview
- Exhibit 115: Kirchner Solar Group GmbH - Product / Service
- Exhibit 116: Kirchner Solar Group GmbH - Key offerings
- 10.9 MVV Energie AG
- Exhibit 117: MVV Energie AG - Overview
- Exhibit 118: MVV Energie AG - Business segments
- Exhibit 119: MVV Energie AG - Key news
- Exhibit 120: MVV Energie AG - Key offerings
- Exhibit 121: MVV Energie AG - Segment focus
- 10.10 Photon Energy Ltd
- Exhibit 122: Photon Energy Ltd - Overview
- Exhibit 123: Photon Energy Ltd - Product / Service
- Exhibit 124: Photon Energy Ltd - Key offerings
- 10.11 REDAVIA GmbH
- Exhibit 125: REDAVIA GmbH - Overview
- Exhibit 126: REDAVIA GmbH - Product / Service
- Exhibit 127: REDAVIA GmbH - Key offerings
- 10.12 Reliance Industries Ltd.
- Exhibit 128: Reliance Industries Ltd. - Overview
- Exhibit 129: Reliance Industries Ltd. - Business segments
- Exhibit 130: Reliance Industries Ltd. - Key offerings
- Exhibit 131: Reliance Industries Ltd. - Segment focus
11 Appendix
- 11.1 Scope of the report
- 11.2 Inclusions and exclusions checklist
- Exhibit 132: Inclusions checklist
- Exhibit 133: Exclusions checklist
- 11.3 Currency conversion rates for US$
- Exhibit 134: Currency conversion rates for US$
- 11.4 Research methodology
- Exhibit 135: Research methodology
- Exhibit 136: Validation techniques employed for market sizing
- Exhibit 137: Information sources
- 11.5 List of abbreviations
- Exhibit 138: List of abbreviations
Technavio is a leading global technology research and advisory company. Their research and analysis focus on emerging market trends and provides actionable insights to help businesses identify market opportunities and develop effective strategies to optimize their market positions. With over 500 specialized analysts, Technavio's report library consists of more than 17,000 reports and counting, covering 800 technologies, spanning across 50 countries. Their client base consists of enterprises of all sizes, including more than 100 Fortune 500 companies. This growing client base relies on Technavio's comprehensive coverage, extensive research, and actionable market insights to identify opportunities in existing and potential markets and assess their competitive positions within changing market scenarios.
Contact Us:
Technavio Research
Jesse Maida
Media & Marketing Executive
US: +1 844 364 1100
UK: +44 203 893 3200
Email: media@technavio.com
Website: www.technavio.com/


SOURCE Technavio
© 2024 Benzinga.com. Benzinga does not provide investment advice. All rights reserved.
Trade confidently with insights and alerts from analyst ratings, free reports and breaking news that affects the stocks you care about.

