


NEW YORK, Nov. 10, 2022 /PRNewswire/ -- The global slot machine market has been categorized as a part of the global casinos and gaming market within the overall global hotels, restaurants, and leisure market. The parent market, the global casinos and gaming market, covers products and companies engaged in casinos and gambling facilities and operations. The market includes casino hotels, standalone casinos, riverboat casinos, gambling machine manufacturers, bingo halls, Internet gambling services, lottery services, and betting services. Technavio calculates the global hotels, restaurants, and leisure market based on combined revenue generated by the operators of casinos and gaming, resorts, hotels, cruise lines, restaurants, and leisure facilities. Growth of the global casinos and gaming market is driven by factors such as innovations and technological advances in casino gaming, rise in disposable income, and internet penetration and adoption of smartphones.

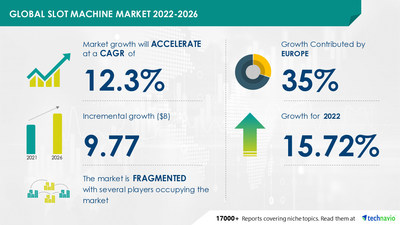
The slot machine market size is expected to grow by USD 9.77 billion. In addition, the growth momentum of the market will accelerate at a CAGR of 12.3% during the forecast period. The report offers an up-to-date analysis of the latest drivers and trends, the current market scenario, and the overall market environment. Request Latest FREE Sample Report
The slot machine market report covers the following areas:
The growing vendor involvement in the market has been instrumental in driving the growth of the market. However, the rising number of fraud cases might hamper the market growth during the forecast period.
Subscribe to our "Basic Plan" billed annually at USD 5000 that enables you to download 5 reports and view 100 reports every month
Accel Entertainment Gaming LLC, AMATIC Industries GmbH, APEX pro gaming AS, APOLLO SOFT s.r.o., Aristocrat Leisure Ltd., Aruze Gaming America Inc., ASTRO corp., Eclipse Gaming Systems LLC, Everi Holdings Inc., Incredible Technologies Inc., Inspired Entertainment Inc., Interblock dd, International Game Technology plc, JPM Interactive Ltd., Konami Group Corp., NOVOMATIC AG, PlayAGS Inc., Recreativos Franco SA, Scientific Games Corp., and Universal Entertainment Corp. are among some of the major market participants.
This report provides a full list of key vendors, their strategies, and the latest developments. Request a FREE PDF Sample Now
- Product
- Digital
- Mechanical
- Geography
- Europe
- North America
- APAC
- South America
- Middle East and Africa
Learn about the contribution of each segment summarized in concise infographics and thorough descriptions. Buy Now for detailed segment information
- CAGR of the market during the forecast period 2022-2026
- Detailed information on factors that will assist slot machine market growth during the next five years
- Estimation of the slot machine market size and its contribution to the parent market
- Predictions on upcoming trends and changes in consumer behavior
- The growth of the slot machine market
- Analysis of the market's competitive landscape and detailed information on vendors
- Comprehensive details of factors that will challenge the growth of slot machine market vendors
Lottery Market in North America by Platform, Type, and Geography - Forecast and Analysis 2022-2026: New launches are driving the lottery market growth in North America. Vendors are focusing on organic growth strategies, such as the launch of new lottery game tickets and platforms. They are introducing new games and tickets to encourage participation.
Electronic Table Games (ETG) Market by End-user and Geography - Forecast and Analysis 2022-2026: Increasing per capita income is driving the electronic table games market's growth. The rising disposable income of the population is driving the demand for ETG. The rising disposable income of people has led to increased spending capacity.
Slot Machine Market Scope | |
Report Coverage | Details |
Page number | 120 |
Base year | 2021 |
Forecast period | 2022-2026 |
Growth momentum & CAGR | Accelerate at a CAGR of 12.3% |
Market growth 2022-2026 | USD 9.77 billion |
Market structure | Fragmented |
YoY growth (%) | 15.72 |
Regional analysis | Europe, North America, APAC, South America, and Middle East and Africa |
Performing market contribution | Europe at 35% |
Key consumer countries | US, China, UK, Italy, and France |
Competitive landscape | Leading companies, competitive strategies, consumer engagement scope |
Companies profiled | Accel Entertainment Gaming LLC, AMATIC Industries GmbH, APEX pro gaming AS, APOLLO SOFT s.r.o., Aristocrat Leisure Ltd., Aruze Gaming America Inc., ASTRO corp., Eclipse Gaming Systems LLC, Everi Holdings Inc., Incredible Technologies Inc., Inspired Entertainment Inc., Interblock dd, International Game Technology plc, JPM Interactive Ltd., Konami Group Corp., NOVOMATIC AG, PlayAGS Inc., Recreativos Franco SA, Scientific Games Corp., and Universal Entertainment Corp. |
Market Dynamics | Parent market analysis, Market growth inducers and obstacles, Fast-growing and slow-growing segment analysis, COVID-19 impact and future consumer dynamics, and market condition analysis for the forecast period. |
Customization purview | If our report has not included the data that you are looking for, you can reach out to our analysts and get segments customized. |
Browse Consumer Discretionary Market Reports
1 Executive Summary
- 1.1 Market overview
- Exhibit 01: Executive Summary – Chart on Market Overview
- Exhibit 02: Executive Summary – Data Table on Market Overview
- Exhibit 03: Executive Summary – Chart on Global Market Characteristics
- Exhibit 04: Executive Summary – Chart on Market by Geography
- Exhibit 05: Executive Summary – Chart on Market Segmentation by Product
- Exhibit 06: Executive Summary – Chart on Incremental Growth
- Exhibit 07: Executive Summary – Data Table on Incremental Growth
- Exhibit 08: Executive Summary – Chart on Vendor Market Positioning
2 Market Landscape
- 2.1 Market ecosystem
- Exhibit 09: Parent market
- Exhibit 10: Market Characteristics
3 Market Sizing
- 3.1 Market definition
- Exhibit 11: Offerings of vendors included in the market definition
- 3.2 Market segment analysis
- Exhibit 12: Market segments
- 3.3 Market size 2021
- 3.4 Market outlook: Forecast for 2021-2026
- Exhibit 13: Chart on Global - Market size and forecast 2021-2026 ($ million)
- Exhibit 14: Data Table on Global - Market size and forecast 2021-2026 ($ million)
- Exhibit 15: Chart on Global Market: Year-over-year growth 2021-2026 (%)
- Exhibit 16: Data Table on Global Market: Year-over-year growth 2021-2026 (%)
4 Five Forces Analysis
- 4.1 Five forces summary
- Exhibit 17: Five forces analysis - Comparison between 2021 and 2026
- 4.2 Bargaining power of buyers
- Exhibit 18: Chart on Bargaining power of buyers – Impact of key factors 2021 and 2026
- 4.3 Bargaining power of suppliers
- Exhibit 19: Bargaining power of suppliers – Impact of key factors in 2021 and 2026
- 4.4 Threat of new entrants
- Exhibit 20: Threat of new entrants – Impact of key factors in 2021 and 2026
- 4.5 Threat of substitutes
- Exhibit 21: Threat of substitutes – Impact of key factors in 2021 and 2026
- 4.6 Threat of rivalry
- Exhibit 22: Threat of rivalry – Impact of key factors in 2021 and 2026
- 4.7 Market condition
- Exhibit 23: Chart on Market condition - Five forces 2021 and 2026
5 Market Segmentation by Product
- 5.1 Market segments
- Exhibit 24: Chart on Product - Market share 2021-2026 (%)
- Exhibit 25: Data Table on Product - Market share 2021-2026 (%)
- 5.2 Comparison by Product
- Exhibit 26: Chart on Comparison by Product
- Exhibit 27: Data Table on Comparison by Product
- 5.3 Digital - Market size and forecast 2021-2026
- Exhibit 28: Chart on Digital - Market size and forecast 2021-2026 ($ million)
- Exhibit 29: Data Table on Digital - Market size and forecast 2021-2026 ($ million)
- Exhibit 30: Chart on Digital - Year-over-year growth 2021-2026 (%)
- Exhibit 31: Data Table on Digital - Year-over-year growth 2021-2026 (%)
- 5.4 Mechanical - Market size and forecast 2021-2026
- Exhibit 32: Chart on Mechanical - Market size and forecast 2021-2026 ($ million)
- Exhibit 33: Data Table on Mechanical - Market size and forecast 2021-2026 ($ million)
- Exhibit 34: Chart on Mechanical - Year-over-year growth 2021-2026 (%)
- Exhibit 35: Data Table on Mechanical - Year-over-year growth 2021-2026 (%)
- 5.5 Market opportunity by Product
- Exhibit 36: Market opportunity by Product ($ million)
6 Customer Landscape
- 6.1 Customer landscape overview
- Exhibit 37: Analysis of price sensitivity, lifecycle, customer purchase basket, adoption rates, and purchase criteria
7 Geographic Landscape
- 7.1 Geographic segmentation
- Exhibit 38: Chart on Market share by geography 2021-2026 (%)
- Exhibit 39: Data Table on Market share by geography 2021-2026 (%)
- 7.2 Geographic comparison
- Exhibit 40: Chart on Geographic comparison
- Exhibit 41: Data Table on Geographic comparison
- 7.3 Europe - Market size and forecast 2021-2026
- Exhibit 42: Chart on Europe - Market size and forecast 2021-2026 ($ million)
- Exhibit 43: Data Table on Europe - Market size and forecast 2021-2026 ($ million)
- Exhibit 44: Chart on Europe - Year-over-year growth 2021-2026 (%)
- Exhibit 45: Data Table on Europe - Year-over-year growth 2021-2026 (%)
- 7.4 North America - Market size and forecast 2021-2026
- Exhibit 46: Chart on North America - Market size and forecast 2021-2026 ($ million)
- Exhibit 47: Data Table on North America - Market size and forecast 2021-2026 ($ million)
- Exhibit 48: Chart on North America - Year-over-year growth 2021-2026 (%)
- Exhibit 49: Data Table on North America - Year-over-year growth 2021-2026 (%)
- 7.5 APAC - Market size and forecast 2021-2026
- Exhibit 50: Chart on APAC - Market size and forecast 2021-2026 ($ million)
- Exhibit 51: Data Table on APAC - Market size and forecast 2021-2026 ($ million)
- Exhibit 52: Chart on APAC - Year-over-year growth 2021-2026 (%)
- Exhibit 53: Data Table on APAC - Year-over-year growth 2021-2026 (%)
- 7.6 South America - Market size and forecast 2021-2026
- Exhibit 54: Chart on South America - Market size and forecast 2021-2026 ($ million)
- Exhibit 55: Data Table on South America - Market size and forecast 2021-2026 ($ million)
- Exhibit 56: Chart on South America - Year-over-year growth 2021-2026 (%)
- Exhibit 57: Data Table on South America - Year-over-year growth 2021-2026 (%)
- 7.7 Middle East and Africa - Market size and forecast 2021-2026
- Exhibit 58: Chart on Middle East and Africa - Market size and forecast 2021-2026 ($ million)
- Exhibit 59: Data Table on Middle East and Africa - Market size and forecast 2021-2026 ($ million)
- Exhibit 60: Chart on Middle East and Africa - Year-over-year growth 2021-2026 (%)
- Exhibit 61: Data Table on Middle East and Africa - Year-over-year growth 2021-2026 (%)
- 7.8 US - Market size and forecast 2021-2026
- Exhibit 62: Chart on US - Market size and forecast 2021-2026 ($ million)
- Exhibit 63: Data Table on US - Market size and forecast 2021-2026 ($ million)
- Exhibit 64: Chart on US - Year-over-year growth 2021-2026 (%)
- Exhibit 65: Data Table on US - Year-over-year growth 2021-2026 (%)
- 7.9 China - Market size and forecast 2021-2026
- Exhibit 66: Chart on China - Market size and forecast 2021-2026 ($ million)
- Exhibit 67: Data Table on China - Market size and forecast 2021-2026 ($ million)
- Exhibit 68: Chart on China - Year-over-year growth 2021-2026 (%)
- Exhibit 69: Data Table on China - Year-over-year growth 2021-2026 (%)
- 7.10 UK - Market size and forecast 2021-2026
- Exhibit 70: Chart on UK - Market size and forecast 2021-2026 ($ million)
- Exhibit 71: Data Table on UK - Market size and forecast 2021-2026 ($ million)
- Exhibit 72: Chart on UK - Year-over-year growth 2021-2026 (%)
- Exhibit 73: Data Table on UK - Year-over-year growth 2021-2026 (%)
- 7.11 Italy - Market size and forecast 2021-2026
- Exhibit 74: Chart on Italy - Market size and forecast 2021-2026 ($ million)
- Exhibit 75: Data Table on Italy - Market size and forecast 2021-2026 ($ million)
- Exhibit 76: Chart on Italy - Year-over-year growth 2021-2026 (%)
- Exhibit 77: Data Table on Italy - Year-over-year growth 2021-2026 (%)
- 7.12 France - Market size and forecast 2021-2026
- Exhibit 78: Chart on France - Market size and forecast 2021-2026 ($ million)
- Exhibit 79: Data Table on France - Market size and forecast 2021-2026 ($ million)
- Exhibit 80: Chart on France - Year-over-year growth 2021-2026 (%)
- Exhibit 81: Data Table on France - Year-over-year growth 2021-2026 (%)
- 7.13 Market opportunity by geography
- Exhibit 82: Market opportunity by geography ($ million)
8 Drivers, Challenges, and Trends
- 8.1 Market drivers
- 8.2 Market challenges
- 8.3 Impact of drivers and challenges
- Exhibit 83: Impact of drivers and challenges in 2021 and 2026
- 8.4 Market trends
9 Vendor Landscape
- 9.1 Overview
- 9.2 Vendor landscape
- Exhibit 84: Overview on Criticality of inputs and Factors of differentiation
- 9.3 Landscape disruption
- Exhibit 85: Overview on factors of disruption
- 9.4 Industry risks
- Exhibit 86: Impact of key risks on business
10 Vendor Analysis
- 10.1 Vendors covered
- Exhibit 87: Vendors covered
- 10.2 Market positioning of vendors
- Exhibit 88: Matrix on vendor position and classification
- 10.3 AMATIC Industries GmbH
- Exhibit 89: AMATIC Industries GmbH - Overview
- Exhibit 90: AMATIC Industries GmbH - Product / Service
- Exhibit 91: AMATIC Industries GmbH - Key offerings
- 10.4 APEX pro gaming AS
- Exhibit 92: APEX pro gaming AS - Overview
- Exhibit 93: APEX pro gaming AS - Product / Service
- Exhibit 94: APEX pro gaming AS - Key offerings
- 10.5 APOLLO SOFT s.r.o.
- Exhibit 95: APOLLO SOFT s.r.o. - Overview
- Exhibit 96: APOLLO SOFT s.r.o. - Product / Service
- Exhibit 97: APOLLO SOFT s.r.o. - Key offerings
- 10.6 Aristocrat Leisure Ltd.
- Exhibit 98: Aristocrat Leisure Ltd. - Overview
- Exhibit 99: Aristocrat Leisure Ltd. - Business segments
- Exhibit 100: Aristocrat Leisure Ltd. - Key offerings
- Exhibit 101: Aristocrat Leisure Ltd. - Segment focus
- 10.7 Eclipse Gaming Systems LLC
- Exhibit 102: Eclipse Gaming Systems LLC - Overview
- Exhibit 103: Eclipse Gaming Systems LLC - Product / Service
- Exhibit 104: Eclipse Gaming Systems LLC - Key offerings
- 10.8 International Game Technology plc
- Exhibit 105: International Game Technology plc - Overview
- Exhibit 106: International Game Technology plc - Business segments
- Exhibit 107: International Game Technology plc - Key offerings
- Exhibit 108: International Game Technology plc - Segment focus
- 10.9 Konami Group Corp.
- Exhibit 109: Konami Group Corp. - Overview
- Exhibit 110: Konami Group Corp. - Business segments
- Exhibit 111: Konami Group Corp. - Key offerings
- Exhibit 112: Konami Group Corp. - Segment focus
- 10.10 NOVOMATIC AG
- Exhibit 113: NOVOMATIC AG - Overview
- Exhibit 114: NOVOMATIC AG - Business segments
- Exhibit 115: NOVOMATIC AG - Key offerings
- Exhibit 116: NOVOMATIC AG - Segment focus
- 10.11 Scientific Games Corp.
- Exhibit 117: Scientific Games Corp. - Overview
- Exhibit 118: Scientific Games Corp. - Business segments
- Exhibit 119: Scientific Games Corp. - Key offerings
- Exhibit 120: Scientific Games Corp. - Segment focus
- 10.12 Universal Entertainment Corp.
- Exhibit 121: Universal Entertainment Corp. - Overview
- Exhibit 122: Universal Entertainment Corp. - Business segments
- Exhibit 123: Universal Entertainment Corp. - Key offerings
- Exhibit 124: Universal Entertainment Corp. - Segment focus
11 Appendix
- 11.1 Scope of the report
- 11.2 Inclusions and exclusions checklist
- Exhibit 125: Inclusions checklist
- Exhibit 126: Exclusions checklist
- 11.3 Currency conversion rates for US$
- Exhibit 127: Currency conversion rates for US$
- 11.4 Research methodology
- Exhibit 128: Research methodology
- Exhibit 129: Validation techniques employed for market sizing
- Exhibit 130: Information sources
- 11.5 List of abbreviations
- Exhibit 131: List of abbreviations
Technavio is a leading global technology research and advisory company. Their research and analysis focus on emerging market trends and provide actionable insights to help businesses identify market opportunities and develop effective strategies to optimize their market positions. With over 500 specialized analysts, Technavio's report library consists of more than 17,000 reports and counting, covering 800 technologies, spanning across 50 countries. Their client base consists of enterprises of all sizes, including more than 100 Fortune 500 companies. This growing client base relies on Technavio's comprehensive coverage, extensive research, and actionable market insights to identify opportunities in existing and potential markets and assess their competitive positions within changing market scenarios.
Technavio Research
Jesse Maida
Media & Marketing Executive
US: +1 844 364 1100
UK: +44 203 893 3200
Email: media@technavio.com
Website: www.technavio.com/


SOURCE Technavio
© 2024 Benzinga.com. Benzinga does not provide investment advice. All rights reserved.
Trade confidently with insights and alerts from analyst ratings, free reports and breaking news that affects the stocks you care about.

