


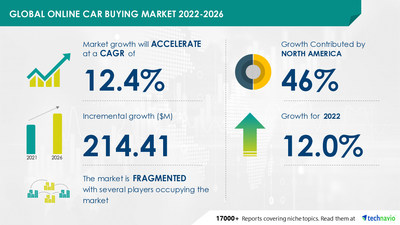
NEW YORK, Nov. 8, 2022 /PRNewswire/ -- The Online Car Buying Market is estimated to grow by USD 214.41 million during 2021-2026. The market will accelerate at a CAGR of 12.4% with Y-O-Y growth of 12.0%. The report extensively covers the online car buying market segmentations by Class Type (pre-owned and new vehicle) and Geography (North America, Europe, APAC, South America, and Middle East and Africa). Request Free Sample Report.

Online Car Buying Market: Regional Analysis
North America will contribute 46% of market growth. The market for online automobile sales in North America will expand as disposable income and consumer technological literacy rise. The US, Canada, and Mexico are major contributors to the North American online auto sales market. Many North American OEMs are experimenting with online sales to give their customers a better online experience, including enhanced price transparency, the convenience of ordering from home, and a digital payment mechanism.
Along with these factors, the regional online car buying market is anticipated to grow over the course of the forecast period due to the rising demand for personal vehicles, the increase in internet users, and the digitalization of the automotive retail sector. Download Free Sample Report.
Online Car Buying Market: Parent Market Analysis
Technavio categorizes the global online car buying market as a part of the global automotive market under the global automobiles and components industry. The parent market, the global automotive market, covers companies engaged in the production of vehicles such as passenger cars, commercial vehicles, and all-terrain vehicles. It does not include manufacturers of motorcycles, scooters, e-bikes, trikes, and three-wheelers.
Technavio calculates the global automotive market size based on the combined revenue generated by the manufacturers of automobiles such as passenger cars, commercial vehicles, and all-terrain vehicles.
The growth of the global automotive market will be driven by the following factors:
- Idealizing concepts and inclusion of advanced features in vehicles
- An increasing number of mergers and acquisitions (M&A) and joint ventures (JVs)
- Integrating 3D printing to speed up automobile production
- Increasing demand for electric vehicles
- Growing investment in autonomous vehicles
To unlock information about vendor drive costs and customer service, Buy Sample Report.
Online Car Buying Market: Vendor Analysis
The global online car buying market is highly fragmented due to the presence of numerous established global and regional players. Vendors compete based on price, fleet size, car model, and marketing expertise. Vendors are implementing strategies such as online review management, creating a user-friendly web experience, and using social media to increase their customer base. With the increasing adoption of these strategies, the competition in the market will increase.
The report analyzes the market's competitive landscape and offers information on several market vendors, including:
- American City Business Journals Inc.
- Asbury Automotive Group Inc.
- AutoNation Inc.
- CarGurus Inc.
- CarMax Inc.
- Cars and Bids LLC
- Cars.com Inc.
- Cars24 Services Pvt. Ltd.
- CarSoup of Minnesota Inc.
- Carvago
- Carvana Co.
- Cox Enterprises Inc.
Find additional highlights on the growth strategies adopted by vendors and their product offerings, Read Free Sample Report.
Online Car Buying Market: Driver
The worldwide online automobile buying market's expansion is largely driven by the rising use of e-commerce and technological developments in online channels. Technological developments like the creation of smartphones and the expansion of the Internet are encouraging the use of e-commerce applications to increase business sales, while the introduction of hybrid and electric vehicles has altered the position of buyers in the global online car-buying market. However, the biggest obstacles to expanding the worldwide online auto purchase business are low customer awareness and acceptability in semi-urban and rural locations.
Get lifetime access to our Technavio Insights! Subscribe to our "Basic Plan" billed annually at USD 5000.
Related Reports:
Car Wax Market by Type and Geography - Forecast and Analysis 2022-2026: The proliferation of vehicles due to the increase in their lifespan is notably driving the car wax market growth, although factors such as the increasing use of ceramic coating as a paint protection substitute may impede the market growth.
Car Rental Market by Type, Mode of Booking, Rental Category, and Geography - Forecast and Analysis 2022-2026: The growth in the travel and tourism industry is notably driving the car rental market growth, although factors such as the rise in the number of car-sharing services may impede the market growth.
Online Car Buying Market Scope | |
Report Coverage | Details |
Page number | 120 |
Base year | 2021 |
Forecast period | 2022-2026 |
Growth momentum & CAGR | Accelerate at a CAGR of 12.4% |
Market growth 2022-2026 | $214.41 million |
Market structure | Fragmented |
YoY growth (%) | 12.0 |
Regional analysis | North America, Europe, APAC, South America, and Middle East and Africa |
Performing market contribution | North America at 46% |
Key consumer countries | US, Canada, China, Japan, UK, and Germany |
Competitive landscape | Leading companies, competitive strategies, consumer engagement scope |
Companies profiled | American City Business Journals Inc., Asbury Automotive Group Inc., AutoNation Inc., CarGurus Inc., CarMax Inc., Cars and Bids LLC, Cars.com Inc., Cars24 Services Pvt. Ltd., CarSoup of Minnesota Inc., Carvago, Carvana Co., Cox Enterprises Inc., eBay Inc., Edmunds.com Inc., Hendrick Automotive Group, Lithia Motors Inc., MH Sub I LLC, Miami Lakes Automall, and TrueCar Inc. |
Market Dynamics | Parent market analysis, Market growth inducers and obstacles, Fast-growing and slow-growing segment analysis, COVID-19 impact and future consumer dynamics, and market condition analysis for the forecast period. |
Customization purview | If our report has not included the data that you are looking for, you can reach out to our analysts and get segments customized. |
Table of Contents
1 Executive Summary
- 1.1 Market Overview
- Exhibit 01: Executive Summary – Chart on Market Overview
- Exhibit 02: Executive Summary – Data Table on Market Overview
- Exhibit 03: Executive Summary – Chart on Global Market Characteristics
- Exhibit 04: Executive Summary – Chart on Market by Geography
- Exhibit 05: Executive Summary – Chart on Market Segmentation by Class Type
- Exhibit 06: Executive Summary – Chart on Incremental Growth
- Exhibit 07: Executive Summary – Data Table on Incremental Growth
- Exhibit 08: Executive Summary – Chart on Vendor Market Positioning
2 Market Landscape
- 2.1 Market ecosystem
- Exhibit 09: Parent market
- Exhibit 10: Market Characteristics
3 Market Sizing
- 3.1 Market definition
- Exhibit 11: Offerings of vendors included in the market definition
- 3.2 Market segment analysis
- Exhibit 12: Market segments
- 3.3 Market size 2021
- 3.4 Market outlook: Forecast for 2021-2026
- Exhibit 13: Chart on Global - Market size and forecast 2021-2026 ($ million)
- Exhibit 14: Data Table on Global - Market size and forecast 2021-2026 ($ million)
- Exhibit 15: Chart on Global Market: Year-over-year growth 2021-2026 (%)
- Exhibit 16: Data Table on Global Market: Year-over-year growth 2021-2026 (%)
4 Five Forces Analysis
- 4.1 Five forces summary
- Exhibit 17: Five forces analysis - Comparison between 2021 and 2026
- 4.2 Bargaining power of buyers
- Exhibit 18: Chart on Bargaining power of buyers – Impact of key factors 2021 and 2026
- 4.3 Bargaining power of suppliers
- Exhibit 19: Bargaining power of suppliers – Impact of key factors in 2021 and 2026
- 4.4 Threat of new entrants
- Exhibit 20: Threat of new entrants – Impact of key factors in 2021 and 2026
- 4.5 Threat of substitutes
- Exhibit 21: Threat of substitutes – Impact of key factors in 2021 and 2026
- 4.6 Threat of rivalry
- Exhibit 22: Threat of rivalry – Impact of key factors in 2021 and 2026
- 4.7 Market condition
- Exhibit 23: Chart on Market condition - Five forces 2021 and 2026
5 Market Segmentation by Class Type
- 5.1 Market segments
- Exhibit 24: Chart on Class Type - Market share 2021-2026 (%)
- Exhibit 25: Data Table on Class Type - Market share 2021-2026 (%)
- 5.2 Comparison by Class Type
- Exhibit 26: Chart on Comparison by Class Type
- Exhibit 27: Data Table on Comparison by Class Type
- 5.3 Pre-owned - Market size and forecast 2021-2026
- Exhibit 28: Chart on Pre-owned - Market size and forecast 2021-2026 ($ million)
- Exhibit 29: Data Table on Pre-owned - Market size and forecast 2021-2026 ($ million)
- Exhibit 30: Chart on Pre-owned - Year-over-year growth 2021-2026 (%)
- Exhibit 31: Data Table on Pre-owned - Year-over-year growth 2021-2026 (%)
- 5.4 New vehicle - Market size and forecast 2021-2026
- Exhibit 32: Chart on New vehicle - Market size and forecast 2021-2026 ($ million)
- Exhibit 33: Data Table on New vehicle - Market size and forecast 2021-2026 ($ million)
- Exhibit 34: Chart on New vehicle - Year-over-year growth 2021-2026 (%)
- Exhibit 35: Data Table on New vehicle - Year-over-year growth 2021-2026 (%)
- 5.5 Market opportunity by Class Type
- Exhibit 36: Market opportunity by Class Type ($ million)
6 Customer Landscape
- 6.1 Customer landscape overview
- Exhibit 37: Analysis of price sensitivity, lifecycle, customer purchase basket, adoption rates, and purchase criteria
7 Geographic Landscape
- 7.1 Geographic segmentation
- Exhibit 38: Chart on Market share by geography 2021-2026 (%)
- Exhibit 39: Data Table on Market share by geography 2021-2026 (%)
- 7.2 Geographic comparison
- Exhibit 40: Chart on Geographic comparison
- Exhibit 41: Data Table on Geographic comparison
- 7.3 North America - Market size and forecast 2021-2026
- Exhibit 42: Chart on North America - Market size and forecast 2021-2026 ($ million)
- Exhibit 43: Data Table on North America - Market size and forecast 2021-2026 ($ million)
- Exhibit 44: Chart on North America - Year-over-year growth 2021-2026 (%)
- Exhibit 45: Data Table on North America - Year-over-year growth 2021-2026 (%)
- 7.4 Europe - Market size and forecast 2021-2026
- Exhibit 46: Chart on Europe - Market size and forecast 2021-2026 ($ million)
- Exhibit 47: Data Table on Europe - Market size and forecast 2021-2026 ($ million)
- Exhibit 48: Chart on Europe - Year-over-year growth 2021-2026 (%)
- Exhibit 49: Data Table on Europe - Year-over-year growth 2021-2026 (%)
- 7.5 APAC - Market size and forecast 2021-2026
- Exhibit 50: Chart on APAC - Market size and forecast 2021-2026 ($ million)
- Exhibit 51: Data Table on APAC - Market size and forecast 2021-2026 ($ million)
- Exhibit 52: Chart on APAC - Year-over-year growth 2021-2026 (%)
- Exhibit 53: Data Table on APAC - Year-over-year growth 2021-2026 (%)
- 7.6 South America - Market size and forecast 2021-2026
- Exhibit 54: Chart on South America - Market size and forecast 2021-2026 ($ million)
- Exhibit 55: Data Table on South America - Market size and forecast 2021-2026 ($ million)
- Exhibit 56: Chart on South America - Year-over-year growth 2021-2026 (%)
- Exhibit 57: Data Table on South America - Year-over-year growth 2021-2026 (%)
- 7.7 Middle East and Africa - Market size and forecast 2021-2026
- Exhibit 58: Chart on Middle East and Africa - Market size and forecast 2021-2026 ($ million)
- Exhibit 59: Data Table on Middle East and Africa - Market size and forecast 2021-2026 ($ million)
- Exhibit 60: Chart on Middle East and Africa - Year-over-year growth 2021-2026 (%)
- Exhibit 61: Data Table on Middle East and Africa - Year-over-year growth 2021-2026 (%)
- 7.8 US - Market size and forecast 2021-2026
- Exhibit 62: Chart on US - Market size and forecast 2021-2026 ($ million)
- Exhibit 63: Data Table on US - Market size and forecast 2021-2026 ($ million)
- Exhibit 64: Chart on US - Year-over-year growth 2021-2026 (%)
- Exhibit 65: Data Table on US - Year-over-year growth 2021-2026 (%)
- 7.9 Canada - Market size and forecast 2021-2026
- Exhibit 66: Chart on Canada - Market size and forecast 2021-2026 ($ million)
- Exhibit 67: Data Table on Canada - Market size and forecast 2021-2026 ($ million)
- Exhibit 68: Chart on Canada - Year-over-year growth 2021-2026 (%)
- Exhibit 69: Data Table on Canada - Year-over-year growth 2021-2026 (%)
- 7.10 China - Market size and forecast 2021-2026
- Exhibit 70: Chart on China - Market size and forecast 2021-2026 ($ million)
- Exhibit 71: Data Table on China - Market size and forecast 2021-2026 ($ million)
- Exhibit 72: Chart on China - Year-over-year growth 2021-2026 (%)
- Exhibit 73: Data Table on China - Year-over-year growth 2021-2026 (%)
- 7.11 UK - Market size and forecast 2021-2026
- Exhibit 74: Chart on UK - Market size and forecast 2021-2026 ($ million)
- Exhibit 75: Data Table on UK - Market size and forecast 2021-2026 ($ million)
- Exhibit 76: Chart on UK - Year-over-year growth 2021-2026 (%)
- Exhibit 77: Data Table on UK - Year-over-year growth 2021-2026 (%)
- 7.12 Germany - Market size and forecast 2021-2026
- Exhibit 78: Chart on Germany - Market size and forecast 2021-2026 ($ million)
- Exhibit 79: Data Table on Germany - Market size and forecast 2021-2026 ($ million)
- Exhibit 80: Chart on Germany - Year-over-year growth 2021-2026 (%)
- Exhibit 81: Data Table on Germany - Year-over-year growth 2021-2026 (%)
- 7.13 Japan - Market size and forecast 2021-2026
- Exhibit 82: Chart on Japan - Market size and forecast 2021-2026 ($ million)
- Exhibit 83: Data Table on Japan - Market size and forecast 2021-2026 ($ million)
- Exhibit 84: Chart on Japan - Year-over-year growth 2021-2026 (%)
- Exhibit 85: Data Table on Japan - Year-over-year growth 2021-2026 (%)
- 7.14 Market opportunity by geography
- Exhibit 86: Market opportunity by geography ($ million)
8 Drivers, Challenges, and Trends
- 8.1 Market drivers
- 8.2 Market challenges
- 8.3 Impact of drivers and challenges
- Exhibit 87: Impact of drivers and challenges in 2021 and 2026
- 8.4 Market trends
9 Vendor Landscape
- 9.1 Overview
- 9.2 Vendor landscape
- Exhibit 88: Overview on Criticality of inputs and Factors of differentiation
- 9.3 Landscape disruption
- Exhibit 89: Overview on factors of disruption
- 9.4 Industry risks
- Exhibit 90: Impact of key risks on business
10 Vendor Analysis
- 10.1 Vendors covered
- Exhibit 91: Vendors covered
- 10.2 Market positioning of vendors
- Exhibit 92: Matrix on vendor position and classification
- 10.3 Asbury Automotive Group Inc.
- Exhibit 93: Asbury Automotive Group Inc. - Overview
- Exhibit 94: Asbury Automotive Group Inc. - Business segments
- Exhibit 95: Asbury Automotive Group Inc. - Key offerings
- Exhibit 96: Asbury Automotive Group Inc. - Segment focus
- 10.4 AutoNation Inc.
- Exhibit 97: AutoNation Inc. - Overview
- Exhibit 98: AutoNation Inc. - Business segments
- Exhibit 99: AutoNation Inc. - Key offerings
- Exhibit 100: AutoNation Inc. - Segment focus
- 10.5 CarGurus Inc.
- Exhibit 101: CarGurus Inc. - Overview
- Exhibit 102: CarGurus Inc. - Business segments
- Exhibit 103: CarGurus Inc. - Key offerings
- Exhibit 104: CarGurus Inc. - Segment focus
- 10.6 Cars.com Inc.
- Exhibit 105: Cars.com Inc. - Overview
- Exhibit 106: Cars.com Inc. - Product / Service
- Exhibit 107: Cars.com Inc. - Key offerings
- 10.7 Carvago
- Exhibit 108: Carvago - Overview
- Exhibit 109: Carvago - Product / Service
- Exhibit 110: Carvago - Key offerings
- 10.8 Cox Enterprises Inc.
- Exhibit 111: Cox Enterprises Inc. - Overview
- Exhibit 112: Cox Enterprises Inc. - Product / Service
- Exhibit 113: Cox Enterprises Inc. - Key offerings
- 10.9 Hendrick Automotive Group
- Exhibit 114: Hendrick Automotive Group - Overview
- Exhibit 115: Hendrick Automotive Group - Product / Service
- Exhibit 116: Hendrick Automotive Group - Key offerings
- 10.10 Lithia Motors Inc.
- Exhibit 117: Lithia Motors Inc. - Overview
- Exhibit 118: Lithia Motors Inc. - Business segments
- Exhibit 119: Lithia Motors Inc. - Key offerings
- Exhibit 120: Lithia Motors Inc. - Segment focus
- 10.11 MH Sub I LLC
- Exhibit 121: MH Sub I LLC - Overview
- Exhibit 122: MH Sub I LLC - Product / Service
- Exhibit 123: MH Sub I LLC - Key offerings
- 10.12 TrueCar Inc.
- Exhibit 124: TrueCar Inc. - Overview
- Exhibit 125: TrueCar Inc. - Business segments
- Exhibit 126: TrueCar Inc. - Key news
- Exhibit 127: TrueCar Inc. - Key offerings
- Exhibit 128: TrueCar Inc. - Segment focus
11 Appendix
- 11.1 Scope of the report
- 11.2 Inclusions and exclusions checklist
- Exhibit 129: Inclusions checklist
- Exhibit 130: Exclusions checklist
- 11.3 Currency conversion rates for US$
- Exhibit 131: Currency conversion rates for US$
- 11.4 Research methodology
- Exhibit 132: Research methodology
- Exhibit 133: Validation techniques employed for market sizing
- Exhibit 134: Information sources
- 11.5 List of abbreviations
- Exhibit 135: List of abbreviations
About Us
Technavio is a leading global technology research and advisory company. Their research and analysis focus on emerging market trends and provides actionable insights to help businesses identify market opportunities and develop effective strategies to optimize their market positions. With over 500 specialized analysts, Technavio's report library consists of more than 17,000 reports and counting, covering 800 technologies, spanning across 50 countries. Their client base consists of enterprises of all sizes, including more than 100 Fortune 500 companies. This growing client base relies on Technavio's comprehensive coverage, extensive research, and actionable market insights to identify opportunities in existing and potential markets and assess their competitive positions within changing market scenarios.
Contact
Technavio Research
Jesse Maida
Media & Marketing Executive
US: +1 844 364 1100
UK: +44 203 893 3200
Email: media@technavio.com
Website: www.technavio.com/


SOURCE Technavio
© 2024 Benzinga.com. Benzinga does not provide investment advice. All rights reserved.
Trade confidently with insights and alerts from analyst ratings, free reports and breaking news that affects the stocks you care about.

