


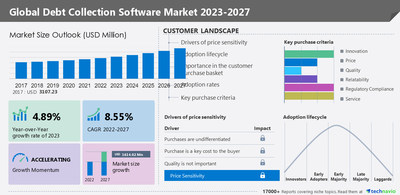
NEW YORK, Nov. 3, 2022 /PRNewswire/ -- The Global Collection Software Market share is set to increase by USD 1614.02 million from 2022 to 2027. Moreover, the market's growth momentum will accelerate at a CAGR of 8.55% as per the latest market forecast report by Technavio. The market will also record a 4.89% Y-O-Y growth rate during the forecast period.

To know more about the historic market size– Request a Free Sample Report!
Global Debt Collection Software Market - Parent Market Analysis
Technavio categorizes the global debt collection software market as a part of the global application software market within the global IT software market. The global application software market covers companies that are engaged in developing and producing software designed for specialized applications for the business or consumer market. It includes enterprise and technical software, as well as cloud-based software.
For more information parent market along with value chain analysis – Grab an Exclusive sample!
Global Debt Collection Software Market Characteristics with Five Forces–
The Global Debt Collection Software Market is fragmented, and the five forces analysis by Technavio gives an accurate vision –
- Bargaining Power of Buyers
- The threat of New Entrants
- Threat of Rivalry
- Bargaining Power of Suppliers
- For information on the impact of the five forces analysis– Click Now!
Global Debt Collection Software Market – Customer Landscape
- The disruption threats are strategic in nature, and operational risks for suppliers have been mapped based on their negative business impact and probability of occurrence.
- The potential for the customer landscape will be available with Technavio Reports – Buy Now!
Global Debt Collection Software Market - Segmentation Assessment
Geography Segment Overview
Technavio's market research report entails detailed information on regional opportunities in store for vendors, which will assist in generating sales revenues. The Global Debt Collection Software Market as per geography is categorized into North America, Europe, APAC, South America, and the Middle East and Africa. The report provides an accurate prediction of the contribution of all regions to the growth of the Global Debt Collection Software Market size and actionable market understandings.
Regional Highlights:
- North America is the fastest-growing region in the global debt collection market compared to other regions. 31% growth will originate from North America. The growth of the market in the region is mainly attributed to factors such as the availability of adequate IT infrastructure and the high penetration of debt collection agents and accounts receivable management enterprises in the US and Canada.
Type Segment Overview
- The Global Debt Collection Software Market as per deployment segmentation is categorized into on-premise and cloud.
- Revenue Generating Segment - The on-premises segment will be a significant contributor to market growth during the forecast period. In an on-premises deployment model, the software is installed on the user's server. It is maintained by IT specialists maintain within an organization. The software is priced as per the one-time perpetual license fee, which includes a recurring fee for training, support, and updates.
Download a FREE Sample Report that can help you to strategize your sales revenue - Get it now!
Global Debt Collection Software Market – Market Dynamics
Major Driver Boosting the Market
- Regulatory compliance is driving market growth.
- Large organizations need to comply with various regional and international regulations. Any breach can result in financial losses and damage to reputation, which may lead to customer attrition.
- Debt collection software helps in complying with industry-focused regulatory guidelines and laws. The software supports compliance management through compliance training, document control, ongoing auditing, as well as recording and reporting of exception events and corrective actions.
Major trends influencing the growth of the market
- The introduction of analytics in debt collection software is a trend in the market.
- Predictive analytics analyzes the current and historical account data, which helps identify debtors that are likely to pay.
- The use of analytics helps in optimizing debt operations by reducing the average credit collection period, streamlining quality assurance monitoring processes, and improving agent retention and overall agent performance.
Major Challenges interrupting the market growth
- The lack of awareness about debt collection software among end-users may challenge the debt collection software market growth.
- Organizations in developing regions are unaware of debt collection software. Hence, vendors need to create awareness about upcoming debt collection software solutions through seminars and webinars, trade fairs, and other promotional events.
- Thus, lack of awareness negatively impacts the adoption of debt-collection software solutions.
To know about other factors of market dynamics – Request a Free Sample!
Technavio suggests three forecast scenarios (optimistic, probable, and pessimistic) considering the impact of COVID-19. Technavio's in-depth research has direct and indirect COVID-19-impacted market research reports.
Register for a free trial today and gain instant access to 17,000+ market research reports.
Technavio's SUBSCRIPTION platform
Cloud Debt Collection Software Market 2023-2027: Key Highlights
- CAGR of the market during the forecast period 2023-2027
- Detailed information on factors that will assist debt collection software market growth during the next five years
- Estimation of the debt collection software market size and its contribution to the parent market
- Predictions on upcoming trends and changes in consumer behavior
- The growth of the debt collection software market
- Analysis of the market's competitive landscape and detailed information on vendors
- Comprehensive details of factors that will challenge the growth of debt collection software market vendors
Related Reports:
- The geomarketing software market share is expected to increase by USD 16.85 billion from 2021 to 2026, and the market's growth momentum will accelerate at a CAGR of 22.93%. This report extensively covers market segmentation by deployment (cloud-based and on-premises), location (outdoor and indoor), and geography (North America, APAC, Europe, Middle East and Africa, and South America).
- The claims processing software market share is expected to increase by USD 24.39 billion from 2021 to 2026, and the market's growth momentum will accelerate at a CAGR of 8.71%. This report extensively covers segmentation by component (software and services) and geography (North America, Europe, APAC, South America, and the Middle East and Africa).
Debt Collection Software Market Scope | |
Report Coverage | Details |
Page number | 120 |
Base year | 2022 |
Historical year | 2017-2021 |
Forecast period | 2023-2027 |
Growth momentum & CAGR | Accelerate at a CAGR of 8.55% |
Market growth 2023-2027 | USD 1614.02 million |
Market structure | Fragmented |
YoY growth (%) | 4.89 |
Regional analysis | North America, Europe, APAC, South America, and the Middle East and Africa |
Performing market contribution | North America at 31% |
Key consumer countries | US, Japan, China, Germany, and UK |
Competitive landscape | Leading companies, competitive strategies, consumer engagement scope |
Key companies profiled | A4dable Software, Ameyo Pvt Ltd., Analog Legalhub Technology Solutions Pvt. Ltd., Chetu Inc., Comtronic Systems LLC, DAKCS Software Systems Inc., DebtCol Software Pty. Ltd., Experian Plc, ezyCollect Pty. Ltd., Fair Isaac Corp., Fidelity National Information Services Inc., Gaviti Akyl Ltd., Indigo Cloud Ltd., MarketXpander Services Pvt. Ltd., Nestack Technologies Pvt. Ltd., PrimeSoft Solutions Inc., Quantrax Corp. Inc., Radixweb, receeve GmbH, and Totality Software Inc. |
Market dynamics | Parent market analysis, market growth inducers and obstacles, fast-growing and slow-growing segment analysis, COVID-19 impact and recovery analysis and future consumer dynamics, and market condition analysis for the forecast period. |
Customization purview | If our report has not included the data that you are looking for, you can reach out to our analysts and get segments customized. |
Browse Information Technology Market Reports
Table of Contents:
1 Executive Summary
- 1.1 Market overview
- Exhibit 01: Executive Summary – Chart on Market Overview
- Exhibit 02: Executive Summary – Data Table on Market Overview
- Exhibit 03: Executive Summary – Chart on Global Market Characteristics
- Exhibit 04: Executive Summary – Chart on Market by Geography
- Exhibit 05: Executive Summary – Chart on Market Segmentation by Deployment
- Exhibit 06: Executive Summary – Chart on Market Segmentation by Industry Application
- Exhibit 07: Executive Summary – Chart on Incremental Growth
- Exhibit 08: Executive Summary – Data Table on Incremental Growth
- Exhibit 09: Executive Summary – Chart on Vendor Market Positioning
2 Market Landscape
- 2.1 Market ecosystem
- Exhibit 10: Parent market
- Exhibit 11: Market Characteristics
3 Market Sizing
- 3.1 Market definition
- Exhibit 12: Offerings of vendors included in the market definition
- 3.2 Market segment analysis
- Exhibit 13: Market segments
- 3.3 Market size 2022
- 3.4 Market outlook: Forecast for 2022-2027
- Exhibit 14: Chart on Global - Market size and forecast 2022-2027 ($ million)
- Exhibit 15: Data Table on Global - Market size and forecast 2022-2027 ($ million)
- Exhibit 16: Chart on Global Market: Year-over-year growth 2022-2027 (%)
- Exhibit 17: Data Table on Global Market: Year-over-year growth 2022-2027 (%)
4 Five Forces Analysis
- 4.1 Five forces summary
- Exhibit 18: Five forces analysis - Comparison between 2022 and 2027
- 4.2 Bargaining power of buyers
- Exhibit 19: Chart on Bargaining power of buyers – Impact of key factors 2022 and 2027
- 4.3 Bargaining power of suppliers
- Exhibit 20: Bargaining power of suppliers – Impact of key factors in 2022 and 2027
- 4.4 Threat of new entrants
- Exhibit 21: Threat of new entrants – Impact of key factors in 2022 and 2027
- 4.5 Threat of substitutes
- Exhibit 22: Threat of substitutes – Impact of key factors in 2022 and 2027
- 4.6 Threat of rivalry
- Exhibit 23: Threat of rivalry – Impact of key factors in 2022 and 2027
- 4.7 Market condition
- Exhibit 24: Chart on Market condition - Five forces 2022 and 2027
5 Market Segmentation by Deployment
- 5.1 Market segments
- Exhibit 25: Chart on Deployment - Market share 2022-2027 (%)
- Exhibit 26: Data Table on Deployment - Market share 2022-2027 (%)
- 5.2 Comparison by Deployment
- Exhibit 27: Chart on Comparison by Deployment
- Exhibit 28: Data Table on Comparison by Deployment
- 5.3 On-premise - Market size and forecast 2022-2027
- Exhibit 29: Chart on On-premise - Market size and forecast 2022-2027 ($ million)
- Exhibit 30: Data Table on On-premise - Market size and forecast 2022-2027 ($ million)
- Exhibit 31: Chart on On-premise - Year-over-year growth 2022-2027 (%)
- Exhibit 32: Data Table on On-premise - Year-over-year growth 2022-2027 (%)
- 5.4 Cloud-based - Market size and forecast 2022-2027
- Exhibit 33: Chart on Cloud-based - Market size and forecast 2022-2027 ($ million)
- Exhibit 34: Data Table on Cloud-based - Market size and forecast 2022-2027 ($ million)
- Exhibit 35: Chart on Cloud-based - Year-over-year growth 2022-2027 (%)
- Exhibit 36: Data Table on Cloud-based - Year-over-year growth 2022-2027 (%)
- 5.5 Market opportunity by Deployment
- Exhibit 37: Market opportunity by Deployment ($ million)
6 Market Segmentation by Industry Application
- 6.1 Market segments
- Exhibit 38: Chart on Industry Application - Market share 2022-2027 (%)
- Exhibit 39: Data Table on Industry Application - Market share 2022-2027 (%)
- 6.2 Comparison by Industry Application
- Exhibit 40: Chart on Comparison by Industry Application
- Exhibit 41: Data Table on Comparison by Industry Application
- 6.3 Small and medium enterprises - Market size and forecast 2022-2027
- Exhibit 42: Chart on Small and medium enterprises - Market size and forecast 2022-2027 ($ million)
- Exhibit 43: Data Table on Small and medium enterprises - Market size and forecast 2022-2027 ($ million)
- Exhibit 44: Chart on Small and medium enterprises - Year-over-year growth 2022-2027 (%)
- Exhibit 45: Data Table on Small and medium enterprises - Year-over-year growth 2022-2027 (%)
- 6.4 Large enterprises - Market size and forecast 2022-2027
- Exhibit 46: Chart on Large enterprises - Market size and forecast 2022-2027 ($ million)
- Exhibit 47: Data Table on Large enterprises - Market size and forecast 2022-2027 ($ million)
- Exhibit 48: Chart on Large enterprises - Year-over-year growth 2022-2027 (%)
- Exhibit 49: Data Table on Large enterprises - Year-over-year growth 2022-2027 (%)
- 6.5 Market opportunity by Industry Application
- Exhibit 50: Market opportunity by Industry Application ($ million)
7 Customer Landscape
- 7.1 Customer landscape overview
- Exhibit 51: Analysis of price sensitivity, lifecycle, customer purchase basket, adoption rates, and purchase criteria
8 Geographic Landscape
- 8.1 Geographic segmentation
- Exhibit 52: Chart on Market share by geography 2022-2027 (%)
- Exhibit 53: Data Table on Market share by geography 2022-2027 (%)
- 8.2 Geographic comparison
- Exhibit 54: Chart on Geographic comparison
- Exhibit 55: Data Table on Geographic comparison
- 8.3 North America - Market size and forecast 2022-2027
- Exhibit 56: Chart on North America - Market size and forecast 2022-2027 ($ million)
- Exhibit 57: Data Table on North America - Market size and forecast 2022-2027 ($ million)
- Exhibit 58: Chart on North America - Year-over-year growth 2022-2027 (%)
- Exhibit 59: Data Table on North America - Year-over-year growth 2022-2027 (%)
- 8.4 Europe - Market size and forecast 2022-2027
- Exhibit 60: Chart on Europe - Market size and forecast 2022-2027 ($ million)
- Exhibit 61: Data Table on Europe - Market size and forecast 2022-2027 ($ million)
- Exhibit 62: Chart on Europe - Year-over-year growth 2022-2027 (%)
- Exhibit 63: Data Table on Europe - Year-over-year growth 2022-2027 (%)
- 8.5 APAC - Market size and forecast 2022-2027
- Exhibit 64: Chart on APAC - Market size and forecast 2022-2027 ($ million)
- Exhibit 65: Data Table on APAC - Market size and forecast 2022-2027 ($ million)
- Exhibit 66: Chart on APAC - Year-over-year growth 2022-2027 (%)
- Exhibit 67: Data Table on APAC - Year-over-year growth 2022-2027 (%)
- 8.6 South America - Market size and forecast 2022-2027
- Exhibit 68: Chart on South America - Market size and forecast 2022-2027 ($ million)
- Exhibit 69: Data Table on South America - Market size and forecast 2022-2027 ($ million)
- Exhibit 70: Chart on South America - Year-over-year growth 2022-2027 (%)
- Exhibit 71: Data Table on South America - Year-over-year growth 2022-2027 (%)
- 8.7 Middle East and Africa - Market size and forecast 2022-2027
- Exhibit 72: Chart on Middle East and Africa - Market size and forecast 2022-2027 ($ million)
- Exhibit 73: Data Table on Middle East and Africa - Market size and forecast 2022-2027 ($ million)
- Exhibit 74: Chart on Middle East and Africa - Year-over-year growth 2022-2027 (%)
- Exhibit 75: Data Table on Middle East and Africa - Year-over-year growth 2022-2027 (%)
- 8.8 US - Market size and forecast 2022-2027
- Exhibit 76: Chart on US - Market size and forecast 2022-2027 ($ million)
- Exhibit 77: Data Table on US - Market size and forecast 2022-2027 ($ million)
- Exhibit 78: Chart on US - Year-over-year growth 2022-2027 (%)
- Exhibit 79: Data Table on US - Year-over-year growth 2022-2027 (%)
- 8.9 Germany - Market size and forecast 2022-2027
- Exhibit 80: Chart on Germany - Market size and forecast 2022-2027 ($ million)
- Exhibit 81: Data Table on Germany - Market size and forecast 2022-2027 ($ million)
- Exhibit 82: Chart on Germany - Year-over-year growth 2022-2027 (%)
- Exhibit 83: Data Table on Germany - Year-over-year growth 2022-2027 (%)
- 8.10 Japan - Market size and forecast 2022-2027
- Exhibit 84: Chart on Japan - Market size and forecast 2022-2027 ($ million)
- Exhibit 85: Data Table on Japan - Market size and forecast 2022-2027 ($ million)
- Exhibit 86: Chart on Japan - Year-over-year growth 2022-2027 (%)
- Exhibit 87: Data Table on Japan - Year-over-year growth 2022-2027 (%)
- 8.11 China - Market size and forecast 2022-2027
- Exhibit 88: Chart on China - Market size and forecast 2022-2027 ($ million)
- Exhibit 89: Data Table on China - Market size and forecast 2022-2027 ($ million)
- Exhibit 90: Chart on China - Year-over-year growth 2022-2027 (%)
- Exhibit 91: Data Table on China - Year-over-year growth 2022-2027 (%)
- 8.12 UK - Market size and forecast 2022-2027
- Exhibit 92: Chart on UK - Market size and forecast 2022-2027 ($ million)
- Exhibit 93: Data Table on UK - Market size and forecast 2022-2027 ($ million)
- Exhibit 94: Chart on UK - Year-over-year growth 2022-2027 (%)
- Exhibit 95: Data Table on UK - Year-over-year growth 2022-2027 (%)
- 8.13 Market opportunity by geography
- Exhibit 96: Market opportunity by geography ($ million)
9 Drivers, Challenges, and Trends
- 9.1 Market drivers
- 9.2 Market challenges
- 9.3 Impact of drivers and challenges
- Exhibit 97: Impact of drivers and challenges in 2022 and 2027
- 9.4 Market trends
10 Vendor Landscape
- 10.1 Overview
- 10.2 Vendor landscape
- Exhibit 98: Overview on Criticality of inputs and Factors of differentiation
- 10.3 Landscape disruption
- Exhibit 99: Overview on factors of disruption
- 10.4 Industry risks
- Exhibit 100: Impact of key risks on business
11 Vendor Analysis
- 11.1 Vendors covered
- Exhibit 101: Vendors covered
- 11.2 Market positioning of vendors
- Exhibit 102: Matrix on vendor position and classification
- 11.3 A4dable Software
- Exhibit 103: A4dable Software - Overview
- Exhibit 104: A4dable Software - Product / Service
- Exhibit 105: A4dable Software - Key offerings
- 11.4 Analog Legalhub Technology Solutions Pvt. Ltd.
- Exhibit 106: Analog Legalhub Technology Solutions Pvt. Ltd. - Overview
- Exhibit 107: Analog Legalhub Technology Solutions Pvt. Ltd. - Product / Service
- Exhibit 108: Analog Legalhub Technology Solutions Pvt. Ltd. - Key offerings
- 11.5 Chetu Inc.
- Exhibit 109: Chetu Inc. - Overview
- Exhibit 110: Chetu Inc. - Product / Service
- Exhibit 111: Chetu Inc. - Key offerings
- 11.6 Comtronic Systems LLC
- Exhibit 112: Comtronic Systems LLC - Overview
- Exhibit 113: Comtronic Systems LLC - Product / Service
- Exhibit 114: Comtronic Systems LLC - Key offerings
- 11.7 DAKCS Software Systems Inc.
- Exhibit 115: DAKCS Software Systems Inc. - Overview
- Exhibit 116: DAKCS Software Systems Inc. - Product / Service
- Exhibit 117: DAKCS Software Systems Inc. - Key offerings
- 11.8 DebtCol Software Pty. Ltd.
- Exhibit 118: DebtCol Software Pty. Ltd. - Overview
- Exhibit 119: DebtCol Software Pty. Ltd. - Product / Service
- Exhibit 120: DebtCol Software Pty. Ltd. - Key offerings
- 11.9 Experian Plc
- Exhibit 121: Experian Plc - Overview
- Exhibit 122: Experian Plc - Business segments
- Exhibit 123: Experian Plc - Key news
- Exhibit 124: Experian Plc - Key offerings
- Exhibit 125: Experian Plc - Segment focus
- 11.10 ezyCollect Pty. Ltd.
- Exhibit 126: ezyCollect Pty. Ltd. - Overview
- Exhibit 127: ezyCollect Pty. Ltd. - Product / Service
- Exhibit 128: ezyCollect Pty. Ltd. - Key offerings
- 11.11 Fair Isaac Corp.
- Exhibit 129: Fair Isaac Corp. - Overview
- Exhibit 130: Fair Isaac Corp. - Business segments
- Exhibit 131: Fair Isaac Corp. - Key news
- Exhibit 132: Fair Isaac Corp. - Key offerings
- Exhibit 133: Fair Isaac Corp. - Segment focus
- 11.12 Fidelity National Information Services Inc.
- Exhibit 134: Fidelity National Information Services Inc. - Overview
- Exhibit 135: Fidelity National Information Services Inc. - Business segments
- Exhibit 136: Fidelity National Information Services Inc. - Key news
- Exhibit 137: Fidelity National Information Services Inc. - Key offerings
- Exhibit 138: Fidelity National Information Services Inc. - Segment focus
- 11.13 Indigo Cloud Ltd.
- Exhibit 139: Indigo Cloud Ltd. - Overview
- Exhibit 140: Indigo Cloud Ltd. - Product / Service
- Exhibit 141: Indigo Cloud Ltd. - Key offerings
- 11.14 PrimeSoft Solutions Inc.
- Exhibit 142: PrimeSoft Solutions Inc. - Overview
- Exhibit 143: PrimeSoft Solutions Inc. - Product / Service
- Exhibit 144: PrimeSoft Solutions Inc. - Key offerings
- 11.15 Quantrax Corp. Inc.
- Exhibit 145: Quantrax Corp. Inc. - Overview
- Exhibit 146: Quantrax Corp. Inc. - Product / Service
- Exhibit 147: Quantrax Corp. Inc. - Key offerings
- 11.16 Radixweb
- Exhibit 148: Radixweb - Overview
- Exhibit 149: Radixweb - Product / Service
- Exhibit 150: Radixweb - Key offerings
- 11.17 receeve GmbH
- Exhibit 151: receeve GmbH - Overview
- Exhibit 152: receeve GmbH - Product / Service
- Exhibit 153: receeve GmbH - Key offerings
12 Appendix
- 12.1 Scope of the report
- 12.2 Inclusions and exclusions checklist
- Exhibit 154: Inclusions checklist
- Exhibit 155: Exclusions checklist
- 12.3 Currency conversion rates for US$
- Exhibit 156: Currency conversion rates for US$
- 12.4 Research methodology
- Exhibit 157: Research methodology
- Exhibit 158: Validation techniques employed for market sizing
- Exhibit 159: Information sources
- 12.5 List of abbreviations
- Exhibit 160: List of abbreviations
About Us
Technavio is a leading global technology research and advisory company. Their research and analysis focus on emerging market trends and provide actionable insights to help businesses identify market opportunities and develop effective strategies to optimize their market positions. With over 500 specialized analysts, Technavio's report library consists of more than 17,000 reports and counting, covering 800 technologies, spanning 50 countries. Their client base consists of enterprises of all sizes, including more than 100 Fortune 500 companies. This growing client base relies on Technavio's comprehensive coverage, extensive research, and actionable market insights to identify opportunities in existing and potential markets and assess their competitive positions within changing market scenarios.
Technavio Research
Jesse Maida
Media & Marketing Executive
US: +1 844 364 1100
UK: +44 203 893 3200
Email: media@technavio.com
Website: www.technavio.com/


SOURCE Technavio
© 2024 Benzinga.com. Benzinga does not provide investment advice. All rights reserved.
Trade confidently with insights and alerts from analyst ratings, free reports and breaking news that affects the stocks you care about.

