


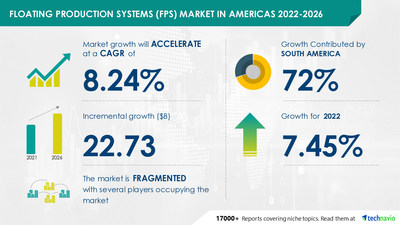
NEW YORK, Oct. 31, 2022 /PRNewswire/ -- The "Floating Production Systems (FPS) Market in the Americas by Type and Geography - Forecast and Analysis 2022-2026" has been added to Technavio's offerings. The market size in the Americas is estimated to grow by USD 22.73 billion from 2021 to 2026. In addition, the growth momentum of the market will accelerate at a CAGR of 8.24% during the forecast period.

View a comprehensive report summary that describes the market size and forecast along with research methodology. The FREE sample report is available in PDF format
The increase in the demand for energy is driving the growth of the floating production systems (FPS) market in the Americas during the forecast period. According to the IEA, the energy demand is expected to grow by 25% from 2018 to 2040 globally. The rise in the demand for energy from the industrial and power sectors in the Americas is expected to increase energy consumption. The US is a net energy exporter owing to an increase in the production of crude oil, natural gas, and natural gas plant liquids, along with a slow growth in energy consumption in the country. Due to high production, the Americas can cater to the demand for energy in other regions by exporting the produced fuel. Therefore, the need to meet the rising energy demand of the region is driving the growth of offshore oil and gas activities. This, in turn, will fuel the growth of the floating production systems (FPS) market in the Americas during the forecast period.
Identify key trends, drivers, and challenges in the report, which will help vendors improve their strategies to stay ahead of their competitors. Buy Now for detailed vendor information
- By type, the market is classified into FPSO, semi-submersible, SPAR, TLP, and others. The FPSO segment will contribute the largest share of the market during the forecast period. An FPSO unit is a floating platform equipped with hydrocarbon processing units for separating and treating crude oil, water, and gases that flow to the platform from subsea wells. For oil and gas production, an FPSO system can be installed from a reservoir located deep in the ocean. This allows oil companies to produce oil from more remote areas and deepwater reserves. They can store the treated crude oil and use an offloading system to transfer this crude oil to shuttle tankers for transportation. Such advantages will drive the segment market growth during the forecast period.
- By geography, the market is classified into South America, North America, Brazil, the US, Mexico, and Canada. South America will have the largest share of the market and is expected to account for 72% of the market's growth during the forecast period. This growth is attributed to factors such as the increasing number of E&P projects. Moreover, market growth in this region will be faster than the growth of the market in North America. Brazil and Guyana are the key countries for the floating production systems (FPS) market in South America.
Learn about the contribution of each segment summarized in concise infographics and thorough descriptions. View a FREE PDF Sample Report
The floating production systems (FPS) market in the Americas report provides complete insights on key vendors, including BHP Group plc, BP Plc, BW Offshore Ltd., Canadian Natural Resources Ltd., Cenovus Energy Inc., Chevron Corp., Excelerate Energy Inc., Golar LNG Ltd., Hoegh LNG Holdings Ltd., MODEC Inc., Murphy Oil Corp., Petroleo Brasileiro SA, SAIPEM SpA, SBM Offshore NV, Shell plc, Suncor Energy Inc., Teekay Corp., TotalEnergies SE, W&T Offshore Inc., and Yokogawa Electric Corp.
Get lifetime access to our Technavio Insights! Subscribe to our Basic Plan billed annually at USD 5000
The report includes competitive analysis, a proprietary tool to analyze and evaluate the position of companies based on their industry position score and market performance score. The tool uses various factors for categorizing the players into four categories. Some of these factors considered for analysis are financial performance over the last three years, growth strategies, innovation score, new product launches, investments, growth in market share, etc.
Subsea Production and Processing Market by Application and Geography - Forecast and Analysis 2022-2026: The growing consumption of oil and natural gas is driving the market growth. By 2026, the world oil demand will increase by 4.4 mb/d when compared to 2019 levels. The largest contributors to this growth will be China, India, and other Asian economies.
Subsea Production Systems Market by Equipment Type and Geography - Forecast and Analysis 2021-2025: The rising deep and ultra-deepwater drilling projects are driving the market growth. Oil and gas upstream companies have been extracting oil and natural gas from onshore wells for many years. In offshore drilling, oil and gas companies are shifting their focus from shallow waters to deepwater and ultra-deepwater resources due to large untapped reserves.
Floating Production Systems (FPS) Market Scope in the Americas | |
Report Coverage | Details |
Page number | 120 |
Base year | 2021 |
Forecast period | 2022-2026 |
Growth momentum & CAGR | Accelerate at a CAGR of 8.24% |
Market growth 2022-2026 | USD 22.73 billion |
Market structure | Fragmented |
YoY growth (%) | 7.45 |
Regional analysis | South America, North America, Brazil, US, Mexico, and Canada |
Performing market contribution | South America at 72% |
Key consumer countries | US, Mexico, Canada, Brazil, Guyana |
Competitive landscape | Leading companies, competitive strategies, consumer engagement scope |
Companies profiled | BHP Group plc, BP Plc, BW Offshore Ltd., Canadian Natural Resources Ltd., Cenovus Energy Inc., Chevron Corp., Excelerate Energy Inc., Golar LNG Ltd., Hoegh LNG Holdings Ltd., MODEC Inc., Murphy Oil Corp., Petroleo Brasileiro SA, SAIPEM SpA, SBM Offshore NV, Shell plc, Suncor Energy Inc., Teekay Corp., TotalEnergies SE, W&T Offshore Inc., and Yokogawa Electric Corp. |
Market Dynamics | Parent market analysis, market growth inducers and obstacles, fast-growing and slow-growing segment analysis, COVID-19 impact and future consumer dynamics, and market condition analysis for the forecast period. |
Customization purview | If our report has not included the data that you are looking for, you can reach out to our analysts and get segments customized. |
Browse Energy Market Growth
1 Executive Summary
- 1.1 Market overview
- Exhibit 01: Executive Summary – Chart on Market Overview
- Exhibit 02: Executive Summary – Data Table on Market Overview
- Exhibit 03: Executive Summary – Chart on Global Market Characteristics
- Exhibit 04: Executive Summary – Chart on Market by Geography
- Exhibit 05: Executive Summary – Chart on Market Segmentation by Type
- Exhibit 06: Executive Summary – Chart on Incremental Growth
- Exhibit 07: Executive Summary – Data Table on Incremental Growth
- Exhibit 08: Executive Summary – Chart on Vendor Market Positioning
2 Market Landscape
- 2.1 Market ecosystem
- Exhibit 09: Parent market
- Exhibit 10: Market Characteristics
3 Market Sizing
- 3.1 Market definition
- Exhibit 11: Offerings of vendors included in the market definition
- 3.2 Market segment analysis
- Exhibit 12: Market segments
- 3.3 Market size 2021
- 3.4 Market outlook: Forecast for 2021-2026
- Exhibit 13: Chart on Global - Market size and forecast 2021-2026 ($ million)
- Exhibit 14: Data Table on Global - Market size and forecast 2021-2026 ($ million)
- Exhibit 15: Chart on Global Market: Year-over-year growth 2021-2026 (%)
- Exhibit 16: Data Table on Global Market: Year-over-year growth 2021-2026 (%)
4 Five Forces Analysis
- 4.1 Five forces summary
- Exhibit 17: Five forces analysis - Comparison between 2021 and 2026
- 4.2 Bargaining power of buyers
- Exhibit 18: Chart on Bargaining power of buyers – Impact of key factors 2021 and 2026
- 4.3 Bargaining power of suppliers
- Exhibit 19: Bargaining power of suppliers – Impact of key factors in 2021 and 2026
- 4.4 Threat of new entrants
- Exhibit 20: Threat of new entrants – Impact of key factors in 2021 and 2026
- 4.5 Threat of substitutes
- Exhibit 21: Threat of substitutes – Impact of key factors in 2021 and 2026
- 4.6 Threat of rivalry
- Exhibit 22: Threat of rivalry – Impact of key factors in 2021 and 2026
- 4.7 Market condition
- Exhibit 23: Chart on Market condition - Five forces 2021 and 2026
5 Market Segmentation by Type
- 5.1 Market segments
- Exhibit 24: Chart on Type - Market share 2021-2026 (%)
- Exhibit 25: Data Table on Type - Market share 2021-2026 (%)
- 5.2 Comparison by Type
- Exhibit 26: Chart on Comparison by Type
- Exhibit 27: Data Table on Comparison by Type
- 5.3 FPSO - Market size and forecast 2021-2026
- Exhibit 28: Chart on FPSO - Market size and forecast 2021-2026 ($ million)
- Exhibit 29: Data Table on FPSO - Market size and forecast 2021-2026 ($ million)
- Exhibit 30: Chart on FPSO - Year-over-year growth 2021-2026 (%)
- Exhibit 31: Data Table on FPSO - Year-over-year growth 2021-2026 (%)
- 5.4 Semi-submersible - Market size and forecast 2021-2026
- Exhibit 32: Chart on Semi-submersible - Market size and forecast 2021-2026 ($ million)
- Exhibit 33: Data Table on Semi-submersible - Market size and forecast 2021-2026 ($ million)
- Exhibit 34: Chart on Semi-submersible - Year-over-year growth 2021-2026 (%)
- Exhibit 35: Data Table on Semi-submersible - Year-over-year growth 2021-2026 (%)
- 5.5 SPAR - Market size and forecast 2021-2026
- Exhibit 36: Chart on SPAR - Market size and forecast 2021-2026 ($ million)
- Exhibit 37: Data Table on SPAR - Market size and forecast 2021-2026 ($ million)
- Exhibit 38: Chart on SPAR - Year-over-year growth 2021-2026 (%)
- Exhibit 39: Data Table on SPAR - Year-over-year growth 2021-2026 (%)
- 5.6 TLP - Market size and forecast 2021-2026
- Exhibit 40: Chart on TLP - Market size and forecast 2021-2026 ($ million)
- Exhibit 41: Data Table on TLP - Market size and forecast 2021-2026 ($ million)
- Exhibit 42: Chart on TLP - Year-over-year growth 2021-2026 (%)
- Exhibit 43: Data Table on TLP - Year-over-year growth 2021-2026 (%)
- 5.7 Others - Market size and forecast 2021-2026
- Exhibit 44: Chart on Others - Market size and forecast 2021-2026 ($ million)
- Exhibit 45: Data Table on Others - Market size and forecast 2021-2026 ($ million)
- Exhibit 46: Chart on Others - Year-over-year growth 2021-2026 (%)
- Exhibit 47: Data Table on Others - Year-over-year growth 2021-2026 (%)
- 5.8 Market opportunity by Type
- Exhibit 48: Market opportunity by Type ($ million)
6 Customer Landscape
- 6.1 Customer landscape overview
- Exhibit 49: Analysis of price sensitivity, lifecycle, customer purchase basket, adoption rates, and purchase criteria
7 Geographic Landscape
- 7.1 Geographic segmentation
- Exhibit 50: Chart on Market share by geography 2021-2026 (%)
- Exhibit 51: Data Table on Market share by geography 2021-2026 (%)
- 7.2 Geographic comparison
- Exhibit 52: Chart on Geographic comparison
- Exhibit 53: Data Table on Geographic comparison
- 7.3 South America - Market size and forecast 2021-2026
- Exhibit 54: Chart on South America - Market size and forecast 2021-2026 ($ million)
- Exhibit 55: Data Table on South America - Market size and forecast 2021-2026 ($ million)
- Exhibit 56: Chart on South America - Year-over-year growth 2021-2026 (%)
- Exhibit 57: Data Table on South America - Year-over-year growth 2021-2026 (%)
- 7.4 North America - Market size and forecast 2021-2026
- Exhibit 58: Chart on North America - Market size and forecast 2021-2026 ($ million)
- Exhibit 59: Data Table on North America - Market size and forecast 2021-2026 ($ million)
- Exhibit 60: Chart on North America - Year-over-year growth 2021-2026 (%)
- Exhibit 61: Data Table on North America - Year-over-year growth 2021-2026 (%)
- 7.5 Brazil - Market size and forecast 2021-2026
- Exhibit 62: Chart on Brazil - Market size and forecast 2021-2026 ($ million)
- Exhibit 63: Data Table on Brazil - Market size and forecast 2021-2026 ($ million)
- Exhibit 64: Chart on Brazil - Year-over-year growth 2021-2026 (%)
- Exhibit 65: Data Table on Brazil - Year-over-year growth 2021-2026 (%)
- 7.6 US - Market size and forecast 2021-2026
- Exhibit 66: Chart on US - Market size and forecast 2021-2026 ($ million)
- Exhibit 67: Data Table on US - Market size and forecast 2021-2026 ($ million)
- Exhibit 68: Chart on US - Year-over-year growth 2021-2026 (%)
- Exhibit 69: Data Table on US - Year-over-year growth 2021-2026 (%)
- 7.7 Mexico - Market size and forecast 2021-2026
- Exhibit 70: Chart on Mexico - Market size and forecast 2021-2026 ($ million)
- Exhibit 71: Data Table on Mexico - Market size and forecast 2021-2026 ($ million)
- Exhibit 72: Chart on Mexico - Year-over-year growth 2021-2026 (%)
- Exhibit 73: Data Table on Mexico - Year-over-year growth 2021-2026 (%)
- 7.8 Canada - Market size and forecast 2021-2026
- Exhibit 74: Chart on Canada - Market size and forecast 2021-2026 ($ million)
- Exhibit 75: Data Table on Canada - Market size and forecast 2021-2026 ($ million)
- Exhibit 76: Chart on Canada - Year-over-year growth 2021-2026 (%)
- Exhibit 77: Data Table on Canada - Year-over-year growth 2021-2026 (%)
- 7.9 Guyana - Market size and forecast 2021-2026
- Exhibit 78: Chart on Guyana - Market size and forecast 2021-2026 ($ million)
- Exhibit 79: Data Table on Guyana - Market size and forecast 2021-2026 ($ million)
- Exhibit 80: Chart on Guyana - Year-over-year growth 2021-2026 (%)
- Exhibit 81: Data Table on Guyana - Year-over-year growth 2021-2026 (%)
- 7.10 Market opportunity by geography
- Exhibit 82: Market opportunity by geography ($ million)
8 Drivers, Challenges, and Trends
- 8.1 Market drivers
- 8.2 Market challenges
- 8.3 Impact of drivers and challenges
- Exhibit 83: Impact of drivers and challenges in 2021 and 2026
- 8.4 Market trends
9 Vendor Landscape
- 9.1 Overview
- 9.2 Vendor landscape
- Exhibit 84: Overview on Criticality of inputs and Factors of differentiation
- 9.3 Landscape disruption
- Exhibit 85: Overview on factors of disruption
- 9.4 Industry risks
- Exhibit 86: Impact of key risks on business
10 Vendor Analysis
- 10.1 Vendors covered
- Exhibit 87: Vendors covered
- 10.2 Market positioning of vendors
- Exhibit 88: Matrix on vendor position and classification
- 10.3 BHP Group plc
- Exhibit 89: BHP Group plc - Overview
- Exhibit 90: BHP Group plc - Business segments
- Exhibit 91: BHP Group plc - Key offerings
- Exhibit 92: BHP Group plc - Segment focus
- 10.4 BP Plc
- Exhibit 93: BP Plc - Overview
- Exhibit 94: BP Plc - Business segments
- Exhibit 95: BP Plc - Key offerings
- Exhibit 96: BP Plc - Segment focus
- 10.5 BW Offshore Ltd.
- Exhibit 97: BW Offshore Ltd. - Overview
- Exhibit 98: BW Offshore Ltd. - Business segments
- Exhibit 99: BW Offshore Ltd. - Key offerings
- Exhibit 100: BW Offshore Ltd. - Segment focus
- 10.6 Chevron Corp.
- Exhibit 101: Chevron Corp. - Overview
- Exhibit 102: Chevron Corp. - Business segments
- Exhibit 103: Chevron Corp. - Key news
- Exhibit 104: Chevron Corp. - Key offerings
- Exhibit 105: Chevron Corp. - Segment focus
- 10.7 Excelerate Energy Inc.
- Exhibit 106: Excelerate Energy Inc. - Overview
- Exhibit 107: Excelerate Energy Inc. - Product / Service
- Exhibit 108: Excelerate Energy Inc. - Key news
- Exhibit 109: Excelerate Energy Inc. - Key offerings
- 10.8 Golar LNG Ltd.
- Exhibit 110: Golar LNG Ltd. - Overview
- Exhibit 111: Golar LNG Ltd. - Business segments
- Exhibit 112: Golar LNG Ltd. - Key news
- Exhibit 113: Golar LNG Ltd. - Key offerings
- Exhibit 114: Golar LNG Ltd. - Segment focus
- 10.9 Hoegh LNG Holdings Ltd.
- Exhibit 115: Hoegh LNG Holdings Ltd. - Overview
- Exhibit 116: Hoegh LNG Holdings Ltd. - Business segments
- Exhibit 117: Hoegh LNG Holdings Ltd. - Key news
- Exhibit 118: Hoegh LNG Holdings Ltd. - Key offerings
- Exhibit 119: Hoegh LNG Holdings Ltd. - Segment focus
- 10.10 MODEC Inc.
- Exhibit 120: MODEC Inc. - Overview
- Exhibit 121: MODEC Inc. - Product / Service
- Exhibit 122: MODEC Inc. - Key offerings
- 10.11 Petroleo Brasileiro SA
- Exhibit 123: Petroleo Brasileiro SA - Overview
- Exhibit 124: Petroleo Brasileiro SA - Business segments
- Exhibit 125: Petroleo Brasileiro SA - Key offerings
- Exhibit 126: Petroleo Brasileiro SA - Segment focus
- 10.12 SBM Offshore NV
- Exhibit 127: SBM Offshore NV - Overview
- Exhibit 128: SBM Offshore NV - Business segments
- Exhibit 129: SBM Offshore NV - Key offerings
- Exhibit 130: SBM Offshore NV - Segment focus
11 Appendix
- 11.1 Scope of the report
- 11.2 Inclusions and exclusions checklist
- Exhibit 131: Inclusions checklist
- Exhibit 132: Exclusions checklist
- 11.3 Currency conversion rates for US$
- Exhibit 133: Currency conversion rates for US$
- 11.4 Research methodology
- Exhibit 134: Research methodology
- Exhibit 135: Validation techniques employed for market sizing
- Exhibit 136: Information sources
- 11.5 List of abbreviations
- Exhibit 137: List of abbreviations
Technavio is a leading global technology research and advisory company. Their research and analysis focus on emerging market trends and provide actionable insights to help businesses identify market opportunities and develop effective strategies to optimize their market positions. With over 500 specialized analysts, Technavio's report library consists of more than 17,000 reports and counting, covering 800 technologies, spanning across 50 countries. Their client base consists of enterprises of all sizes, including more than 100 Fortune 500 companies. This growing client base relies on Technavio's comprehensive coverage, extensive research, and actionable market insights to identify opportunities in existing and potential markets and assess their competitive positions within changing market scenarios.
Contact
Technavio Research
Jesse Maida
Media & Marketing Executive
US: +1 844 364 1100
UK: +44 203 893 3200
Email: media@technavio.com
Website: www.technavio.com/


SOURCE Technavio
© 2024 Benzinga.com. Benzinga does not provide investment advice. All rights reserved.
Trade confidently with insights and alerts from analyst ratings, free reports and breaking news that affects the stocks you care about.

