


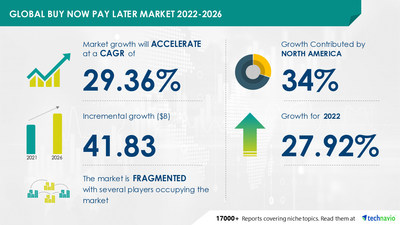
NEW YORK, Oct. 31, 2022 /PRNewswire/ -- The "Buy Now Pay Later Market Growth, Size, Trends, Analysis Report by Type, Application, Region and Segment Forecast 2022-2026" report has been added to Technavio's offering. The market size is expected to grow by USD 41.83 billion from 2021 to 2026. In addition, the growth momentum of the market will accelerate at a CAGR of 29.36% during the forecast period, according to Technavio.

To get the exact yearly growth variance and the Y-O-Y growth rate, Request a FREE PDF Sample Report
Buy Now Pay Later Market End-user Outlook (Revenue, USD bn, 2021-2026)
- Large enterprise - size and forecast 2021-2026
- Small and medium enterprise - size and forecast 2021-2026
Buy Now Pay Later Market Geography Outlook (Revenue, USD bn, 2021-2026)
- North America - size and forecast 2021-2026
- Europe - size and forecast 2021-2026
- APAC - size and forecast 2021-2026
- South America - size and forecast 2021-2026
- Middle East and Africa - size and forecast 2021-2026
Learn about the contribution of each segment summarized in concise infographics and thorough descriptions. View a FREE PDF Sample Report
Regional Analysis
North America will be the leading region with 34% of the market's growth during the forecast period. The US is the key country for the buy now pay later market in North America. The growth of the market in the region is attributed to factors such as the increasing partnerships by market players. Moreover, market growth in this region will be slower than the growth of the market in Europe, APAC and MEA.
Driver and Trend
The increasing adoption of online payment methods is driving the growth of the market. Mobile payment, debit cards, and credit cards are the primary digital payment technologies that provide individuals with advantages such as low transaction costs, quick fund transfers, and high payment security. The availability of high-speed internet access, a rise in smartphone adoption, and an increase in awareness about digital payment services encourage people to use online payments. Moreover, the adoption of BNPL technology and online payment methods across small- and medium-sized businesses in developing countries such as China, Japan, and India are also expected to drive market growth.
Affordable and convenient payment service is a trend in the market. The BNPL payment method provides individuals with various benefits, including fast credit card fund transfer service at the point of sale platform, affordable and convenient payment services, and increased personal information security. This platform enables customers to make secure payments without having to swipe their debit cards. Some of its major benefits include boosting an individual's credit score, reminders regarding payback, and digitally monitoring transaction details. Such advantages are expected to support the growth of the global BNPL market globally.
Technavio has identified key trends, drivers, and challenges in the market, which will help vendors improve their strategies to stay ahead of their competitors. Buy Now for detailed vendor information
Major Five Buy Now Pay Later Companies
- Affirm Inc.
- Afterpay US Services LLC
- Amazon.com Inc.
- APaylater Financials Pte. Ltd.
- Grab Holdings Inc.
- Hoolah Holdings Pte Ltd.
- Klarna Bank AB
- Laybuy Holdings Ltd.
- Monzo Bank Ltd.
- One97 Communications Ltd.
- Pace Now Enterprise Sdn Bhd
- PayPal Holdings Inc.
- Perpay Inc.
- Revolut Ltd.
- Social Money Ltd.
- Visa Inc.
- Zip Co. Ltd.
- Rely Pte Ltd
- Mastercard Inc.
- Flipkart Internet Pvt Ltd
Get lifetime access to our Technavio Insights! Subscribe to our Basic Plan billed annually at USD 5000
Related Reports
Credit Card Payments Market by End-user and Geography - Forecast and Analysis 2022-2026: The rising number of online transactions is driving the market growth. Rapid changes in the IT infrastructure have led to the rise of advanced methods of data theft. Therefore, to make online transactions more secure, many vendors in the market are providing mobile payment security software to prevent fraudulent activities.
Payday Loans Market Growth, Size, Trends, Analysis Report by Type, Application, Region, and Segment Forecast 2022-2026: The growing awareness regarding the payday loan among the youth is driving the payday loans market growth. It is anticipated that one-third of people aged 25 to 34 have a college loan. Most young people are turning to the online payday loans market, which will fuel the growth of the market during the forecast period.
Buy Now Pay Later Market Scope | |
Report Coverage | Details |
Page number | 120 |
Base year | 2021 |
Forecast period | 2022-2026 |
Growth momentum & CAGR | Accelerate at a CAGR of 29.36% |
Market growth 2022-2026 | USD 41.83 billion |
Market structure | Fragmented |
YoY growth (%) | 27.92 |
Regional analysis | North America, Europe, APAC, South America, and Middle East and Africa |
Performing market contribution | North America at 34% |
Key consumer countries | US, China, India, Germany, and UK |
Competitive landscape | Leading companies, competitive strategies, consumer engagement scope |
Companies profiled | Affirm Inc., Afterpay US Services LLC, Amazon.com Inc., APaylater Financials Pte. Ltd., Grab Holdings Inc., Hoolah Holdings Pte Ltd., Klarna Bank AB, Laybuy Holdings Ltd., Monzo Bank Ltd., One97 Communications Ltd., Pace Now Enterprise Sdn Bhd, PayPal Holdings Inc., Perpay Inc., Revolut Ltd., Social Money Ltd., Visa Inc., Zip Co. Ltd., Rely Pte Ltd, Mastercard Inc., and Flipkart Internet Pvt Ltd |
Market Dynamics | Parent market analysis, market growth inducers and obstacles, fast-growing and slow-growing segment analysis, COVID-19 impact and future consumer dynamics, and market condition analysis for the forecast period. |
Customization purview | If our report has not included the data that you are looking for, you can reach out to our analysts and get segments customized. |
Browse Consumer Discretionary Market Reports
Key Topics Covered
1 Executive Summary
- 1.1 Market overview
- Exhibit 01: Executive Summary – Chart on Market Overview
- Exhibit 02: Executive Summary – Data Table on Market Overview
- Exhibit 03: Executive Summary – Chart on Global Market Characteristics
- Exhibit 04: Executive Summary – Chart on Market by Geography
- Exhibit 05: Executive Summary – Chart on Market Segmentation by Channel
- Exhibit 06: Executive Summary – Chart on Market Segmentation by End-user
- Exhibit 07: Executive Summary – Chart on Incremental Growth
- Exhibit 08: Executive Summary – Data Table on Incremental Growth
- Exhibit 09: Executive Summary – Chart on Vendor Market Positioning
2 Market Landscape
- 2.1 Market ecosystem
- Exhibit 10: Parent market
- Exhibit 11: Market Characteristics
3 Market Sizing
- 3.1 Market definition
- Exhibit 12: Offerings of vendors included in the market definition
- 3.2 Market segment analysis
- Exhibit 13: Market segments
- 3.3 Market size 2021
- 3.4 Market outlook: Forecast for 2021-2026
- Exhibit 14: Chart on Global - Market size and forecast 2021-2026 ($ million)
- Exhibit 15: Data Table on Global - Market size and forecast 2021-2026 ($ million)
- Exhibit 16: Chart on Global Market: Year-over-year growth 2021-2026 (%)
- Exhibit 17: Data Table on Global Market: Year-over-year growth 2021-2026 (%)
4 Five Forces Analysis
- 4.1 Five forces summary
- Exhibit 18: Five forces analysis - Comparison between 2021 and 2026
- 4.2 Bargaining power of buyers
- Exhibit 19: Chart on Bargaining power of buyers – Impact of key factors 2021 and 2026
- 4.3 Bargaining power of suppliers
- Exhibit 20: Bargaining power of suppliers – Impact of key factors in 2021 and 2026
- 4.4 Threat of new entrants
- Exhibit 21: Threat of new entrants – Impact of key factors in 2021 and 2026
- 4.5 Threat of substitutes
- Exhibit 22: Threat of substitutes – Impact of key factors in 2021 and 2026
- 4.6 Threat of rivalry
- Exhibit 23: Threat of rivalry – Impact of key factors in 2021 and 2026
- 4.7 Market condition
- Exhibit 24: Chart on Market condition - Five forces 2021 and 2026
5 Market Segmentation by Channel
- 5.1 Market segments
- Exhibit 25: Chart on Channel - Market share 2021-2026 (%)
- Exhibit 26: Data Table on Channel - Market share 2021-2026 (%)
- 5.2 Comparison by Channel
- Exhibit 27: Chart on Comparison by Channel
- Exhibit 28: Data Table on Comparison by Channel
- 5.3 Online - Market size and forecast 2021-2026
- Exhibit 29: Chart on Online - Market size and forecast 2021-2026 ($ million)
- Exhibit 30: Data Table on Online - Market size and forecast 2021-2026 ($ million)
- Exhibit 31: Chart on Online - Year-over-year growth 2021-2026 (%)
- Exhibit 32: Data Table on Online - Year-over-year growth 2021-2026 (%)
- 5.4 POS - Market size and forecast 2021-2026
- Exhibit 33: Chart on POS - Market size and forecast 2021-2026 ($ million)
- Exhibit 34: Data Table on POS - Market size and forecast 2021-2026 ($ million)
- Exhibit 35: Chart on POS - Year-over-year growth 2021-2026 (%)
- Exhibit 36: Data Table on POS - Year-over-year growth 2021-2026 (%)
- 5.5 Market opportunity by Channel
- Exhibit 37: Market opportunity by Channel ($ million)
6 Market Segmentation by End-user
- 6.1 Market segments
- Exhibit 38: Chart on End-user - Market share 2021-2026 (%)
- Exhibit 39: Data Table on End-user - Market share 2021-2026 (%)
- 6.2 Comparison by End-user
- Exhibit 40: Chart on Comparison by End-user
- Exhibit 41: Data Table on Comparison by End-user
- 6.3 Large enterprise - Market size and forecast 2021-2026
- Exhibit 42: Chart on Large enterprise - Market size and forecast 2021-2026 ($ million)
- Exhibit 43: Data Table on Large enterprise - Market size and forecast 2021-2026 ($ million)
- Exhibit 44: Chart on Large enterprise - Year-over-year growth 2021-2026 (%)
- Exhibit 45: Data Table on Large enterprise - Year-over-year growth 2021-2026 (%)
- 6.4 Small and medium enterprise - Market size and forecast 2021-2026
- Exhibit 46: Chart on Small and medium enterprise - Market size and forecast 2021-2026 ($ million)
- Exhibit 47: Data Table on Small and medium enterprise - Market size and forecast 2021-2026 ($ million)
- Exhibit 48: Chart on Small and medium enterprise - Year-over-year growth 2021-2026 (%)
- Exhibit 49: Data Table on Small and medium enterprise - Year-over-year growth 2021-2026 (%)
- 6.5 Market opportunity by End-user
- Exhibit 50: Market opportunity by End-user ($ million)
7 Customer Landscape
- 7.1 Customer landscape overview
- Exhibit 51: Analysis of price sensitivity, lifecycle, customer purchase basket, adoption rates, and purchase criteria
8 Geographic Landscape
- 8.1 Geographic segmentation
- Exhibit 52: Chart on Market share by geography 2021-2026 (%)
- Exhibit 53: Data Table on Market share by geography 2021-2026 (%)
- 8.2 Geographic comparison
- Exhibit 54: Chart on Geographic comparison
- Exhibit 55: Data Table on Geographic comparison
- 8.3 North America - Market size and forecast 2021-2026
- Exhibit 56: Chart on North America - Market size and forecast 2021-2026 ($ million)
- Exhibit 57: Data Table on North America - Market size and forecast 2021-2026 ($ million)
- Exhibit 58: Chart on North America - Year-over-year growth 2021-2026 (%)
- Exhibit 59: Data Table on North America - Year-over-year growth 2021-2026 (%)
- 8.4 Europe - Market size and forecast 2021-2026
- Exhibit 60: Chart on Europe - Market size and forecast 2021-2026 ($ million)
- Exhibit 61: Data Table on Europe - Market size and forecast 2021-2026 ($ million)
- Exhibit 62: Chart on Europe - Year-over-year growth 2021-2026 (%)
- Exhibit 63: Data Table on Europe - Year-over-year growth 2021-2026 (%)
- 8.5 APAC - Market size and forecast 2021-2026
- Exhibit 64: Chart on APAC - Market size and forecast 2021-2026 ($ million)
- Exhibit 65: Data Table on APAC - Market size and forecast 2021-2026 ($ million)
- Exhibit 66: Chart on APAC - Year-over-year growth 2021-2026 (%)
- Exhibit 67: Data Table on APAC - Year-over-year growth 2021-2026 (%)
- 8.6 South America - Market size and forecast 2021-2026
- Exhibit 68: Chart on South America - Market size and forecast 2021-2026 ($ million)
- Exhibit 69: Data Table on South America - Market size and forecast 2021-2026 ($ million)
- Exhibit 70: Chart on South America - Year-over-year growth 2021-2026 (%)
- Exhibit 71: Data Table on South America - Year-over-year growth 2021-2026 (%)
- 8.7 Middle East and Africa - Market size and forecast 2021-2026
- Exhibit 72: Chart on Middle East and Africa - Market size and forecast 2021-2026 ($ million)
- Exhibit 73: Data Table on Middle East and Africa - Market size and forecast 2021-2026 ($ million)
- Exhibit 74: Chart on Middle East and Africa - Year-over-year growth 2021-2026 (%)
- Exhibit 75: Data Table on Middle East and Africa - Year-over-year growth 2021-2026 (%)
- 8.8 US - Market size and forecast 2021-2026
- Exhibit 76: Chart on US - Market size and forecast 2021-2026 ($ million)
- Exhibit 77: Data Table on US - Market size and forecast 2021-2026 ($ million)
- Exhibit 78: Chart on US - Year-over-year growth 2021-2026 (%)
- Exhibit 79: Data Table on US - Year-over-year growth 2021-2026 (%)
- 8.9 Germany - Market size and forecast 2021-2026
- Exhibit 80: Chart on Germany - Market size and forecast 2021-2026 ($ million)
- Exhibit 81: Data Table on Germany - Market size and forecast 2021-2026 ($ million)
- Exhibit 82: Chart on Germany - Year-over-year growth 2021-2026 (%)
- Exhibit 83: Data Table on Germany - Year-over-year growth 2021-2026 (%)
- 8.10 China - Market size and forecast 2021-2026
- Exhibit 84: Chart on China - Market size and forecast 2021-2026 ($ million)
- Exhibit 85: Data Table on China - Market size and forecast 2021-2026 ($ million)
- Exhibit 86: Chart on China - Year-over-year growth 2021-2026 (%)
- Exhibit 87: Data Table on China - Year-over-year growth 2021-2026 (%)
- 8.11 UK - Market size and forecast 2021-2026
- Exhibit 88: Chart on UK - Market size and forecast 2021-2026 ($ million)
- Exhibit 89: Data Table on UK - Market size and forecast 2021-2026 ($ million)
- Exhibit 90: Chart on UK - Year-over-year growth 2021-2026 (%)
- Exhibit 91: Data Table on UK - Year-over-year growth 2021-2026 (%)
- 8.12 India - Market size and forecast 2021-2026
- Exhibit 92: Chart on India - Market size and forecast 2021-2026 ($ million)
- Exhibit 93: Data Table on India - Market size and forecast 2021-2026 ($ million)
- Exhibit 94: Chart on India - Year-over-year growth 2021-2026 (%)
- Exhibit 95: Data Table on India - Year-over-year growth 2021-2026 (%)
- 8.13 Market opportunity by geography
- Exhibit 96: Market opportunity by geography ($ million)
9 Drivers, Challenges, and Trends
- 9.1 Market drivers
- 9.2 Market challenges
- 9.3 Impact of drivers and challenges
- Exhibit 97: Impact of drivers and challenges in 2021 and 2026
- 9.4 Market trends
10 Vendor Landscape
- 10.1 Overview
- 10.2 Vendor landscape
- Exhibit 98: Overview on Criticality of inputs and Factors of differentiation
- 10.3 Landscape disruption
- Exhibit 99: Overview on factors of disruption
- 10.4 Industry risks
- Exhibit 100: Impact of key risks on business
11 Vendor Analysis
- 11.1 Vendors covered
- Exhibit 101: Vendors covered
- 11.2 Market positioning of vendors
- Exhibit 102: Matrix on vendor position and classification
- 11.3 Affirm Inc.
- Exhibit 103: Affirm Inc. - Overview
- Exhibit 104: Affirm Inc. - Product / Service
- Exhibit 105: Affirm Inc. - Key offerings
- 11.4 Afterpay US Services LLC
- Exhibit 106: Afterpay US Services LLC - Overview
- Exhibit 107: Afterpay US Services LLC - Product / Service
- Exhibit 108: Afterpay US Services LLC - Key offerings
- 11.5 Amazon.com Inc.
- Exhibit 109: Amazon.com Inc. - Overview
- Exhibit 110: Amazon.com Inc. - Business segments
- Exhibit 111: Amazon.com Inc. - Key news
- Exhibit 112: Amazon.com Inc. - Key offerings
- Exhibit 113: Amazon.com Inc. - Segment focus
- 11.6 Klarna Bank AB
- Exhibit 114: Klarna Bank AB - Overview
- Exhibit 115: Klarna Bank AB - Product / Service
- Exhibit 116: Klarna Bank AB - Key offerings
- 11.7 Laybuy Holdings Ltd.
- Exhibit 117: Laybuy Holdings Ltd. - Overview
- Exhibit 118: Laybuy Holdings Ltd. - Product / Service
- Exhibit 119: Laybuy Holdings Ltd. - Key offerings
- 11.8 Mastercard Inc.
- Exhibit 120: Mastercard Inc. - Overview
- Exhibit 121: Mastercard Inc. - Product / Service
- Exhibit 122: Mastercard Inc. - Key news
- Exhibit 123: Mastercard Inc. - Key offerings
- 11.9 Monzo Bank Ltd.
- Exhibit 124: Monzo Bank Ltd. - Overview
- Exhibit 125: Monzo Bank Ltd. - Product / Service
- Exhibit 126: Monzo Bank Ltd. - Key offerings
- 11.10 PayPal Holdings Inc.
- Exhibit 127: PayPal Holdings Inc. - Overview
- Exhibit 128: PayPal Holdings Inc. - Product / Service
- Exhibit 129: PayPal Holdings Inc. - Key offerings
- 11.11 Rely Pte Ltd
- Exhibit 130: Rely Pte Ltd - Overview
- Exhibit 131: Rely Pte Ltd - Product / Service
- Exhibit 132: Rely Pte Ltd - Key offerings
- 11.12 Visa Inc.
- Exhibit 133: Visa Inc. - Overview
- Exhibit 134: Visa Inc. - Product / Service
- Exhibit 135: Visa Inc. - Key offerings
12 Appendix
- 12.1 Scope of the report
- 12.2 Inclusions and exclusions checklist
- Exhibit 136: Inclusions checklist
- Exhibit 137: Exclusions checklist
- 12.3 Currency conversion rates for US$
- Exhibit 138: Currency conversion rates for US$
- 12.4 Research methodology
- Exhibit 139: Research methodology
- Exhibit 140: Validation techniques employed for market sizing
- Exhibit 141: Information sources
- 12.5 List of abbreviations
- Exhibit 142: List of abbreviations
Technavio is a leading global technology research and advisory company. Their research and analysis focus on emerging market trends and provides actionable insights to help businesses identify market opportunities and develop effective strategies to optimize their market positions.
With over 500 specialized analysts, Technavio's report library consists of more than 17,000 reports and counting, covering 800 technologies, spanning across 50 countries. Their client base consists of enterprises of all sizes, including more than 100 Fortune 500 companies. This growing client base relies on Technavio's comprehensive coverage, extensive research, and actionable market insights to identify opportunities in existing and potential markets and assess their competitive positions within changing market scenarios.
Contacts
Technavio Research
Jesse Maida
Media & Marketing Executive
US: +1 844 364 1100
UK: +44 203 893 3200
Email: media@technavio.com
Website: www.technavio.com/


SOURCE Technavio
© 2024 Benzinga.com. Benzinga does not provide investment advice. All rights reserved.
Trade confidently with insights and alerts from analyst ratings, free reports and breaking news that affects the stocks you care about.

