


NEW YORK, Oct. 24, 2022 /PRNewswire/ -- The concrete contractor market is fragmented, and the vendors are deploying organic and inorganic growth strategies to compete in the market. The growing urban population, along with rapid economic and industrial development, has increased the demand for energy-efficient green buildings. The increasing demand for energy is negatively impacting resource availability. This has created a need for energy efficiency in the global construction market, as buildings are some of the major consumers of energy. The competition in the construction market is rising, which will intensify competition in the concrete contractor market during the forecast period.

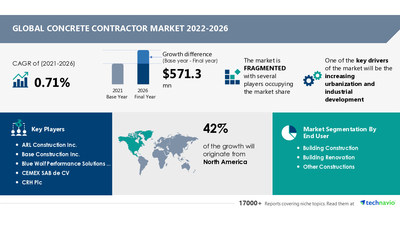
The concrete contractor market size is expected to grow by USD 571.3 million. In addition, the growth momentum of the market will accelerate at a CAGR of 0.71% during the forecast period, according to Technavio.
The report offers an up-to-date analysis regarding the current market scenario, the latest trends and drivers, and the overall market environment. Request Latest FREE PDF Sample Report
- End-user
- Building Construction: The building construction segment will be a significant contributor to market growth during the forecast period. The number of contractors employed in this segment is the highest. Concrete is used in various buildings, bridges, roadways, and others. Such factors are expected to drive segment growth.
- Building Renovation
- Other Constructions
- Geography
- North America: North America is expected to account for 42% of the market's growth during the forecast period. The Government of Canada is working on developing a net-zero-energy-ready building code, which will drive the concrete contractor market's growth in the region during the forecast period. However, market growth in this region will be slower than the growth of the market in APAC and South America. The US and Canada are the key countries for the concrete contractor market in North America.
- Europe
- APAC
- South America
- Middle East And Africa
Learn about the contribution of each segment summarized in concise infographics and thorough descriptions in this report. Buy Now for detailed segment information
The concrete contractor market report covers the following areas:
- Concrete Contractor Market Size
- Concrete Contractor Market Trends
- Concrete Contractor Market Industry Analysis
Subscribe to our "Basic Plan" billed annually at USD 5000 that enables you to download 5 reports and view 100 reports every month
ARL Construction Inc., Base Construction Inc., Blue Wolf Performance Solutions LLC, CEMEX SAB de CV, CRH Plc, CRM Construction Inc., First Davis Corp., Forterra Inc., Four Square Industrial Constructors LLC., HeidelbergCement AG, Holcim Ltd., Shay Murtagh Precast Ltd., Sika AG, Votorantim SA, Weckenmann Anlagentechnik GmbH and Co. KG, and Wells Concrete are among some of the major market participants.
This report provides a full list of key vendors, their strategies, and the latest developments. Request a FREE PDF Sample Now
- CAGR of the market during the forecast period 2022-2026
- Detailed information on factors that will assist concrete contractor market growth during the next five years
- Estimation of the concrete contractor market size and its contribution to the parent market
- Predictions on upcoming trends and changes in consumer behavior
- The growth of the concrete contractor market
- Analysis of the market's competitive landscape and detailed information on vendors
- Comprehensive details of factors that will challenge the growth of concrete contractor market vendors
Glass Fiber Reinforced Concrete (GFRC) Market by Application and Geography - Forecast and Analysis 2022-2026: Reduced construction time and cost are driving the market growth. Reduction in time also results in a reduction of human labor, which leads to cost-saving. Precast uses fewer resources such as cement.
Ready-mix Concrete Market in India by Product and Application - Forecast and Analysis 2022-2026: The high preference for ready-mix concrete is driving the market growth. With the growth of the construction market in India, the use of ready-mix concrete has been increasing. Ready-mix concrete has emerged to become the preferred form of concrete in the construction market.
Concrete Contractor Market Scope | |
Report Coverage | Details |
Page number | 120 |
Base year | 2021 |
Forecast period | 2022-2026 |
Growth momentum & CAGR | Accelerate at a CAGR of 0.71% |
Market growth 2022-2026 | USD 571.3 million |
Market structure | Fragmented |
YoY growth (%) | 0.65 |
Regional analysis | North America, Europe, APAC, South America, and Middle East and Africa |
Performing market contribution | North America at 42% |
Key consumer countries | US, Canada, China, Germany, and UK |
Competitive landscape | Leading companies, competitive strategies, consumer engagement scope |
Companies profiled | ARL Construction Inc., Base Construction Inc., Blue Wolf Performance Solutions LLC, CEMEX SAB de CV, CRH Plc, CRM Construction Inc., First Davis Corp., Forterra Inc., Four Square Industrial Constructors LLC., HeidelbergCement AG, Holcim Ltd., Shay Murtagh Precast Ltd., Sika AG, Votorantim SA, Weckenmann Anlagentechnik GmbH and Co. KG, and Wells Concrete |
Market Dynamics | Parent market analysis, market growth inducers and obstacles, fast-growing and slow-growing segment analysis, COVID-19 impact and future consumer dynamics, and market condition analysis for the forecast period. |
Customization purview | If our report has not included the data that you are looking for, you can reach out to our analysts and get segments customized. |
Browse Materials Market Reports
1 Executive Summary
- 1.1 Market overview
- Exhibit 01: Executive Summary – Chart on Market Overview
- Exhibit 02: Executive Summary – Data Table on Market Overview
- Exhibit 03: Executive Summary – Chart on Global Market Characteristics
- Exhibit 04: Executive Summary – Chart on Market by Geography
- Exhibit 05: Executive Summary – Chart on Market Segmentation by End-user
- Exhibit 06: Executive Summary – Chart on Incremental Growth
- Exhibit 07: Executive Summary – Data Table on Incremental Growth
- Exhibit 08: Executive Summary – Chart on Vendor Market Positioning
2 Market Landscape
- 2.1 Market ecosystem
- Exhibit 09: Parent market
- Exhibit 10: Market Characteristics
3 Market Sizing
- 3.1 Market definition
- Exhibit 11: Offerings of vendors included in the market definition
- 3.2 Market segment analysis
- Exhibit 12: Market segments
- 3.3 Market size 2021
- 3.4 Market outlook: Forecast for 2021-2026
- Exhibit 13: Chart on Global - Market size and forecast 2021-2026 ($ million)
- Exhibit 14: Data Table on Global - Market size and forecast 2021-2026 ($ million)
- Exhibit 15: Chart on Global Market: Year-over-year growth 2021-2026 (%)
- Exhibit 16: Data Table on Global Market: Year-over-year growth 2021-2026 (%)
4 Five Forces Analysis
- 4.1 Five forces summary
- Exhibit 17: Five forces analysis - Comparison between 2021 and 2026
- 4.2 Bargaining power of buyers
- Exhibit 18: Chart on Bargaining power of buyers – Impact of key factors 2021 and 2026
- 4.3 Bargaining power of suppliers
- Exhibit 19: Bargaining power of suppliers – Impact of key factors in 2021 and 2026
- 4.4 Threat of new entrants
- Exhibit 20: Threat of new entrants – Impact of key factors in 2021 and 2026
- 4.5 Threat of substitutes
- Exhibit 21: Threat of substitutes – Impact of key factors in 2021 and 2026
- 4.6 Threat of rivalry
- Exhibit 22: Threat of rivalry – Impact of key factors in 2021 and 2026
- 4.7 Market condition
- Exhibit 23: Chart on Market condition - Five forces 2021 and 2026
5 Market Segmentation by End-user
- 5.1 Market segments
- Exhibit 24: Chart on End-user - Market share 2021-2026 (%)
- Exhibit 25: Data Table on End-user - Market share 2021-2026 (%)
- 5.2 Comparison by End-user
- Exhibit 26: Chart on Comparison by End-user
- Exhibit 27: Data Table on Comparison by End-user
- 5.3 Building Construction - Market size and forecast 2021-2026
- Exhibit 28: Chart on Building Construction - Market size and forecast 2021-2026 ($ million)
- Exhibit 29: Data Table on Building Construction - Market size and forecast 2021-2026 ($ million)
- Exhibit 30: Chart on Building Construction - Year-over-year growth 2021-2026 (%)
- Exhibit 31: Data Table on Building Construction - Year-over-year growth 2021-2026 (%)
- 5.4 Building Renovation - Market size and forecast 2021-2026
- Exhibit 32: Chart on Building Renovation - Market size and forecast 2021-2026 ($ million)
- Exhibit 33: Data Table on Building Renovation - Market size and forecast 2021-2026 ($ million)
- Exhibit 34: Chart on Building Renovation - Year-over-year growth 2021-2026 (%)
- Exhibit 35: Data Table on Building Renovation - Year-over-year growth 2021-2026 (%)
- 5.5 Other Constructions - Market size and forecast 2021-2026
- Exhibit 36: Chart on Other Constructions - Market size and forecast 2021-2026 ($ million)
- Exhibit 37: Data Table on Other Constructions - Market size and forecast 2021-2026 ($ million)
- Exhibit 38: Chart on Other Constructions - Year-over-year growth 2021-2026 (%)
- Exhibit 39: Data Table on Other Constructions - Year-over-year growth 2021-2026 (%)
- 5.6 Market opportunity by End-user
- Exhibit 40: Market opportunity by End-user ($ million)
6 Customer Landscape
- 6.1 Customer landscape overview
- Exhibit 41: Analysis of price sensitivity, lifecycle, customer purchase basket, adoption rates, and purchase criteria
7 Geographic Landscape
- 7.1 Geographic segmentation
- Exhibit 42: Chart on Market share by geography 2021-2026 (%)
- Exhibit 43: Data Table on Market share by geography 2021-2026 (%)
- 7.2 Geographic comparison
- Exhibit 44: Chart on Geographic comparison
- Exhibit 45: Data Table on Geographic comparison
- 7.3 North America - Market size and forecast 2021-2026
- Exhibit 46: Chart on North America - Market size and forecast 2021-2026 ($ million)
- Exhibit 47: Data Table on North America - Market size and forecast 2021-2026 ($ million)
- Exhibit 48: Chart on North America - Year-over-year growth 2021-2026 (%)
- Exhibit 49: Data Table on North America - Year-over-year growth 2021-2026 (%)
- 7.4 Europe - Market size and forecast 2021-2026
- Exhibit 50: Chart on Europe - Market size and forecast 2021-2026 ($ million)
- Exhibit 51: Data Table on Europe - Market size and forecast 2021-2026 ($ million)
- Exhibit 52: Chart on Europe - Year-over-year growth 2021-2026 (%)
- Exhibit 53: Data Table on Europe - Year-over-year growth 2021-2026 (%)
- 7.5 APAC - Market size and forecast 2021-2026
- Exhibit 54: Chart on APAC - Market size and forecast 2021-2026 ($ million)
- Exhibit 55: Data Table on APAC - Market size and forecast 2021-2026 ($ million)
- Exhibit 56: Chart on APAC - Year-over-year growth 2021-2026 (%)
- Exhibit 57: Data Table on APAC - Year-over-year growth 2021-2026 (%)
- 7.6 South America - Market size and forecast 2021-2026
- Exhibit 58: Chart on South America - Market size and forecast 2021-2026 ($ million)
- Exhibit 59: Data Table on South America - Market size and forecast 2021-2026 ($ million)
- Exhibit 60: Chart on South America - Year-over-year growth 2021-2026 (%)
- Exhibit 61: Data Table on South America - Year-over-year growth 2021-2026 (%)
- 7.7 Middle East and Africa - Market size and forecast 2021-2026
- Exhibit 62: Chart on Middle East and Africa - Market size and forecast 2021-2026 ($ million)
- Exhibit 63: Data Table on Middle East and Africa - Market size and forecast 2021-2026 ($ million)
- Exhibit 64: Chart on Middle East and Africa - Year-over-year growth 2021-2026 (%)
- Exhibit 65: Data Table on Middle East and Africa - Year-over-year growth 2021-2026 (%)
- 7.8 US - Market size and forecast 2021-2026
- Exhibit 66: Chart on US - Market size and forecast 2021-2026 ($ million)
- Exhibit 67: Data Table on US - Market size and forecast 2021-2026 ($ million)
- Exhibit 68: Chart on US - Year-over-year growth 2021-2026 (%)
- Exhibit 69: Data Table on US - Year-over-year growth 2021-2026 (%)
- 7.9 China - Market size and forecast 2021-2026
- Exhibit 70: Chart on China - Market size and forecast 2021-2026 ($ million)
- Exhibit 71: Data Table on China - Market size and forecast 2021-2026 ($ million)
- Exhibit 72: Chart on China - Year-over-year growth 2021-2026 (%)
- Exhibit 73: Data Table on China - Year-over-year growth 2021-2026 (%)
- 7.10 Germany - Market size and forecast 2021-2026
- Exhibit 74: Chart on Germany - Market size and forecast 2021-2026 ($ million)
- Exhibit 75: Data Table on Germany - Market size and forecast 2021-2026 ($ million)
- Exhibit 76: Chart on Germany - Year-over-year growth 2021-2026 (%)
- Exhibit 77: Data Table on Germany - Year-over-year growth 2021-2026 (%)
- 7.11 UK - Market size and forecast 2021-2026
- Exhibit 78: Chart on UK - Market size and forecast 2021-2026 ($ million)
- Exhibit 79: Data Table on UK - Market size and forecast 2021-2026 ($ million)
- Exhibit 80: Chart on UK - Year-over-year growth 2021-2026 (%)
- Exhibit 81: Data Table on UK - Year-over-year growth 2021-2026 (%)
- 7.12 Canada - Market size and forecast 2021-2026
- Exhibit 82: Chart on Canada - Market size and forecast 2021-2026 ($ million)
- Exhibit 83: Data Table on Canada - Market size and forecast 2021-2026 ($ million)
- Exhibit 84: Chart on Canada - Year-over-year growth 2021-2026 (%)
- Exhibit 85: Data Table on Canada - Year-over-year growth 2021-2026 (%)
- 7.13 Market opportunity by geography
- Exhibit 86: Market opportunity by geography ($ million)
8 Drivers, Challenges, and Trends
- 8.1 Market drivers
- 8.2 Market challenges
- 8.3 Impact of drivers and challenges
- Exhibit 87: Impact of drivers and challenges in 2021 and 2026
- 8.4 Market trends
9 Vendor Landscape
- 9.1 Overview
- 9.2 Vendor landscape
- Exhibit 88: Overview on Criticality of inputs and Factors of differentiation
- 9.3 Landscape disruption
- Exhibit 89: Overview on factors of disruption
- 9.4 Industry risks
- Exhibit 90: Impact of key risks on business
10 Vendor Analysis
- 10.1 Vendors covered
- Exhibit 91: Vendors covered
- 10.2 Market positioning of vendors
- Exhibit 92: Matrix on vendor position and classification
- 10.3 ARL Construction Inc.
- Exhibit 93: ARL Construction Inc. - Overview
- Exhibit 94: ARL Construction Inc. - Product / Service
- Exhibit 95: ARL Construction Inc. - Key offerings
- 10.4 Base Construction Inc.
- Exhibit 96: Base Construction Inc. - Overview
- Exhibit 97: Base Construction Inc. - Product / Service
- Exhibit 98: Base Construction Inc. - Key offerings
- 10.5 Blue Wolf Performance Solutions LLC
- Exhibit 99: Blue Wolf Performance Solutions LLC - Overview
- Exhibit 100: Blue Wolf Performance Solutions LLC - Product / Service
- Exhibit 101: Blue Wolf Performance Solutions LLC - Key offerings
- 10.6 CEMEX SAB de CV
- Exhibit 102: CEMEX SAB de CV - Overview
- Exhibit 103: CEMEX SAB de CV - Business segments
- Exhibit 104: CEMEX SAB de CV - Key news
- Exhibit 105: CEMEX SAB de CV - Key offerings
- Exhibit 106: CEMEX SAB de CV - Segment focus
- 10.7 CRM Construction Inc.
- Exhibit 107: CRM Construction Inc. - Overview
- Exhibit 108: CRM Construction Inc. - Product / Service
- Exhibit 109: CRM Construction Inc. - Key offerings
- 10.8 First Davis Corp.
- Exhibit 110: First Davis Corp. - Overview
- Exhibit 111: First Davis Corp. - Product / Service
- Exhibit 112: First Davis Corp. - Key offerings
- 10.9 Forterra Inc.
- Exhibit 113: Forterra Inc. - Overview
- Exhibit 114: Forterra Inc. - Business segments
- Exhibit 115: Forterra Inc. - Key offerings
- Exhibit 116: Forterra Inc. - Segment focus
- 10.10 Four Square Industrial Constructors LLC.
- Exhibit 117: Four Square Industrial Constructors LLC. - Overview
- Exhibit 118: Four Square Industrial Constructors LLC. - Product / Service
- Exhibit 119: Four Square Industrial Constructors LLC. - Key offerings
- 10.11 HeidelbergCement AG
- Exhibit 120: HeidelbergCement AG - Overview
- Exhibit 121: HeidelbergCement AG - Business segments
- Exhibit 122: HeidelbergCement AG - Key news
- Exhibit 123: HeidelbergCement AG - Key offerings
- Exhibit 124: HeidelbergCement AG - Segment focus
- 10.12 Sika AG
- Exhibit 125: Sika AG - Overview
- Exhibit 126: Sika AG - Business segments
- Exhibit 127: Sika AG - Key news
- Exhibit 128: Sika AG - Key offerings
- Exhibit 129: Sika AG - Segment focus
11 Appendix
- 11.1 Scope of the report
- 11.2 Inclusions and exclusions checklist
- Exhibit 130: Inclusions checklist
- Exhibit 131: Exclusions checklist
- 11.3 Currency conversion rates for US$
- Exhibit 132: Currency conversion rates for US$
- 11.4 Research methodology
- Exhibit 133: Research methodology
- Exhibit 134: Validation techniques employed for market sizing
- Exhibit 135: Information sources
- 11.5 List of abbreviations
- Exhibit 136: List of abbreviations
Technavio is a leading global technology research and advisory company. Their research and analysis focus on emerging market trends and provide actionable insights to help businesses identify market opportunities and develop effective strategies to optimize their market positions. With over 500 specialized analysts, Technavio's report library consists of more than 17,000 reports and counting, covering 800 technologies, spanning across 50 countries. Their client base consists of enterprises of all sizes, including more than 100 Fortune 500 companies. This growing client base relies on Technavio's comprehensive coverage, extensive research, and actionable market insights to identify opportunities in existing and potential markets and assess their competitive positions within changing market scenarios.
Contact
Technavio Research
Jesse Maida
Media & Marketing Executive
US: +1 844 364 1100
UK: +44 203 893 3200
Email: media@technavio.com
Website: www.technavio.com/


SOURCE Technavio
© 2024 Benzinga.com. Benzinga does not provide investment advice. All rights reserved.
Trade confidently with insights and alerts from analyst ratings, free reports and breaking news that affects the stocks you care about.

