


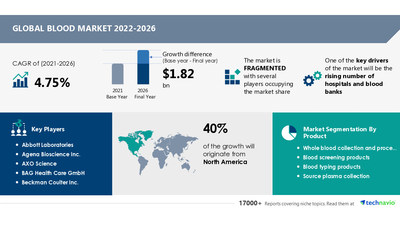
NEW YORK, Oct. 10, 2022 /PRNewswire/ -- The "Blood Market by Product and Geography - Forecast and Analysis 2022-2026" report has been added to Technavio's offerings. The market size is set to grow by USD 1.82 billion between 2021 and 2026. In addition, the growth momentum of the market will accelerate at a CAGR of 4.75% during the forecast period, according to Technavio's latest market report estimates.

This report offers an up-to-date analysis regarding the latest trends and drivers, the current market scenario, and the overall market environment. Read our FREE PDF Sample Report
Blood Market 2022-2026:Vendor Analysis and Scope
To help businesses improve their market position, Technavio's report provides a detailed analysis of around 25 vendors operating in the market. AXO Science, BAG Health Care GmbH, Beckman Coulter Inc., Becton Dickinson and Co., Bio Rad Laboratories Inc., Cardinal Health Inc, CSL Ltd., DIAGAST SAS, F. Hoffmann La Roche Ltd., Haemonetics Corp., Grifols SA, Medtronic Plc, Immucor Inc., Ortho Clinical Diagnostics plc, Nipro Medical Corp., Terumo Corp., Rapid Labs Ltd., and Merck KGaA.
The report also covers the following areas:
Get lifetime access to our Technavio Insights. Subscribe now to our most popular "Basic Plan" billed annually at USD 5000. View 100 reports monthly and download 5 reports per month!
Blood Market 2022-2026: Segmentation
- Product
- Whole Blood Collection and Processing: The whole blood collection and processing segment will be the largest contributor to market growth during the forecast period. During the manufacturing of blood bags, standardized collection methods are used to prevent any twists or breakages and ensure free flow during blood collection and separation. These bags help expand the storage of red blood cells and lower the viscosity of packed red blood cells, which maximizes harvesting of plasma. The whole blood collection and processing segment will be driven by these advantages during the forecast period.
- Blood Screening Products
- Blood Typing Products
- Source Plasma Collection
- Geography
- North America: North America will account for 40% of the market's growth during the forecast period. This growth is attributed to factors such as the rising number of sports injuries and road accidents. Moreover, the US and Canada are the key countries for the blood market in North America. Market growth in this region will be slower than the growth of the market in Asia.
- Asia
- Europe
- Rest Of World (ROW)
Learn about the contribution of each segment summarized in concise infographics and thorough descriptions. View a FREE PDF Sample Report
Blood Market 2022-2026: Key Highlights
- CAGR of the market during the forecast period of 2022 to 2026
- Detailed information on factors that will assist blood market growth during the next five years
- Estimation of the blood market size and its contribution to the parent market
- Forecasts on upcoming trends and changes in consumer behavior
- The growth of the blood market
- Analysis of the competitive landscape of the market and detailed information on vendors
- Comprehensive details of factors that will challenge the growth of blood market vendors during the forecast period
Related Reports
Venous Blood Collection Market by Application and Geography - Forecast and Analysis 2022-2026: The venous blood collection market size is expected to increase by USD 868.11 million from 2021 to 2026.
Stem Cell Umbilical Cord Blood (UCB) Market by End-user and Geography - Forecast and Analysis 2022-2026: The stem cell umbilical cord blood (UCB) market share is expected to increase by USD 1.47 billion from 2021 to 2026.
Blood Market Scope | |
Report Coverage | Details |
Page number | 120 |
Base year | 2021 |
Forecast period | 2022-2026 |
Growth momentum & CAGR | Accelerate at a CAGR of 4.75% |
Market growth 2022-2026 | USD 1.82 billion |
Market structure | Fragmented |
YoY growth (%) | 3.67 |
Regional analysis | North America, Asia, Europe, and Rest of World (ROW) |
Performing market contribution | North America at 40% |
Key consumer countries | US, Canada, Germany, China, and Japan |
Competitive landscape | Leading companies, competitive strategies, consumer engagement scope |
Companies profiled | Abbott Laboratories, Agena Bioscience Inc., AXO Science, BAG Health Care GmbH, Beckman Coulter Inc., Becton Dickinson and Co., Bio Rad Laboratories Inc., Cardinal Health Inc, CSL Ltd., DIAGAST SAS, F. Hoffmann La Roche Ltd., Grifols SA, Haemonetics Corp., Immucor Inc., Medtronic Plc, Nipro Medical Corp., Ortho Clinical Diagnostics plc, Rapid Labs Ltd., Terumo Corp., and Merck KGaA |
Market Dynamics | Parent market analysis, market growth inducers and obstacles, fast-growing and slow-growing segment analysis, COVID-19 impact and future consumer dynamics, and market condition analysis for the forecast period. |
Customization purview | If our report has not included the data that you are looking for, you can reach out to our analysts and get segments customized. |
Browse Health Care Market Reports
Table of Contents
1 Executive Summary
- 1.1 Market overview
- Exhibit 01: Executive Summary – Chart on Market Overview
- Exhibit 02: Executive Summary – Data Table on Market Overview
- Exhibit 03: Executive Summary – Chart on Global Market Characteristics
- Exhibit 04: Executive Summary – Chart on Market by Geography
- Exhibit 05: Executive Summary – Chart on Market Segmentation by Product
- Exhibit 06: Executive Summary – Chart on Incremental Growth
- Exhibit 07: Executive Summary – Data Table on Incremental Growth
- Exhibit 08: Executive Summary – Chart on Vendor Market Positioning
2 Market Landscape
- 2.1 Market ecosystem
- Exhibit 09: Parent market
- Exhibit 10: Market Characteristics
3 Market Sizing
- 3.1 Market definition
- Exhibit 11: Offerings of vendors included in the market definition
- 3.2 Market segment analysis
- Exhibit 12: Market segments
- 3.3 Market size 2021
- 3.4 Market outlook: Forecast for 2021-2026
- Exhibit 13: Chart on Global - Market size and forecast 2021-2026 ($ million)
- Exhibit 14: Data Table on Global - Market size and forecast 2021-2026 ($ million)
- Exhibit 15: Chart on Global Market: Year-over-year growth 2021-2026 (%)
- Exhibit 16: Data Table on Global Market: Year-over-year growth 2021-2026 (%)
4 Five Forces Analysis
- 4.1 Five forces summary
- Exhibit 17: Five forces analysis - Comparison between 2021 and 2026
- 4.2 Bargaining power of buyers
- Exhibit 18: Chart on Bargaining power of buyers – Impact of key factors 2021 and 2026
- 4.3 Bargaining power of suppliers
- Exhibit 19: Bargaining power of suppliers – Impact of key factors in 2021 and 2026
- 4.4 Threat of new entrants
- Exhibit 20: Threat of new entrants – Impact of key factors in 2021 and 2026
- 4.5 Threat of substitutes
- Exhibit 21: Threat of substitutes – Impact of key factors in 2021 and 2026
- 4.6 Threat of rivalry
- Exhibit 22: Threat of rivalry – Impact of key factors in 2021 and 2026
- 4.7 Market condition
- Exhibit 23: Chart on Market condition - Five forces 2021 and 2026
5 Market Segmentation by Product
- 5.1 Market segments
- Exhibit 24: Chart on Product - Market share 2021-2026 (%)
- Exhibit 25: Data Table on Product - Market share 2021-2026 (%)
- 5.2 Comparison by Product
- Exhibit 26: Chart on Comparison by Product
- Exhibit 27: Data Table on Comparison by Product
- 5.3 Whole blood collection and processing - Market size and forecast 2021-2026
- Exhibit 28: Chart on Whole blood collection and processing - Market size and forecast 2021-2026 ($ million)
- Exhibit 29: Data Table on Whole blood collection and processing - Market size and forecast 2021-2026 ($ million)
- Exhibit 30: Chart on Whole blood collection and processing - Year-over-year growth 2021-2026 (%)
- Exhibit 31: Data Table on Whole blood collection and processing - Year-over-year growth 2021-2026 (%)
- 5.4 Blood screening products - Market size and forecast 2021-2026
- Exhibit 32: Chart on Blood screening products - Market size and forecast 2021-2026 ($ million)
- Exhibit 33: Data Table on Blood screening products - Market size and forecast 2021-2026 ($ million)
- Exhibit 34: Chart on Blood screening products - Year-over-year growth 2021-2026 (%)
- Exhibit 35: Data Table on Blood screening products - Year-over-year growth 2021-2026 (%)
- 5.5 Blood typing products - Market size and forecast 2021-2026
- Exhibit 36: Chart on Blood typing products - Market size and forecast 2021-2026 ($ million)
- Exhibit 37: Data Table on Blood typing products - Market size and forecast 2021-2026 ($ million)
- Exhibit 38: Chart on Blood typing products - Year-over-year growth 2021-2026 (%)
- Exhibit 39: Data Table on Blood typing products - Year-over-year growth 2021-2026 (%)
- 5.6 Source plasma collection - Market size and forecast 2021-2026
- Exhibit 40: Chart on Source plasma collection - Market size and forecast 2021-2026 ($ million)
- Exhibit 41: Data Table on Source plasma collection - Market size and forecast 2021-2026 ($ million)
- Exhibit 42: Chart on Source plasma collection - Year-over-year growth 2021-2026 (%)
- Exhibit 43: Data Table on Source plasma collection - Year-over-year growth 2021-2026 (%)
- 5.7 Market opportunity by Product
- Exhibit 44: Market opportunity by Product ($ million)
6 Customer Landscape
- 6.1 Customer landscape overview
- Exhibit 45: Analysis of price sensitivity, lifecycle, customer purchase basket, adoption rates, and purchase criteria
7 Geographic Landscape
- 7.1 Geographic segmentation
- Exhibit 46: Chart on Market share by geography 2021-2026 (%)
- Exhibit 47: Data Table on Market share by geography 2021-2026 (%)
- 7.2 Geographic comparison
- Exhibit 48: Chart on Geographic comparison
- Exhibit 49: Data Table on Geographic comparison
- 7.3 North America - Market size and forecast 2021-2026
- Exhibit 50: Chart on North America - Market size and forecast 2021-2026 ($ million)
- Exhibit 51: Data Table on North America - Market size and forecast 2021-2026 ($ million)
- Exhibit 52: Chart on North America - Year-over-year growth 2021-2026 (%)
- Exhibit 53: Data Table on North America - Year-over-year growth 2021-2026 (%)
- 7.4 Asia - Market size and forecast 2021-2026
- Exhibit 54: Chart on Asia - Market size and forecast 2021-2026 ($ million)
- Exhibit 55: Data Table on Asia - Market size and forecast 2021-2026 ($ million)
- Exhibit 56: Chart on Asia - Year-over-year growth 2021-2026 (%)
- Exhibit 57: Data Table on Asia - Year-over-year growth 2021-2026 (%)
- 7.5 Europe - Market size and forecast 2021-2026
- Exhibit 58: Chart on Europe - Market size and forecast 2021-2026 ($ million)
- Exhibit 59: Data Table on Europe - Market size and forecast 2021-2026 ($ million)
- Exhibit 60: Chart on Europe - Year-over-year growth 2021-2026 (%)
- Exhibit 61: Data Table on Europe - Year-over-year growth 2021-2026 (%)
- 7.6 Rest of World (ROW) - Market size and forecast 2021-2026
- Exhibit 62: Chart on Rest of World (ROW) - Market size and forecast 2021-2026 ($ million)
- Exhibit 63: Data Table on Rest of World (ROW) - Market size and forecast 2021-2026 ($ million)
- Exhibit 64: Chart on Rest of World (ROW) - Year-over-year growth 2021-2026 (%)
- Exhibit 65: Data Table on Rest of World (ROW) - Year-over-year growth 2021-2026 (%)
- 7.7 US - Market size and forecast 2021-2026
- Exhibit 66: Chart on US - Market size and forecast 2021-2026 ($ million)
- Exhibit 67: Data Table on US - Market size and forecast 2021-2026 ($ million)
- Exhibit 68: Chart on US - Year-over-year growth 2021-2026 (%)
- Exhibit 69: Data Table on US - Year-over-year growth 2021-2026 (%)
- 7.8 China - Market size and forecast 2021-2026
- Exhibit 70: Chart on China - Market size and forecast 2021-2026 ($ million)
- Exhibit 71: Data Table on China - Market size and forecast 2021-2026 ($ million)
- Exhibit 72: Chart on China - Year-over-year growth 2021-2026 (%)
- Exhibit 73: Data Table on China - Year-over-year growth 2021-2026 (%)
- 7.9 Japan - Market size and forecast 2021-2026
- Exhibit 74: Chart on Japan - Market size and forecast 2021-2026 ($ million)
- Exhibit 75: Data Table on Japan - Market size and forecast 2021-2026 ($ million)
- Exhibit 76: Chart on Japan - Year-over-year growth 2021-2026 (%)
- Exhibit 77: Data Table on Japan - Year-over-year growth 2021-2026 (%)
- 7.10 Germany - Market size and forecast 2021-2026
- Exhibit 78: Chart on Germany - Market size and forecast 2021-2026 ($ million)
- Exhibit 79: Data Table on Germany - Market size and forecast 2021-2026 ($ million)
- Exhibit 80: Chart on Germany - Year-over-year growth 2021-2026 (%)
- Exhibit 81: Data Table on Germany - Year-over-year growth 2021-2026 (%)
- 7.11 Canada - Market size and forecast 2021-2026
- Exhibit 82: Chart on Canada - Market size and forecast 2021-2026 ($ million)
- Exhibit 83: Data Table on Canada - Market size and forecast 2021-2026 ($ million)
- Exhibit 84: Chart on Canada - Year-over-year growth 2021-2026 (%)
- Exhibit 85: Data Table on Canada - Year-over-year growth 2021-2026 (%)
- 7.12 Market opportunity by geography
- Exhibit 86: Market opportunity by geography ($ million)
8 Drivers, Challenges, and Trends
- 8.1 Market drivers
- 8.2 Market challenges
- 8.3 Impact of drivers and challenges
- Exhibit 87: Impact of drivers and challenges in 2021 and 2026
- 8.4 Market trends
9 Vendor Landscape
- 9.1 Overview
- 9.2 Vendor landscape
- Exhibit 88: Overview on Criticality of inputs and Factors of differentiation
- 9.3 Landscape disruption
- Exhibit 89: Overview on factors of disruption
- 9.4 Industry risks
- Exhibit 90: Impact of key risks on business
10 Vendor Analysis
- 10.1 Vendors covered
- Exhibit 91: Vendors covered
- 10.2 Market positioning of vendors
- Exhibit 92: Matrix on vendor position and classification
- 10.3 Abbott Laboratories
- Exhibit 93: Abbott Laboratories - Overview
- Exhibit 94: Abbott Laboratories - Business segments
- Exhibit 95: Abbott Laboratories - Key news
- Exhibit 96: Abbott Laboratories - Key offerings
- Exhibit 97: Abbott Laboratories - Segment focus
- 10.4 Becton Dickinson and Co.
- Exhibit 98: Becton Dickinson and Co. - Overview
- Exhibit 99: Becton Dickinson and Co. - Business segments
- Exhibit 100: Becton Dickinson and Co. - Key news
- Exhibit 101: Becton Dickinson and Co. - Key offerings
- Exhibit 102: Becton Dickinson and Co. - Segment focus
- 10.5 Bio Rad Laboratories Inc.
- Exhibit 103: Bio Rad Laboratories Inc. - Overview
- Exhibit 104: Bio Rad Laboratories Inc. - Business segments
- Exhibit 105: Bio Rad Laboratories Inc. - Key news
- Exhibit 106: Bio Rad Laboratories Inc. - Key offerings
- Exhibit 107: Bio Rad Laboratories Inc. - Segment focus
- 10.6 CSL Ltd.
- Exhibit 108: CSL Ltd. - Overview
- Exhibit 109: CSL Ltd. - Business segments
- Exhibit 110: CSL Ltd. - Key news
- Exhibit 111: CSL Ltd. - Key offerings
- Exhibit 112: CSL Ltd. - Segment focus
- 10.7 F. Hoffmann La Roche Ltd.
- Exhibit 113: F. Hoffmann La Roche Ltd. - Overview
- Exhibit 114: F. Hoffmann La Roche Ltd. - Business segments
- Exhibit 115: F. Hoffmann La Roche Ltd. - Key news
- Exhibit 116: F. Hoffmann La Roche Ltd. - Key offerings
- Exhibit 117: F. Hoffmann La Roche Ltd. - Segment focus
- 10.8 Grifols SA
- Exhibit 118: Grifols SA - Overview
- Exhibit 119: Grifols SA - Business segments
- Exhibit 120: Grifols SA - Key offerings
- Exhibit 121: Grifols SA - Segment focus
- 10.9 Haemonetics Corp.
- Exhibit 122: Haemonetics Corp. - Overview
- Exhibit 123: Haemonetics Corp. - Business segments
- Exhibit 124: Haemonetics Corp. - Key offerings
- Exhibit 125: Haemonetics Corp. - Segment focus
- 10.10 Medtronic Plc
- Exhibit 126: Medtronic Plc - Overview
- Exhibit 127: Medtronic Plc - Business segments
- Exhibit 128: Medtronic Plc - Key news
- Exhibit 129: Medtronic Plc - Key offerings
- Exhibit 130: Medtronic Plc - Segment focus
- 10.11 Ortho Clinical Diagnostics plc
- Exhibit 131: Ortho Clinical Diagnostics plc - Overview
- Exhibit 132: Ortho Clinical Diagnostics plc - Business segments
- Exhibit 133: Ortho Clinical Diagnostics plc - Key offerings
- Exhibit 134: Ortho Clinical Diagnostics plc - Segment focus
- 10.12 Terumo Corp.
- Exhibit 135: Terumo Corp. - Overview
- Exhibit 136: Terumo Corp. - Business segments
- Exhibit 137: Terumo Corp. - Key news
- Exhibit 138: Terumo Corp. - Key offerings
- Exhibit 139: Terumo Corp. - Segment focus
11 Appendix
- 11.1 Scope of the report
- 11.2 Inclusions and exclusions checklist
- Exhibit 140: Inclusions checklist
- Exhibit 141: Exclusions checklist
- 11.3 Currency conversion rates for US$
- Exhibit 142: Currency conversion rates for US$
- 11.4 Research methodology
- Exhibit 143: Research methodology
- Exhibit 144: Validation techniques employed for market sizing
- Exhibit 145: Information sources
- 11.5 List of abbreviations
- Exhibit 146: List of abbreviations
Technavio is a leading global technology research and advisory company. Their research and analysis focus on emerging market trends and provides actionable insights to help businesses identify market opportunities and develop effective strategies to optimize their market positions. With over 500 specialized analysts, Technavio's report library consists of more than 17,000 reports and counting, covering 800 technologies, spanning across 50 countries. Their client base consists of enterprises of all sizes, including more than 100 Fortune 500 companies. This growing client base relies on Technavio's comprehensive coverage, extensive research, and actionable market insights to identify opportunities in existing and potential markets and assess their competitive positions within changing market scenarios.
Contact
Technavio Research
Jesse Maida
Media & Marketing Executive
US: +1 844 364 1100
UK: +44 203 893 3200
Email: media@technavio.com
Website: www.technavio.com/


SOURCE Technavio
© 2024 Benzinga.com. Benzinga does not provide investment advice. All rights reserved.
Trade confidently with insights and alerts from analyst ratings, free reports and breaking news that affects the stocks you care about.

