


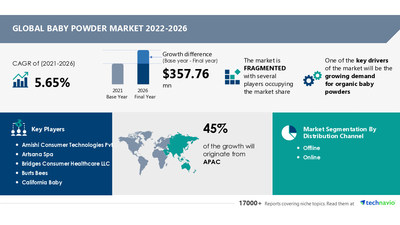
NEW YORK, Oct. 4, 2022 /PRNewswire/ -- The baby powder market has been segmented by distribution channel (offline and online) and geography (APAC, Europe, North America, South America, and the Middle East and Africa). APAC will account for 45% of the market's growth during the forecast period. This growth is attributed to factors such as increasing disposable income, customer awareness, and a declining child mortality rate. Moreover, market growth in this region will be faster than the growth of the market in other regions. China, India, and Japan are the key countries for the baby powder market in APAC.

Learn about the contribution of each region summarized in concise infographics and thorough descriptions. View a FREE PDF Sample Report
The baby powder market size is expected to grow by USD 357.76 million from 2021 to 2026. In addition, the growth momentum of the market will accelerate at a CAGR of 5.65% during the forecast period, according to Technavio.
Market Dynamics
The growing demand for organic baby powders is driving the baby powder market growth. Organic baby powders have natural ingredients and a negligible amount of synthetic additives, perfume, colors, and artificial preservatives. Moreover, there is transparency about the ingredients used in organic baby powders, which enhances the trust of consumers and encourages the use of these products. Therefore, the demand for organic baby powders is expected to grow significantly during the forecast period.
The growing preference for DIY baby powder at home is challenging the baby powder market growth. Homemade baby powders have no side effects on the baby's skin or health. They include natural ingredients, such as corn starch, baking soda, and arrowroot powder. These powders can be stored at room temperature. They can be stored for longer periods without undergoing degradation in the quality of ingredients. Therefore, the growing preference for DIY baby powders made at home is expected to hamper the growth of the baby powder market during the forecast period.
Technavio has identified key trends, drivers, and challenges in the market, which will help vendors improve their strategies to stay ahead of their competitors. View our FREE PDF Sample Report
Company Profiles
The baby powder market report includes information on the product launches, sustainability, and prospects of leading vendors, including Amishi Consumer Technologies Pvt. Ltd., Artsana Spa, Bridges Consumer Healthcare LLC, Burts Bees, California Baby, Church and Dwight Co. Inc, CITTA, earthBaby, FREZYDERM SA, GAIA Skin Naturals, Himalaya Global Holdings Ltd., Honasa Consumer Pvt. Ltd., Johnson and Johnson, Lotus Herbals Pvt. Ltd., Mother Sparsh, Mountain Valley Springs India Pvt. Ltd., Natures Baby Organics, Prestige Consumer Healthcare Inc., Sebapharma GmbH and Co. KG, and Simply Pure Products.
This report provides a full list of key vendors, their strategies, and latest developments. Request a FREE PDF Sample Now
Competitive Analysis
The report includes competitive analysis, which is a proprietary tool to analyze and evaluate the position of companies based on their industry position and market performance scores. The tool uses various factors for classifying the players into four categories. Some of these factors considered for analysis are growth strategies, financial performance over the last three years, innovation score, investments, new product launches, and growth in market share.
Related Reports
Breastmilk Storage Bags and Bottles Market by Product, End-user, Distribution Channel, and Geography - Forecast and Analysis 2022-2026: The baby powder market size is expected to increase by USD 357.76 million from 2021 to 2026.
Baby Toiletries Market by Distribution Channel and Geography - Forecast and Analysis 2022-2026: The baby toiletries market size is expected to increase by USD 8.22 billion from 2021 to 2026.
Baby Powder Market Scope | |
Report Coverage | Details |
Page number | 120 |
Base year | 2021 |
Forecast period | 2022-2026 |
Growth momentum & CAGR | Accelerate at a CAGR of 5.65% |
Market growth 2022-2026 | USD 357.76 million |
Market structure | Fragmented |
YoY growth (%) | 5.17 |
Regional analysis | APAC, Europe, North America, South America, and Middle East and Africa |
Performing market contribution | APAC at 45% |
Key consumer countries | US, China, India, Japan, and UK |
Competitive landscape | Leading companies, competitive strategies, consumer engagement scope |
Companies profiled | Amishi Consumer Technologies Pvt. Ltd., Artsana Spa, Bridges Consumer Healthcare LLC, Burts Bees, California Baby, Church and Dwight Co. Inc, CITTA, earthBaby, FREZYDERM SA, GAIA Skin Naturals, Himalaya Global Holdings Ltd., Honasa Consumer Pvt. Ltd., Johnson and Johnson, Lotus Herbals Pvt. Ltd., Mother Sparsh, Mountain Valley Springs India Pvt. Ltd., Natures Baby Organics, Prestige Consumer Healthcare Inc., Sebapharma GmbH and Co. KG, and Simply Pure Products |
Market Dynamics | Parent market analysis, market growth inducers and obstacles, fast-growing and slow-growing segment analysis, COVID-19 impact and future consumer dynamics, and market condition analysis for the forecast period. |
Customization purview | If our report has not included the data that you are looking for, you can reach out to our analysts and get segments customized. |
Browse Consumer Staples Market Reports
Table of Contents
1 Executive Summary
- 1.1 Market overview
- Exhibit 01: Executive Summary – Chart on Market Overview
- Exhibit 02: Executive Summary – Data Table on Market Overview
- Exhibit 03: Executive Summary – Chart on Global Market Characteristics
- Exhibit 04: Executive Summary – Chart on Market by Geography
- Exhibit 05: Executive Summary – Chart on Market Segmentation by Distribution Channel
- Exhibit 06: Executive Summary – Chart on Incremental Growth
- Exhibit 07: Executive Summary – Data Table on Incremental Growth
- Exhibit 08: Executive Summary – Chart on Vendor Market Positioning
2 Market Landscape
- 2.1 Market ecosystem
- Exhibit 09: Parent market
- Exhibit 10: Market Characteristics
3 Market Sizing
- 3.1 Market definition
- Exhibit 11: Offerings of vendors included in the market definition
- 3.2 Market segment analysis
- Exhibit 12: Market segments
- 3.3 Market size 2021
- 3.4 Market outlook: Forecast for 2021-2026
- Exhibit 13: Chart on Global - Market size and forecast 2021-2026 ($ million)
- Exhibit 14: Data Table on Global - Market size and forecast 2021-2026 ($ million)
- Exhibit 15: Chart on Global Market: Year-over-year growth 2021-2026 (%)
- Exhibit 16: Data Table on Global Market: Year-over-year growth 2021-2026 (%)
4 Five Forces Analysis
- 4.1 Five forces summary
- Exhibit 17: Five forces analysis - Comparison between 2021 and 2026
- 4.2 Bargaining power of buyers
- Exhibit 18: Chart on Bargaining power of buyers – Impact of key factors 2021 and 2026
- 4.3 Bargaining power of suppliers
- Exhibit 19: Bargaining power of suppliers – Impact of key factors in 2021 and 2026
- 4.4 Threat of new entrants
- Exhibit 20: Threat of new entrants – Impact of key factors in 2021 and 2026
- 4.5 Threat of substitutes
- Exhibit 21: Threat of substitutes – Impact of key factors in 2021 and 2026
- 4.6 Threat of rivalry
- Exhibit 22: Threat of rivalry – Impact of key factors in 2021 and 2026
- 4.7 Market condition
- Exhibit 23: Chart on Market condition - Five forces 2021 and 2026
5 Market Segmentation by Distribution Channel
- 5.1 Market segments
- Exhibit 24: Chart on Distribution Channel - Market share 2021-2026 (%)
- Exhibit 25: Data Table on Distribution Channel - Market share 2021-2026 (%)
- 5.2 Comparison by Distribution Channel
- Exhibit 26: Chart on Comparison by Distribution Channel
- Exhibit 27: Data Table on Comparison by Distribution Channel
- 5.3 Offline - Market size and forecast 2021-2026
- Exhibit 28: Chart on Offline - Market size and forecast 2021-2026 ($ million)
- Exhibit 29: Data Table on Offline - Market size and forecast 2021-2026 ($ million)
- Exhibit 30: Chart on Offline - Year-over-year growth 2021-2026 (%)
- Exhibit 31: Data Table on Offline - Year-over-year growth 2021-2026 (%)
- 5.4 Online - Market size and forecast 2021-2026
- Exhibit 32: Chart on Online - Market size and forecast 2021-2026 ($ million)
- Exhibit 33: Data Table on Online - Market size and forecast 2021-2026 ($ million)
- Exhibit 34: Chart on Online - Year-over-year growth 2021-2026 (%)
- Exhibit 35: Data Table on Online - Year-over-year growth 2021-2026 (%)
- 5.5 Market opportunity by Distribution Channel
- Exhibit 36: Market opportunity by Distribution Channel ($ million)
6 Customer Landscape
- 6.1 Customer landscape overview
- Exhibit 37: Analysis of price sensitivity, lifecycle, customer purchase basket, adoption rates, and purchase criteria
7 Geographic Landscape
- 7.1 Geographic segmentation
- Exhibit 38: Chart on Market share by geography 2021-2026 (%)
- Exhibit 39: Data Table on Market share by geography 2021-2026 (%)
- 7.2 Geographic comparison
- Exhibit 40: Chart on Geographic comparison
- Exhibit 41: Data Table on Geographic comparison
- 7.3 APAC - Market size and forecast 2021-2026
- Exhibit 42: Chart on APAC - Market size and forecast 2021-2026 ($ million)
- Exhibit 43: Data Table on APAC - Market size and forecast 2021-2026 ($ million)
- Exhibit 44: Chart on APAC - Year-over-year growth 2021-2026 (%)
- Exhibit 45: Data Table on APAC - Year-over-year growth 2021-2026 (%)
- 7.4 Europe - Market size and forecast 2021-2026
- Exhibit 46: Chart on Europe - Market size and forecast 2021-2026 ($ million)
- Exhibit 47: Data Table on Europe - Market size and forecast 2021-2026 ($ million)
- Exhibit 48: Chart on Europe - Year-over-year growth 2021-2026 (%)
- Exhibit 49: Data Table on Europe - Year-over-year growth 2021-2026 (%)
- 7.5 North America - Market size and forecast 2021-2026
- Exhibit 50: Chart on North America - Market size and forecast 2021-2026 ($ million)
- Exhibit 51: Data Table on North America - Market size and forecast 2021-2026 ($ million)
- Exhibit 52: Chart on North America - Year-over-year growth 2021-2026 (%)
- Exhibit 53: Data Table on North America - Year-over-year growth 2021-2026 (%)
- 7.6 South America - Market size and forecast 2021-2026
- Exhibit 54: Chart on South America - Market size and forecast 2021-2026 ($ million)
- Exhibit 55: Data Table on South America - Market size and forecast 2021-2026 ($ million)
- Exhibit 56: Chart on South America - Year-over-year growth 2021-2026 (%)
- Exhibit 57: Data Table on South America - Year-over-year growth 2021-2026 (%)
- 7.7 Middle East and Africa - Market size and forecast 2021-2026
- Exhibit 58: Chart on Middle East and Africa - Market size and forecast 2021-2026 ($ million)
- Exhibit 59: Data Table on Middle East and Africa - Market size and forecast 2021-2026 ($ million)
- Exhibit 60: Chart on Middle East and Africa - Year-over-year growth 2021-2026 (%)
- Exhibit 61: Data Table on Middle East and Africa - Year-over-year growth 2021-2026 (%)
- 7.8 US - Market size and forecast 2021-2026
- Exhibit 62: Chart on US - Market size and forecast 2021-2026 ($ million)
- Exhibit 63: Data Table on US - Market size and forecast 2021-2026 ($ million)
- Exhibit 64: Chart on US - Year-over-year growth 2021-2026 (%)
- Exhibit 65: Data Table on US - Year-over-year growth 2021-2026 (%)
- 7.9 China - Market size and forecast 2021-2026
- Exhibit 66: Chart on China - Market size and forecast 2021-2026 ($ million)
- Exhibit 67: Data Table on China - Market size and forecast 2021-2026 ($ million)
- Exhibit 68: Chart on China - Year-over-year growth 2021-2026 (%)
- Exhibit 69: Data Table on China - Year-over-year growth 2021-2026 (%)
- 7.10 India - Market size and forecast 2021-2026
- Exhibit 70: Chart on India - Market size and forecast 2021-2026 ($ million)
- Exhibit 71: Data Table on India - Market size and forecast 2021-2026 ($ million)
- Exhibit 72: Chart on India - Year-over-year growth 2021-2026 (%)
- Exhibit 73: Data Table on India - Year-over-year growth 2021-2026 (%)
- 7.11 Japan - Market size and forecast 2021-2026
- Exhibit 74: Chart on Japan - Market size and forecast 2021-2026 ($ million)
- Exhibit 75: Data Table on Japan - Market size and forecast 2021-2026 ($ million)
- Exhibit 76: Chart on Japan - Year-over-year growth 2021-2026 (%)
- Exhibit 77: Data Table on Japan - Year-over-year growth 2021-2026 (%)
- 7.12 UK - Market size and forecast 2021-2026
- Exhibit 78: Chart on UK - Market size and forecast 2021-2026 ($ million)
- Exhibit 79: Data Table on UK - Market size and forecast 2021-2026 ($ million)
- Exhibit 80: Chart on UK - Year-over-year growth 2021-2026 (%)
- Exhibit 81: Data Table on UK - Year-over-year growth 2021-2026 (%)
- 7.13 Market opportunity by geography
- Exhibit 82: Market opportunity by geography ($ million)
8 Drivers, Challenges, and Trends
- 8.1 Market drivers
- 8.2 Market challenges
- 8.3 Impact of drivers and challenges
- Exhibit 83: Impact of drivers and challenges in 2021 and 2026
- 8.4 Market trends
9 Vendor Landscape
- 9.1 Overview
- 9.2 Vendor landscape
- Exhibit 84: Overview on Criticality of inputs and Factors of differentiation
- 9.3 Landscape disruption
- Exhibit 85: Overview on factors of disruption
- 9.4 Industry risks
- Exhibit 86: Impact of key risks on business
10 Vendor Analysis
- 10.1 Vendors covered
- Exhibit 87: Vendors covered
- 10.2 Market positioning of vendors
- Exhibit 88: Matrix on vendor position and classification
- 10.3 Artsana Spa
- Exhibit 89: Artsana Spa - Overview
- Exhibit 90: Artsana Spa - Product / Service
- Exhibit 91: Artsana Spa - Key offerings
- 10.4 Bridges Consumer Healthcare LLC
- Exhibit 92: Bridges Consumer Healthcare LLC - Overview
- Exhibit 93: Bridges Consumer Healthcare LLC - Product / Service
- Exhibit 94: Bridges Consumer Healthcare LLC - Key offerings
- 10.5 California Baby
- Exhibit 95: California Baby - Overview
- Exhibit 96: California Baby - Product / Service
- Exhibit 97: California Baby - Key offerings
- 10.6 Church and Dwight Co. Inc
- Exhibit 98: Church and Dwight Co. Inc - Overview
- Exhibit 99: Church and Dwight Co. Inc - Business segments
- Exhibit 100: Church and Dwight Co. Inc - Key news
- Exhibit 101: Church and Dwight Co. Inc - Key offerings
- Exhibit 102: Church and Dwight Co. Inc - Segment focus
- 10.7 FREZYDERM SA
- Exhibit 103: FREZYDERM SA - Overview
- Exhibit 104: FREZYDERM SA - Product / Service
- Exhibit 105: FREZYDERM SA - Key offerings
- 10.8 GAIA Skin Naturals
- Exhibit 106: GAIA Skin Naturals - Overview
- Exhibit 107: GAIA Skin Naturals - Product / Service
- Exhibit 108: GAIA Skin Naturals - Key offerings
- 10.9 Himalaya Global Holdings Ltd.
- Exhibit 109: Himalaya Global Holdings Ltd. - Overview
- Exhibit 110: Himalaya Global Holdings Ltd. - Product / Service
- Exhibit 111: Himalaya Global Holdings Ltd. - Key offerings
- 10.10 Johnson and Johnson
- Exhibit 112: Johnson and Johnson - Overview
- Exhibit 113: Johnson and Johnson - Business segments
- Exhibit 114: Johnson and Johnson - Key news
- Exhibit 115: Johnson and Johnson - Key offerings
- Exhibit 116: Johnson and Johnson - Segment focus
- 10.11 Prestige Consumer Healthcare Inc.
- Exhibit 117: Prestige Consumer Healthcare Inc. - Overview
- Exhibit 118: Prestige Consumer Healthcare Inc. - Business segments
- Exhibit 119: Prestige Consumer Healthcare Inc. - Key offerings
- Exhibit 120: Prestige Consumer Healthcare Inc. - Segment focus
- 10.12 Simply Pure Products
- Exhibit 121: Simply Pure Products - Overview
- Exhibit 122: Simply Pure Products - Product / Service
- Exhibit 123: Simply Pure Products - Key offerings
11 Appendix
- 11.1 Scope of the report
- 11.2 Inclusions and exclusions checklist
- Exhibit 124: Inclusions checklist
- Exhibit 125: Exclusions checklist
- 11.3 Currency conversion rates for US$
- Exhibit 126: Currency conversion rates for US$
- 11.4 Research methodology
- Exhibit 127: Research methodology
- Exhibit 128: Validation techniques employed for market sizing
- Exhibit 129: Information sources
- 11.5 List of abbreviations
- Exhibit 130: List of abbreviations
About Us
Technavio is a leading global technology research and advisory company. Their research and analysis focus on emerging market trends and provide actionable insights to help businesses identify market opportunities and develop effective strategies to optimize their market positions. With over 500 specialized analysts, Technavio's report library consists of more than 17,000 reports and counting, covering 800 technologies, spanning across 50 countries. Their client base consists of enterprises of all sizes, including more than 100 Fortune 500 companies. This growing client base relies on Technavio's comprehensive coverage, extensive research, and actionable market insights to identify opportunities in existing and potential markets and assess their competitive positions within changing market scenarios.
Contact
Technavio Research
Jesse Maida
Media & Marketing Executive
US: +1 844 364 1100
UK: +44 203 893 3200
Email: media@technavio.com
Website: www.technavio.com/


SOURCE Infiniti Research, Inc.
© 2024 Benzinga.com. Benzinga does not provide investment advice. All rights reserved.
Trade confidently with insights and alerts from analyst ratings, free reports and breaking news that affects the stocks you care about.

