


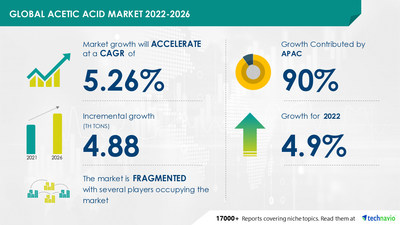
NEW YORK, Oct. 3, 2022 /PRNewswire/ -- The acetic acid market is poised to grow by 4.88 thousand tons from 2021 to 2026, In addition, the growth momentum of the market will accelerate at a CAGR of 5.26% during the forecast period, According to Technavio the recent trends and developments in the commodity chemicals industry. The report considers various factors including the impact of COVID-19 on the market, application, and revenue generated by vendors among others to estimate the size of the market. Understand the scope of our full report on the global acetic acid market Request a free sample report.

The market is fragmented, and the degree of fragmentation will accelerate during the forecast period. BP Plc, Celanese Corp., Daicel Corp., Eastman Chemical Co., GNFC Ltd., HELM AG, Indian Oil Corp. Ltd., Jiangsu Sopo Corp. (Group) Ltd., Jubilant Ingrevia Ltd., Kingboard Holdings Ltd., Lonza Group Ltd., LyondellBasell Industries NV, Mitsubishi Chemical Corp., Pentokey Organy (India) LTD, PetroChina Co. Ltd., Saudi Basic Industries Corp., Shandong Hualu Hengsheng Chemical Co, Ltd., Shanghai Huayi Group Corp. Ltd, The Dow Chemical Co., and Wacker Chemie AG are some of the major market participants.
The market is driven by the growth of the paints and coatings market because of the rapid growth in the building and construction sector. Moreover, the housing and construction sector contributes significantly to the paints and coatings market. China, India, Malaysia, Thailand, and Vietnam exhibit a high demand for paints and coatings because of rapid industrialization, the thriving construction industry, and the increased sales of residential houses. However, the use of electronic cigarettes as a substitute for conventional cigarettes might hamper market growth, because many governments and regulatory bodies are regularizing electronic cigarettes in domestic and international markets as the long-term effects of smoking electronic cigarettes are uncertain. To know more about the drivers, trends and challenges Request a sample report here.
Acetic Acid Market 2022-2026: Segmentation
The Acetic Acid Market is segmented as below:
- Application
- VAM
- PTA
- Acetic Anhydride
- Others
During the forecast period, the VAM segment will see significant growth in the acetic acid market share. Printing inks, water-based paints, ceramic, lacquer, packaging and construction adhesives, paper finishing, and protective colloids for various materials are just a few of the many applications for VAM-produced polymers.
- Geography
- APAC
- North America
- Europe
- South America
- Middle East And Africa
Over the forecast period, the acetic acid market in APAC will expand facilitated by rising demand in various industries. This market research report contains in-depth information about vendors' regional opportunities, marketing gaps, and competitive intelligence, which will aid in the development of effective business plans. Our acetic acid market report covers the following areas:
- Acetic Acid Market size
- Acetic Acid Market trends
- Acetic Acid Market industry analysis
This study identifies the Development of bio-based acetic acid as one of the prime reasons driving the acetic acid market growth during the next few years.
We provide a detailed analysis of around 25 vendors operating in the Acetic Acid Market, including some of the vendors such as vendors Backed with competitive intelligence and benchmarking, our research reports on the Acetic Acid Market are designed to provide entry support, customer profile, and M&As as well as go-to-market strategy support.
- CAGR of the market during the forecast period 2022-2026
- Detailed information on factors that will assist acetic acid market growth during the next five years
- Estimation of the acetic acid market size and its contribution to the parent market
- Predictions on upcoming trends and changes in consumer behavior
- The growth of the acetic acid market
- Analysis of the market's competitive landscape and detailed information on vendors
- Comprehensive details of factors that will challenge the growth of acetic acid market vendors
- Thermoplastic Polyurethane Films Market by Application and Geography - Forecast and Analysis 2022-2026.
- Salt Market by Application, Type, and Geography - Forecast and Analysis 2022-2026
Acetic Acid Market Scope | |
Report Coverage | Details |
Page number | 120 |
Base year | 2021 |
Forecast period | 2022-2026 |
Growth momentum & CAGR | Accelerate at a CAGR of 5.26% |
Market growth 2022-2026 | 4.88 th tons |
Market structure | Fragmented |
YoY growth (%) | 4.9 |
Regional analysis | APAC, North America, Europe, South America, and |
Performing market contribution | APAC at 90% |
Key consumer countries | US, Canada, China, Japan, India, and Germany |
Competitive landscape | Leading companies, competitive strategies, consumer |
Companies profiled | BP Plc, Celanese Corp., Daicel Corp., Eastman |
Market Dynamics | Parent market analysis, Market growth inducers and |
Customization purview | If our report has not included the data that you are |
1 Executive Summary
- 1.1 Market overview
- Exhibit 01: Executive Summary – Chart on Market Overview
- Exhibit 02: Executive Summary – Data Table on Market Overview
- Exhibit 03: Executive Summary – Chart on Global Market Characteristics
- Exhibit 04: Executive Summary – Chart on Market by Geography
- Exhibit 05: Executive Summary – Chart on Market Segmentation by Application
- Exhibit 06: Executive Summary – Chart on Incremental Growth
- Exhibit 07: Executive Summary – Data Table on Incremental Growth
- Exhibit 08: Executive Summary – Chart on Vendor Market Positioning
2 Market Landscape
- 2.1 Market ecosystem
- Exhibit 09: Parent market
- Exhibit 10: Market Characteristics
3 Market Sizing
- 3.1 Market definition
- Exhibit 11: Offerings of vendors included in the market definition
- 3.2 Market segment analysis
- Exhibit 12: Market segments
- 3.3 Market size 2021
- 3.4 Market outlook: Forecast for 2021-2026
- Exhibit 13: Chart on Global - Market size and forecast 2021-2026 (thousand t)
- Exhibit 14: Data Table on Global - Market size and forecast 2021-2026 (thousand t)
- Exhibit 15: Chart on Global Market- Year-over-year growth 2021-2026 (%)
- Exhibit 16: Data Table on Global Market- Year-over-year growth 2021-2026 (%)
4 Five Forces Analysis
- 4.1 Five forces summary
- Exhibit 17: Five forces analysis - Comparison between 2021 and 2026
- 4.2 Bargaining power of buyers
- Exhibit 18: Chart on Bargaining power of buyers – Impact of key factors 2021 and 2026
- 4.3 Bargaining power of suppliers
- Exhibit 19: Bargaining power of suppliers – Impact of key factors in 2021 and 2026
- 4.4 Threat of new entrants
- Exhibit 20: Threat of new entrants – Impact of key factors in 2021 and 2026
- 4.5 Threat of substitutes
- Exhibit 21: Threat of substitutes – Impact of key factors in 2021 and 2026
- 4.6 Threat of rivalry
- Exhibit 22: Threat of rivalry – Impact of key factors in 2021 and 2026
- 4.7 Market condition
- Exhibit 23: Chart on Market condition - Five forces 2021 and 2026
5 Market Segmentation by Application
- 5.1 Market segments
- Exhibit 24: Chart on Application - Market share 2021-2026 (%)
- Exhibit 25: Data Table on Application - Market share 2021-2026 (%)
- 5.2 Comparison by Application
- Exhibit 26: Chart on Comparison by Application
- Exhibit 27: Data Table on Comparison by Application
- 5.3 VAM - Market size and forecast 2021-2026
- Exhibit 28: Chart on VAM - Market size and forecast 2021-2026 (thousand t)
- Exhibit 29: Data Table on VAM - Market size and forecast 2021-2026 (thousand t)
- Exhibit 30: Chart on VAM - Year-over-year growth 2021-2026 (%)
- Exhibit 31: Data Table on VAM - Year-over-year growth 2021-2026 (%)
- 5.4 PTA - Market size and forecast 2021-2026
- Exhibit 32: Chart on PTA - Market size and forecast 2021-2026 (thousand t)
- Exhibit 33: Data Table on PTA - Market size and forecast 2021-2026 (thousand t)
- Exhibit 34: Chart on PTA - Year-over-year growth 2021-2026 (%)
- Exhibit 35: Data Table on PTA - Year-over-year growth 2021-2026 (%)
- 5.5 Acetic anhydride - Market size and forecast 2021-2026
- Exhibit 36: Chart on Acetic anhydride - Market size and forecast 2021-2026 (thousand t)
- Exhibit 37: Data Table on Acetic anhydride - Market size and forecast 2021-2026 (thousand t)
- Exhibit 38: Chart on Acetic anhydride - Year-over-year growth 2021-2026 (%)
- Exhibit 39: Data Table on Acetic anhydride - Year-over-year growth 2021-2026 (%)
- 5.6 Others - Market size and forecast 2021-2026
- Exhibit 40: Chart on Others - Market size and forecast 2021-2026 (thousand t)
- Exhibit 41: Data Table on Others - Market size and forecast 2021-2026 (thousand t)
- Exhibit 42: Chart on Others - Year-over-year growth 2021-2026 (%)
- Exhibit 43: Data Table on Others - Year-over-year growth 2021-2026 (%)
- 5.7 Market opportunity by Application
- Exhibit 44: Market opportunity by Application (thousand t)
6 Customer Landscape
- 6.1 Customer landscape overview
- Exhibit 45: Analysis of price sensitivity, lifecycle, customer purchase basket, adoption rates, and purchase criteria
7 Geographic Landscape
- 7.1 Geographic segmentation
- Exhibit 46: Chart on Market share by geography 2021-2026 (%)
- Exhibit 47: Data Table on Market share by geography 2021-2026 (%)
- 7.2 Geographic comparison
- Exhibit 48: Chart on Geographic comparison
- Exhibit 49: Data Table on Geographic comparison
- 7.3 APAC - Market size and forecast 2021-2026
- Exhibit 50: Chart on APAC - Market size and forecast 2021-2026 (thousand t)
- Exhibit 51: Data Table on APAC - Market size and forecast 2021-2026 (thousand t)
- Exhibit 52: Chart on APAC - Year-over-year growth 2021-2026 (%)
- Exhibit 53: Data Table on APAC - Year-over-year growth 2021-2026 (%)
- 7.4 North America - Market size and forecast 2021-2026
- Exhibit 54: Chart on North America - Market size and forecast 2021-2026 (thousand t)
- Exhibit 55: Data Table on North America - Market size and forecast 2021-2026 (thousand t)
- Exhibit 56: Chart on North America - Year-over-year growth 2021-2026 (%)
- Exhibit 57: Data Table on North America - Year-over-year growth 2021-2026 (%)
- 7.5 Europe - Market size and forecast 2021-2026
- Exhibit 58: Chart on Europe - Market size and forecast 2021-2026 (thousand t)
- Exhibit 59: Data Table on Europe - Market size and forecast 2021-2026 (thousand t)
- Exhibit 60: Chart on Europe - Year-over-year growth 2021-2026 (%)
- Exhibit 61: Data Table on Europe - Year-over-year growth 2021-2026 (%)
- 7.6 South America - Market size and forecast 2021-2026
- Exhibit 62: Chart on South America - Market size and forecast 2021-2026 (thousand t)
- Exhibit 63: Data Table on South America - Market size and forecast 2021-2026 (thousand t)
- Exhibit 64: Chart on South America - Year-over-year growth 2021-2026 (%)
- Exhibit 65: Data Table on South America - Year-over-year growth 2021-2026 (%)
- 7.7 Middle East and Africa - Market size and forecast 2021-2026
- Exhibit 66: Chart on Middle East and Africa - Market size and forecast 2021-2026 (thousand t)
- Exhibit 67: Data Table on Middle East and Africa - Market size and forecast 2021-2026 (thousand t)
- Exhibit 68: Chart on Middle East and Africa - Year-over-year growth 2021-2026 (%)
- Exhibit 69: Data Table on Middle East and Africa - Year-over-year growth 2021-2026 (%)
- 7.8 China - Market size and forecast 2021-2026
- Exhibit 70: Chart on China - Market size and forecast 2021-2026 (thousand t)
- Exhibit 71: Data Table on China - Market size and forecast 2021-2026 (thousand t)
- Exhibit 72: Chart on China - Year-over-year growth 2021-2026 (%)
- Exhibit 73: Data Table on China - Year-over-year growth 2021-2026 (%)
- 7.9 Japan - Market size and forecast 2021-2026
- Exhibit 74: Chart on Japan - Market size and forecast 2021-2026 (thousand t)
- Exhibit 75: Data Table on Japan - Market size and forecast 2021-2026 (thousand t)
- Exhibit 76: Chart on Japan - Year-over-year growth 2021-2026 (%)
- Exhibit 77: Data Table on Japan - Year-over-year growth 2021-2026 (%)
- 7.10 India - Market size and forecast 2021-2026
- Exhibit 78: Chart on India - Market size and forecast 2021-2026 (thousand t)
- Exhibit 79: Data Table on India - Market size and forecast 2021-2026 (thousand t)
- Exhibit 80: Chart on India - Year-over-year growth 2021-2026 (%)
- Exhibit 81: Data Table on India - Year-over-year growth 2021-2026 (%)
- 7.11 US - Market size and forecast 2021-2026
- Exhibit 82: Chart on US - Market size and forecast 2021-2026 (thousand t)
- Exhibit 83: Data Table on US - Market size and forecast 2021-2026 (thousand t)
- Exhibit 84: Chart on US - Year-over-year growth 2021-2026 (%)
- Exhibit 85: Data Table on US - Year-over-year growth 2021-2026 (%)
- 7.12 Germany - Market size and forecast 2021-2026
- Exhibit 86: Chart on Germany - Market size and forecast 2021-2026 (thousand t)
- Exhibit 87: Data Table on Germany - Market size and forecast 2021-2026 (thousand t)
- Exhibit 88: Chart on Germany - Year-over-year growth 2021-2026 (%)
- Exhibit 89: Data Table on Germany - Year-over-year growth 2021-2026 (%)
- 7.13 Canada - Market size and forecast 2021-2026
- Exhibit 90: Chart on Canada - Market size and forecast 2021-2026 (thousand t)
- Exhibit 91: Data Table on Canada - Market size and forecast 2021-2026 (thousand t)
- Exhibit 92: Chart on Canada - Year-over-year growth 2021-2026 (%)
- Exhibit 93: Data Table on Canada - Year-over-year growth 2021-2026 (%)
- 7.14 Market opportunity by geography
- Exhibit 94: Market opportunity by geography (thousand t)
8 Drivers, Challenges, and Trends
- 8.1 Market drivers
- 8.2 Market challenges
- 8.3 Impact of drivers and challenges
- Exhibit 95: Impact of drivers and challenges in 2021 and 2026
- 8.4 Market trends
9 Vendor Landscape
- 9.1 Overview
- 9.2 Vendor landscape
- Exhibit 96: Overview on Criticality of inputs and Factors of differentiation
- 9.3 Landscape disruption
- Exhibit 97: Overview on factors of disruption
- 9.4 Industry risks
- Exhibit 98: Impact of key risks on business
10 Vendor Analysis
- 10.1 Vendors covered
- Exhibit 99: Vendors covered
- 10.2 Market positioning of vendors
- Exhibit 100: Matrix on vendor position and classification
- 10.3 BP Plc
- Exhibit 101: BP Plc - Overview
- Exhibit 102: BP Plc - Business segments
- Exhibit 103: BP Plc - Key offerings
- Exhibit 104: BP Plc - Segment focus
- 10.4 Celanese Corp.
- Exhibit 105: Celanese Corp. - Overview
- Exhibit 106: Celanese Corp. - Business segments
- Exhibit 107: Celanese Corp. - Key offerings
- Exhibit 108: Celanese Corp. - Segment focus
- 10.5 Daicel Corp.
- Exhibit 109: Daicel Corp. - Overview
- Exhibit 110: Daicel Corp. - Business segments
- Exhibit 111: Daicel Corp. - Key news
- Exhibit 112: Daicel Corp. - Key offerings
- Exhibit 113: Daicel Corp. - Segment focus
- 10.6 Eastman Chemical Co.
- Exhibit 114: Eastman Chemical Co. - Overview
- Exhibit 115: Eastman Chemical Co. - Business segments
- Exhibit 116: Eastman Chemical Co. - Key offerings
- Exhibit 117: Eastman Chemical Co. - Segment focus
- 10.7 Jiangsu Sopo Corp. (Group) Ltd.
- Exhibit 118: Jiangsu Sopo Corp. (Group) Ltd. - Overview
- Exhibit 119: Jiangsu Sopo Corp. (Group) Ltd. - Product / Service
- Exhibit 120: Jiangsu Sopo Corp. (Group) Ltd. - Key offerings
- 10.8 Jubilant Ingrevia Ltd.
- Exhibit 121: Jubilant Ingrevia Ltd. - Overview
- Exhibit 122: Jubilant Ingrevia Ltd. - Product / Service
- Exhibit 123: Jubilant Ingrevia Ltd. - Key offerings
- 10.9 Kingboard Holdings Ltd.
- Exhibit 124: Kingboard Holdings Ltd. - Overview
- Exhibit 125: Kingboard Holdings Ltd. - Product / Service
- Exhibit 126: Kingboard Holdings Ltd. - Key offerings
- 10.10 LyondellBasell Industries NV
- Exhibit 127: LyondellBasell Industries NV - Overview
- Exhibit 128: LyondellBasell Industries NV - Business segments
- Exhibit 129: LyondellBasell Industries NV - Key news
- Exhibit 130: LyondellBasell Industries NV - Key offerings
- Exhibit 131: LyondellBasell Industries NV - Segment focus
- 10.11 Saudi Basic Industries Corp.
- Exhibit 132: Saudi Basic Industries Corp. - Overview
- Exhibit 133: Saudi Basic Industries Corp. - Business segments
- Exhibit 134: Saudi Basic Industries Corp. - Key offerings
- Exhibit 135: Saudi Basic Industries Corp. - Segment focus
- 10.12 Shandong Hualu Hengsheng Chemical Co, Ltd.
- Exhibit 136: Shandong Hualu Hengsheng Chemical Co, Ltd. - Overview
- Exhibit 137: Shandong Hualu Hengsheng Chemical Co, Ltd. - Product / Service
- Exhibit 138: Shandong Hualu Hengsheng Chemical Co, Ltd. - Key offerings
11 Appendix
- 11.1 Scope of the report
- 11.2 Inclusions and exclusions checklist
- Exhibit 139: Inclusions checklist
- Exhibit 140: Exclusions checklist
- 11.3 Currency conversion rates for US$
- Exhibit 141: Currency conversion rates for US$
- 11.4 Research methodology
- Exhibit 142: Research methodology
- Exhibit 143: Validation techniques employed for market sizing
- Exhibit 144: Information sources
- 11.5 List of abbreviations
- Exhibit 145: List of abbreviations
Technavio is a leading global technology research and advisory company. Their research and analysis focus on emerging market trends and provides actionable insights to help businesses identify market opportunities and develop effective strategies to optimize their market positions. With over 500 specialized analysts, Technavio's report library consists of more than 17,000 reports and counting, covering 800 technologies, spanning across 50 countries. Their client base consists of enterprises of all sizes, including more than 100 Fortune 500 companies. This growing client base relies on Technavio's comprehensive coverage, extensive research, and actionable market insights to identify opportunities in existing and potential markets and assess their competitive positions within changing market scenarios.
Technavio Research
Jesse Maida
Media & Marketing Executive
US: +1 844 364 1100
UK: +44 203 893 3200
Email: media@technavio.com
Website: www.technavio.com/


SOURCE Technavio
© 2024 Benzinga.com. Benzinga does not provide investment advice. All rights reserved.
Trade confidently with insights and alerts from analyst ratings, free reports and breaking news that affects the stocks you care about.

