


NEW YORK, Oct. 3, 2022 /PRNewswire/ -- The gastrointestinal diseases therapeutics market size is expected to grow by USD 1.60 billion from 2021 to 2026. In addition, the growth momentum of the market will accelerate at a CAGR of 6.68% during the forecast period. According to Technavio the recent trends and developments in the pharmaceuticals industry. The report considers various factors including the impact of COVID-19 on the market, product, and revenue generated by vendors among others to estimate the size of the market. Understand the scope of our full report on the global gastrointestinal diseases therapeutics market. Download PDF sample report.

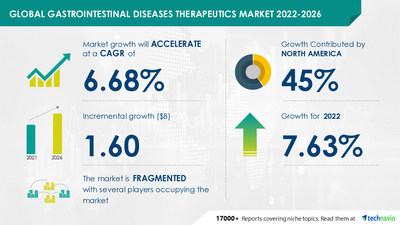
The market is fragmented, and the degree of fragmentation will accelerate during the forecast period. Abbott Laboratories, AbbVie Inc., AstraZeneca Plc, Bausch Health Co Inc, Bayer AG, Biogen Inc., Boston Scientific Corp., C. H. Boehringer Sohn AG and Co. KG, Eisai Co. Ltd., Eli Lilly and Co., Evoke Pharma Inc, GlaxoSmithKline Plc, Johnson and Johnson, Merck and Co. Inc., Novartis AG, Olympus Corp., OVESCO ENDOSCOPY AG, Pfizer Inc., Takeda Pharmaceutical Co. Ltd., and UCB SA are among some of the major market participants.
The market is driven by the increasing incidence of gastrointestinal diseases. Moreover, improper diet, inactive lifestyle, stress, food sensitivity, and bacterial or viral infection are the major factors contributing to the increasing incidence of chronic and acute gastrointestinal diseases. Although factors such as the high cost of therapeutics may impede the market growth, because diseases such as Crohn's disease and ulcerative colitis are chronic IBS, which require prolonged treatment to prevent reoccurrence and chances of developing cancer. The overall cost of therapies for gastrointestinal diseases majorly includes the cost of drugs, doctor fees, and the cost of hospital visits or hospital stays. To know more about the drivers, trends and challenges Request a sample report here.
Gastrointestinal Diseases Therapeutics Market 2022-2026: Segmentation
- Product
- Anti-inflammatory And Immunosuppressors
- Acid Neutralizers
- Other Therapeutics
Anti-inflammatory and immunosuppressors are a type of drugs used for the treatment of patients with IBDs. The increasing prevalence of ulcerative colitis and Crohn's disease, the rising focus of vendors on developing biologics, and effective treatment results among the patients with IBDs are the factors contributing to the growth of the anti-inflammatory and immunosuppressors segment of the global gastrointestinal diseases therapeutics market.
- Geography
- North America
- Europe
- Asia
- Rest Of World (ROW)
North America is another region showing major market growth. The increasing incidence and prevalence of chronic gastrointestinal diseases, growing healthcare expenditure, and increasing preference for therapeutics over surgical procedures are driving the gastrointestinal diseases therapeutics market in North America. The gastrointestinal diseases therapeutics market report covers the following areas:
- Gastrointestinal Diseases Therapeutics Market Size
- Gastrointestinal Diseases Therapeutics Market Trends
- Gastrointestinal Diseases Therapeutics Market Industry Analysis
Gastrointestinal Diseases Therapeutics Market 2022-2026: Key Highlights
- CAGR of the market during the forecast period 2022-2026.
- Detailed information on factors that will assist gastrointestinal diseases therapeutics market growth during the next five years.
- Estimation of the gastrointestinal diseases therapeutics market size and its contribution to the parent market.
- Predictions on upcoming trends and changes in consumer behavior.
- The growth of the gastrointestinal diseases therapeutics market.
- Analysis of the market's competitive landscape and detailed information on vendors.
- Comprehensive details of factors that will challenge the growth of the gastrointestinal diseases therapeutics market, and vendors.
Related Reports:
- Motion Sickness Drugs Market by Product and Geography - Forecast and Geography 2022-2026
- Gastrointestinal Stromal Tumors Therapeutics Market by Route of Administration and Geography - Forecast and Analysis 2022-2026
Gastrointestinal Diseases Therapeutics Market Scope | |
Report Coverage | Details |
Page number | 120 |
Base year | 2021 |
Forecast period | 2022-2026 |
Growth momentum & CAGR | Accelerate at a CAGR of 6.68% |
Market growth 2022-2026 | USD 1.60 billion |
Market structure | Fragmented |
YoY growth (%) | 7.63 |
Regional analysis | North America, Europe, Asia, and Rest of World (ROW) |
Performing market contribution | North America at 45% |
Key consumer countries | US, Germany, France, Japan, and China |
Competitive landscape | Leading companies, competitive strategies, consumer engagement scope |
Companies profiled | Abbott Laboratories, AbbVie Inc., AstraZeneca Plc, Bausch Health Co Inc, Bayer AG, Biogen Inc., Boston Scientific Corp., C. H. Boehringer Sohn AG and Co. KG, Eisai Co. Ltd., Eli Lilly and Co., Evoke Pharma Inc, GlaxoSmithKline Plc, Johnson and Johnson, Merck and Co. Inc., Novartis AG, Olympus Corp., OVESCO ENDOSCOPY AG, Pfizer Inc., Takeda Pharmaceutical Co. Ltd., and UCB SA |
Market Dynamics | Parent market analysis, Market growth inducers and obstacles, Fast-growing and slow-growing segment analysis, COVID-19 impact and future consumer dynamics, and market condition analysis for the forecast period. |
Customization purview | If our report has not included the data that you are looking for, you can reach out to our analysts and get segments customized. |
Table of Contents:
1 Executive Summary
- 1.1 Market overview
- Exhibit 01: Executive Summary – Chart on Market Overview
- Exhibit 02: Executive Summary – Data Table on Market Overview
- Exhibit 03: Executive Summary – Chart on Global Market Characteristics
- Exhibit 04: Executive Summary – Chart on Market by Geography
- Exhibit 05: Executive Summary – Chart on Market Segmentation by Drug Class
- Exhibit 06: Executive Summary – Chart on Incremental Growth
- Exhibit 07: Executive Summary – Data Table on Incremental Growth
- Exhibit 08: Executive Summary – Chart on Vendor Market Positioning
2 Market Landscape
- 2.1 Market ecosystem
- Exhibit 09: Parent market
- Exhibit 10: Market Characteristics
3 Market Sizing
- 3.1 Market definition
- Exhibit 11: Offerings of vendors included in the market definition
- 3.2 Market segment analysis
- Exhibit 12: Market segments
- 3.3 Market size 2021
- 3.4 Market outlook: Forecast for 2021-2026
- Exhibit 13: Chart on Global - Market size and forecast 2021-2026 ($ million)
- Exhibit 14: Data Table on Global - Market size and forecast 2021-2026 ($ million)
- Exhibit 15: Chart on Global Market: Year-over-year growth 2021-2026 (%)
- Exhibit 16: Data Table on Global Market: Year-over-year growth 2021-2026 (%)
4 Five Forces Analysis
- 4.1 Five forces summary
- Exhibit 17: Five forces analysis - Comparison between 2021 and 2026
- 4.2 Bargaining power of buyers
- Exhibit 18: Chart on Bargaining power of buyers – Impact of key factors 2021 and 2026
- 4.3 Bargaining power of suppliers
- Exhibit 19: Bargaining power of suppliers – Impact of key factors in 2021 and 2026
- 4.4 Threat of new entrants
- Exhibit 20: Threat of new entrants – Impact of key factors in 2021 and 2026
- 4.5 Threat of substitutes
- Exhibit 21: Threat of substitutes – Impact of key factors in 2021 and 2026
- 4.6 Threat of rivalry
- Exhibit 22: Threat of rivalry – Impact of key factors in 2021 and 2026
- 4.7 Market condition
- Exhibit 23: Chart on Market condition - Five forces 2021 and 2026
5 Market Segmentation by Drug Class
- 5.1 Market segments
- Exhibit 24: Chart on Drug Class - Market share 2021-2026 (%)
- Exhibit 25: Data Table on Drug Class - Market share 2021-2026 (%)
- 5.2 Comparison by Drug Class
- Exhibit 26: Chart on Comparison by Drug Class
- Exhibit 27: Data Table on Comparison by Drug Class
- 5.3 Anti-inflammatory and immunosuppressors - Market size and forecast 2021-2026
- Exhibit 28: Chart on Anti-inflammatory and immunosuppressors - Market size and forecast 2021-2026 ($ million)
- Exhibit 29: Data Table on Anti-inflammatory and immunosuppressors - Market size and forecast 2021-2026 ($ million)
- Exhibit 30: Chart on Anti-inflammatory and immunosuppressors - Year-over-year growth 2021-2026 (%)
- Exhibit 31: Data Table on Anti-inflammatory and immunosuppressors - Year-over-year growth 2021-2026 (%)
- 5.4 Acid neutralizers - Market size and forecast 2021-2026
- Exhibit 32: Chart on Acid neutralizers - Market size and forecast 2021-2026 ($ million)
- Exhibit 33: Data Table on Acid neutralizers - Market size and forecast 2021-2026 ($ million)
- Exhibit 34: Chart on Acid neutralizers - Year-over-year growth 2021-2026 (%)
- Exhibit 35: Data Table on Acid neutralizers - Year-over-year growth 2021-2026 (%)
- 5.5 Other therapeutics - Market size and forecast 2021-2026
- Exhibit 36: Chart on Other therapeutics - Market size and forecast 2021-2026 ($ million)
- Exhibit 37: Data Table on Other therapeutics - Market size and forecast 2021-2026 ($ million)
- Exhibit 38: Chart on Other therapeutics - Year-over-year growth 2021-2026 (%)
- Exhibit 39: Data Table on Other therapeutics - Year-over-year growth 2021-2026 (%)
- 5.6 Market opportunity by Drug Class
- Exhibit 40: Market opportunity by Drug Class ($ million)
6 Customer Landscape
- 6.1 Customer landscape overview
- Exhibit 41: Analysis of price sensitivity, lifecycle, customer purchase basket, adoption rates, and purchase criteria
7 Geographic Landscape
- 7.1 Geographic segmentation
- Exhibit 42: Chart on Market share by geography 2021-2026 (%)
- Exhibit 43: Data Table on Market share by geography 2021-2026 (%)
- 7.2 Geographic comparison
- Exhibit 44: Chart on Geographic comparison
- Exhibit 45: Data Table on Geographic comparison
- 7.3 North America - Market size and forecast 2021-2026
- Exhibit 46: Chart on North America - Market size and forecast 2021-2026 ($ million)
- Exhibit 47: Data Table on North America - Market size and forecast 2021-2026 ($ million)
- Exhibit 48: Chart on North America - Year-over-year growth 2021-2026 (%)
- Exhibit 49: Data Table on North America - Year-over-year growth 2021-2026 (%)
- 7.4 Europe - Market size and forecast 2021-2026
- Exhibit 50: Chart on Europe - Market size and forecast 2021-2026 ($ million)
- Exhibit 51: Data Table on Europe - Market size and forecast 2021-2026 ($ million)
- Exhibit 52: Chart on Europe - Year-over-year growth 2021-2026 (%)
- Exhibit 53: Data Table on Europe - Year-over-year growth 2021-2026 (%)
- 7.5 Asia - Market size and forecast 2021-2026
- Exhibit 54: Chart on Asia - Market size and forecast 2021-2026 ($ million)
- Exhibit 55: Data Table on Asia - Market size and forecast 2021-2026 ($ million)
- Exhibit 56: Chart on Asia - Year-over-year growth 2021-2026 (%)
- Exhibit 57: Data Table on Asia - Year-over-year growth 2021-2026 (%)
- 7.6 Rest of World (ROW) - Market size and forecast 2021-2026
- Exhibit 58: Chart on Rest of World (ROW) - Market size and forecast 2021-2026 ($ million)
- Exhibit 59: Data Table on Rest of World (ROW) - Market size and forecast 2021-2026 ($ million)
- Exhibit 60: Chart on Rest of World (ROW) - Year-over-year growth 2021-2026 (%)
- Exhibit 61: Data Table on Rest of World (ROW) - Year-over-year growth 2021-2026 (%)
- 7.7 US - Market size and forecast 2021-2026
- Exhibit 62: Chart on US - Market size and forecast 2021-2026 ($ million)
- Exhibit 63: Data Table on US - Market size and forecast 2021-2026 ($ million)
- Exhibit 64: Chart on US - Year-over-year growth 2021-2026 (%)
- Exhibit 65: Data Table on US - Year-over-year growth 2021-2026 (%)
- 7.8 Japan - Market size and forecast 2021-2026
- Exhibit 66: Chart on Japan - Market size and forecast 2021-2026 ($ million)
- Exhibit 67: Data Table on Japan - Market size and forecast 2021-2026 ($ million)
- Exhibit 68: Chart on Japan - Year-over-year growth 2021-2026 (%)
- Exhibit 69: Data Table on Japan - Year-over-year growth 2021-2026 (%)
- 7.9 China - Market size and forecast 2021-2026
- Exhibit 70: Chart on China - Market size and forecast 2021-2026 ($ million)
- Exhibit 71: Data Table on China - Market size and forecast 2021-2026 ($ million)
- Exhibit 72: Chart on China - Year-over-year growth 2021-2026 (%)
- Exhibit 73: Data Table on China - Year-over-year growth 2021-2026 (%)
- 7.10 Germany - Market size and forecast 2021-2026
- Exhibit 74: Chart on Germany - Market size and forecast 2021-2026 ($ million)
- Exhibit 75: Data Table on Germany - Market size and forecast 2021-2026 ($ million)
- Exhibit 76: Chart on Germany - Year-over-year growth 2021-2026 (%)
- Exhibit 77: Data Table on Germany - Year-over-year growth 2021-2026 (%)
- 7.11 France - Market size and forecast 2021-2026
- Exhibit 78: Chart on France - Market size and forecast 2021-2026 ($ million)
- Exhibit 79: Data Table on France - Market size and forecast 2021-2026 ($ million)
- Exhibit 80: Chart on France - Year-over-year growth 2021-2026 (%)
- Exhibit 81: Data Table on France - Year-over-year growth 2021-2026 (%)
- 7.12 Market opportunity by geography
- Exhibit 82: Market opportunity by geography ($ million)
8 Drivers, Challenges, and Trends
- 8.1 Market drivers
- 8.2 Market challenges
- 8.3 Impact of drivers and challenges
- Exhibit 83: Impact of drivers and challenges in 2021 and 2026
- 8.4 Market trends
9 Vendor Landscape
- 9.1 Overview
- 9.2 Vendor landscape
- Exhibit 84: Overview on Criticality of inputs and Factors of differentiation
- 9.3 Landscape disruption
- Exhibit 85: Overview on factors of disruption
- 9.4 Industry risks
- Exhibit 86: Impact of key risks on business
10 Vendor Analysis
- 10.1 Vendors covered
- Exhibit 87: Vendors covered
- 10.2 Market positioning of vendors
- Exhibit 88: Matrix on vendor position and classification
- 10.3 Abbott Laboratories
- Exhibit 89: Abbott Laboratories - Overview
- Exhibit 90: Abbott Laboratories - Business segments
- Exhibit 91: Abbott Laboratories - Key news
- Exhibit 92: Abbott Laboratories - Key offerings
- Exhibit 93: Abbott Laboratories - Segment focus
- 10.4 AbbVie Inc.
- Exhibit 94: AbbVie Inc. - Overview
- Exhibit 95: AbbVie Inc. - Product / Service
- Exhibit 96: AbbVie Inc. - Key offerings
- 10.5 AstraZeneca Plc
- Exhibit 97: AstraZeneca Plc - Overview
- Exhibit 98: AstraZeneca Plc - Product / Service
- Exhibit 99: AstraZeneca Plc - Key news
- Exhibit 100: AstraZeneca Plc - Key offerings
- 10.6 Bausch Health Co Inc
- Exhibit 101: Bausch Health Co Inc - Overview
- Exhibit 102: Bausch Health Co Inc - Business segments
- Exhibit 103: Bausch Health Co Inc - Key news
- Exhibit 104: Bausch Health Co Inc - Key offerings
- Exhibit 105: Bausch Health Co Inc - Segment focus
- 10.7 C. H. Boehringer Sohn AG and Co. KG
- Exhibit 106: C. H. Boehringer Sohn AG and Co. KG - Overview
- Exhibit 107: C. H. Boehringer Sohn AG and Co. KG - Business segments
- Exhibit 108: C. H. Boehringer Sohn AG and Co. KG - Key news
- Exhibit 109: C. H. Boehringer Sohn AG and Co. KG - Key offerings
- Exhibit 110: C. H. Boehringer Sohn AG and Co. KG - Segment focus
- 10.8 GlaxoSmithKline Plc
- Exhibit 111: GlaxoSmithKline Plc - Overview
- Exhibit 112: GlaxoSmithKline Plc - Business segments
- Exhibit 113: GlaxoSmithKline Plc - Key news
- Exhibit 114: GlaxoSmithKline Plc - Key offerings
- Exhibit 115: GlaxoSmithKline Plc - Segment focus
- 10.9 Johnson and Johnson
- Exhibit 116: Johnson and Johnson - Overview
- Exhibit 117: Johnson and Johnson - Business segments
- Exhibit 118: Johnson and Johnson - Key news
- Exhibit 119: Johnson and Johnson - Key offerings
- Exhibit 120: Johnson and Johnson - Segment focus
- 10.10 Merck and Co. Inc.
- Exhibit 121: Merck and Co. Inc. - Overview
- Exhibit 122: Merck and Co. Inc. - Business segments
- Exhibit 123: Merck and Co. Inc. - Key news
- Exhibit 124: Merck and Co. Inc. - Key offerings
- Exhibit 125: Merck and Co. Inc. - Segment focus
- 10.11 Takeda Pharmaceutical Co. Ltd.
- Exhibit 126: Takeda Pharmaceutical Co. Ltd. - Overview
- Exhibit 127: Takeda Pharmaceutical Co. Ltd. - Product / Service
- Exhibit 128: Takeda Pharmaceutical Co. Ltd. - Key news
- Exhibit 129: Takeda Pharmaceutical Co. Ltd. - Key offerings
- 10.12 UCB SA
- Exhibit 130: UCB SA - Overview
- Exhibit 131: UCB SA - Product / Service
- Exhibit 132: UCB SA - Key offerings
11 Appendix
- 11.1 Scope of the report
- 11.2 Inclusions and exclusions checklist
- Exhibit 133: Inclusions checklist
- Exhibit 134: Exclusions checklist
- 11.3 Currency conversion rates for US$
- Exhibit 135: Currency conversion rates for US$
- 11.4 Research methodology
- Exhibit 136: Research methodology
- Exhibit 137: Validation techniques employed for market sizing
- Exhibit 138: Information sources
- 11.5 List of abbreviations
- Exhibit 139: List of abbreviations
- disease
About Us
Technavio is a leading global technology research and advisory company. Their research and analysis focus on emerging market trends and provides actionable insights to help businesses identify market opportunities and develop effective strategies to optimize their market positions. With over 500 specialized analysts, Technavio's report library consists of more than 17,000 reports and counting, covering 800 technologies, spanning across 50 countries. Their client base consists of enterprises of all sizes, including more than 100 Fortune 500 companies. This growing client base relies on Technavio's comprehensive coverage, extensive research, and actionable market insights to identify opportunities in existing and potential markets and assess their competitive positions within changing market scenarios.
Contact
Technavio Research
Jesse Maida
Media & Marketing Executive
US: +1 844 364 1100
UK: +44 203 893 3200
Email: media@technavio.com
Website: www.technavio.com/


SOURCE Technavio
© 2024 Benzinga.com. Benzinga does not provide investment advice. All rights reserved.
Trade confidently with insights and alerts from analyst ratings, free reports and breaking news that affects the stocks you care about.

