


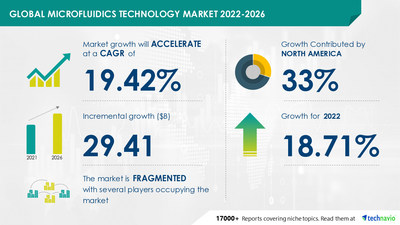
NEW YORK, Oct. 3, 2022 /PRNewswire/ -- The microfluidics technology market size is set to grow by USD 29.41 billion from 2021 to 2026, according to Technavio. The increasing applications in molecular biology, advances in DNA sequencing increased use of microfluidic techniques, and rise in cancer incidences demand novel methods of diagnosis and drug delivery will offer immense growth opportunities.

To leverage the current opportunities, market vendors must strengthen their foothold in the fast-growing segments while maintaining their positions in the slow-growing segments. Buy Sample Report.
Microfluidics Technology Market Segmentation
- Material
- Polymer-based Microfluidics
- Glass-based Microfluidics
- Silicon-based Microfluidics
- Others
- End-user
- Hospitals
- Diagnostic Centers
- Academic Institutes
- Geographic
- North America
- Europe
- Asia
- Rest Of World (ROW)
Microfluidics Technology Market Vendor Analysis and Scope
Some of the major vendors of the microfluidics technology market in the Life Sciences Tools & Services industry include Agilent Technologies Inc., Becton Dickinson and Co., Bio Rad Laboratories Inc., Biocartis Group NV, BioFluidix GmbH, Backtrace Holdings Ltd., Cellix Ltd., Danaher Corp., Elveflow, Epigem Ltd., F. Hoffmann La Roche Ltd., Fluigent SA, iBiochips, IDEX Corp., Illumina Inc., PerkinElmer Inc., QIAGEN NV, SMC Corp., Standard BioTools Inc., and Thermo Fisher Scientific Inc. To help businesses improve their market position, Technavio's report provides a detailed analysis of around 25 vendors operating in the market.
Some Major Key Market Vendors
- Agilent Technologies Inc.:The company provides application-focused solutions that include instruments and software to identify, quantify, and analyze the physical and biological properties of substances and products.
- Becton Dickinson and Co.: The company offers a range of medication delivery solutions, medication management solutions, diabetes care, and pharmaceutical systems.
- Bio Rad Laboratories Inc.: The company develops, manufactures, sells, and services automated test systems, informatics systems, test kits, and specialized quality controls for the healthcare market.
- Biocartis Group NV: The company offers next-generation diagnostic solutions with its unique proprietary Idylla platform.
- BioFluidix GmbH: The company offers liquid handling automation solutions such as BioSpot Arc and others.
Find additional highlights on the growth strategies adopted by vendors and their product
offerings, Read Free Sample Report.
The report also covers the following areas:
- Microfluidics Technology Market size
- Microfluidics Technology Market trends
- Microfluidics Technology Market industry analysis
Market trends such as the growing use of microfluidics technology in cosmetics are likely to emerge as one of the primary drivers of the market. However, factors such as Inherent challenges in microfluidic technology is may threaten the growth of the market. Download Free Sample Report.
Microfluidics Technology Market Key Highlights
- CAGR of the market during the forecast period
- Detailed information on factors that will assist microfluidics technology market growth during the next five years
- Estimation of the microfluidics technology market size and its contribution to the parent market
- Predictions on upcoming trends and changes in consumer behavior
- The growth of the microfluidics technology market
- Analysis of the market's competitive landscape and detailed information on vendors
- Comprehensive details of factors that will challenge the growth of microfluidics technology market vendors
Related Reports:
In-vitro Diagnostics Market by Technology and Geography - Forecast and Analysis 2022-2026: The in-vitro diagnostics market is projected to grow by USD 33.16 billion with a CAGR of 6.89% during the forecast period 2021 to 2026.
Direct-To-Consumer Genetic Testing Market by Service, and Geography - Forecast and Analysis 2022-2026: The direct-to-consumer genetic testing market share is expected to increase by USD 1.26 billion from 2021 to 2026, and the market's growth momentum will accelerate at a CAGR of 13.36%.
Microfluidics Technology Market Scope | |
Report Coverage | Details |
Page number | 120 |
Base year | 2021 |
Forecast period | 2022-2026 |
Growth momentum & CAGR | Accelerate at a CAGR of 19.42% |
Market growth 2022-2026 | $29.41 billion |
Market structure | Fragmented |
YoY growth (%) | 18.71 |
Regional analysis | North America, Europe, Asia, and Rest of World (ROW) |
Performing market contribution | North America at 33% |
Key consumer countries | US, Canada, UK, Germany, and China |
Competitive landscape | Leading companies, competitive strategies, consumer engagement scope |
Companies profiled | Agilent Technologies Inc., Becton Dickinson and Co., Bio Rad Laboratories Inc., Biocartis Group NV, BioFluidix GmbH, Blacktrace Holdings Ltd., Cellix Ltd., Danaher Corp., Elveflow, Epigem Ltd., F. Hoffmann La Roche Ltd., Fluigent SA, iBiochips, IDEX Corp., Illumina Inc., PerkinElmer Inc., QIAGEN NV, SMC Corp., Standard BioTools Inc., and Thermo Fisher Scientific Inc. |
Market Dynamics | Parent market analysis, Market growth inducers and obstacles, Fast-growing and slow-growing segment analysis, COVID-19 impact and future consumer dynamics, and market condition analysis for the forecast period. |
Customization purview | If our report has not included the data that you are looking for, you can reach out to our analysts and get segments customized. |
Table of Contents
1 Executive Summary
- 1.1 Market Overview
- Exhibit 01: Executive Summary – Chart on Market Overview
- Exhibit 02: Executive Summary – Data Table on Market Overview
- Exhibit 03: Executive Summary – Chart on Global Market Characteristics
- Exhibit 04: Executive Summary – Chart on Market by Geography
- Exhibit 05: Executive Summary – Chart on Market Segmentation by Material
- Exhibit 06: Executive Summary – Chart on Market Segmentation by End-user
- Exhibit 07: Executive Summary – Chart on Incremental Growth
- Exhibit 08: Executive Summary – Data Table on Incremental Growth
- Exhibit 09: Executive Summary – Chart on Vendor Market Positioning
2 Market Landscape
- 2.1 Market ecosystem
- Exhibit 10: Parent market
- Exhibit 11: Market Characteristics
3 Market Sizing
- 3.1 Market definition
- Exhibit 12: Offerings of vendors included in the market definition
- 3.2 Market segment analysis
- Exhibit 13: Market segments
- 3.3 Market size 2021
- 3.4 Market outlook: Forecast for 2021-2026
- Exhibit 14: Chart on Global - Market size and forecast 2021-2026 ($ million)
- Exhibit 15: Data Table on Global - Market size and forecast 2021-2026 ($ million)
- Exhibit 16: Chart on Global Market: Year-over-year growth 2021-2026 (%)
- Exhibit 17: Data Table on Global Market: Year-over-year growth 2021-2026 (%)
4 Five Forces Analysis
- 4.1 Five forces summary
- Exhibit 18: Five forces analysis - Comparison between 2021 and 2026
- 4.2 Bargaining power of buyers
- Exhibit 19: Chart on Bargaining power of buyers – Impact of key factors 2021 and 2026
- 4.3 Bargaining power of suppliers
- Exhibit 20: Bargaining power of suppliers – Impact of key factors in 2021 and 2026
- 4.4 Threat of new entrants
- Exhibit 21: Threat of new entrants – Impact of key factors in 2021 and 2026
- 4.5 Threat of substitutes
- Exhibit 22: Threat of substitutes – Impact of key factors in 2021 and 2026
- 4.6 Threat of rivalry
- Exhibit 23: Threat of rivalry – Impact of key factors in 2021 and 2026
- 4.7 Market condition
- Exhibit 24: Chart on Market condition - Five forces 2021 and 2026
5 Market Segmentation by Material
- 5.1 Market segments
- Exhibit 25: Chart on Material - Market share 2021-2026 (%)
- Exhibit 26: Data Table on Material - Market share 2021-2026 (%)
- 5.2 Comparison by Material
- Exhibit 27: Chart on Comparison by Material
- Exhibit 28: Data Table on Comparison by Material
- 5.3 Polymer-based microfluidics - Market size and forecast 2021-2026
- Exhibit 29: Chart on Polymer-based microfluidics - Market size and forecast 2021-2026 ($ million)
- Exhibit 30: Data Table on Polymer-based microfluidics - Market size and forecast 2021-2026 ($ million)
- Exhibit 31: Chart on Polymer-based microfluidics - Year-over-year growth 2021-2026 (%)
- Exhibit 32: Data Table on Polymer-based microfluidics - Year-over-year growth 2021-2026 (%)
- 5.4 Glass-based microfluidics - Market size and forecast 2021-2026
- Exhibit 33: Chart on Glass-based microfluidics - Market size and forecast 2021-2026 ($ million)
- Exhibit 34: Data Table on Glass-based microfluidics - Market size and forecast 2021-2026 ($ million)
- Exhibit 35: Chart on Glass-based microfluidics - Year-over-year growth 2021-2026 (%)
- Exhibit 36: Data Table on Glass-based microfluidics - Year-over-year growth 2021-2026 (%)
- 5.5 Silicon-based microfluidics - Market size and forecast 2021-2026
- Exhibit 37: Chart on Silicon-based microfluidics - Market size and forecast 2021-2026 ($ million)
- Exhibit 38: Data Table on Silicon-based microfluidics - Market size and forecast 2021-2026 ($ million)
- Exhibit 39: Chart on Silicon-based microfluidics - Year-over-year growth 2021-2026 (%)
- Exhibit 40: Data Table on Silicon-based microfluidics - Year-over-year growth 2021-2026 (%)
- 5.6 Others - Market size and forecast 2021-2026
- Exhibit 41: Chart on Others - Market size and forecast 2021-2026 ($ million)
- Exhibit 42: Data Table on Others - Market size and forecast 2021-2026 ($ million)
- Exhibit 43: Chart on Others - Year-over-year growth 2021-2026 (%)
- Exhibit 44: Data Table on Others - Year-over-year growth 2021-2026 (%)
- 5.7 Market opportunity by Material
- Exhibit 45: Market opportunity by Material ($ million)
6 Market Segmentation by End-user
- 6.1 Market segments
- Exhibit 46: Chart on End-user - Market share 2021-2026 (%)
- Exhibit 47: Data Table on End-user - Market share 2021-2026 (%)
- 6.2 Comparison by End-user
- Exhibit 48: Chart on Comparison by End-user
- Exhibit 49: Data Table on Comparison by End-user
- 6.3 Hospitals - Market size and forecast 2021-2026
- Exhibit 50: Chart on Hospitals - Market size and forecast 2021-2026 ($ million)
- Exhibit 51: Data Table on Hospitals - Market size and forecast 2021-2026 ($ million)
- Exhibit 52: Chart on Hospitals - Year-over-year growth 2021-2026 (%)
- Exhibit 53: Data Table on Hospitals - Year-over-year growth 2021-2026 (%)
- 6.4 Diagnostic centers - Market size and forecast 2021-2026
- Exhibit 54: Chart on Diagnostic centers - Market size and forecast 2021-2026 ($ million)
- Exhibit 55: Data Table on Diagnostic centers - Market size and forecast 2021-2026 ($ million)
- Exhibit 56: Chart on Diagnostic centers - Year-over-year growth 2021-2026 (%)
- Exhibit 57: Data Table on Diagnostic centers - Year-over-year growth 2021-2026 (%)
- 6.5 Academic institutes - Market size and forecast 2021-2026
- Exhibit 58: Chart on Academic institutes - Market size and forecast 2021-2026 ($ million)
- Exhibit 59: Data Table on Academic institutes - Market size and forecast 2021-2026 ($ million)
- Exhibit 60: Chart on Academic institutes - Year-over-year growth 2021-2026 (%)
- Exhibit 61: Data Table on Academic institutes - Year-over-year growth 2021-2026 (%)
- 6.6 Market opportunity by End-user
- Exhibit 62: Market opportunity by End-user ($ million)
7 Customer Landscape
- 7.1 Customer landscape overview
- Exhibit 63: Analysis of price sensitivity, lifecycle, customer purchase basket, adoption rates, and purchase criteria
8 Geographic Landscape
- 8.1 Geographic segmentation
- Exhibit 64: Chart on Market share by geography 2021-2026 (%)
- Exhibit 65: Data Table on Market share by geography 2021-2026 (%)
- 8.2 Geographic comparison
- Exhibit 66: Chart on Geographic comparison
- Exhibit 67: Data Table on Geographic comparison
- 8.3 North America - Market size and forecast 2021-2026
- Exhibit 68: Chart on North America - Market size and forecast 2021-2026 ($ million)
- Exhibit 69: Data Table on North America - Market size and forecast 2021-2026 ($ million)
- Exhibit 70: Chart on North America - Year-over-year growth 2021-2026 (%)
- Exhibit 71: Data Table on North America - Year-over-year growth 2021-2026 (%)
- 8.4 Europe - Market size and forecast 2021-2026
- Exhibit 72: Chart on Europe - Market size and forecast 2021-2026 ($ million)
- Exhibit 73: Data Table on Europe - Market size and forecast 2021-2026 ($ million)
- Exhibit 74: Chart on Europe - Year-over-year growth 2021-2026 (%)
- Exhibit 75: Data Table on Europe - Year-over-year growth 2021-2026 (%)
- 8.5 Asia - Market size and forecast 2021-2026
- Exhibit 76: Chart on Asia - Market size and forecast 2021-2026 ($ million)
- Exhibit 77: Data Table on Asia - Market size and forecast 2021-2026 ($ million)
- Exhibit 78: Chart on Asia - Year-over-year growth 2021-2026 (%)
- Exhibit 79: Data Table on Asia - Year-over-year growth 2021-2026 (%)
- 8.6 Rest of World (ROW) - Market size and forecast 2021-2026
- Exhibit 80: Chart on Rest of World (ROW) - Market size and forecast 2021-2026 ($ million)
- Exhibit 81: Data Table on Rest of World (ROW) - Market size and forecast 2021-2026 ($ million)
- Exhibit 82: Chart on Rest of World (ROW) - Year-over-year growth 2021-2026 (%)
- Exhibit 83: Data Table on Rest of World (ROW) - Year-over-year growth 2021-2026 (%)
- 8.7 US - Market size and forecast 2021-2026
- Exhibit 84: Chart on US - Market size and forecast 2021-2026 ($ million)
- Exhibit 85: Data Table on US - Market size and forecast 2021-2026 ($ million)
- Exhibit 86: Chart on US - Year-over-year growth 2021-2026 (%)
- Exhibit 87: Data Table on US - Year-over-year growth 2021-2026 (%)
- 8.8 China - Market size and forecast 2021-2026
- Exhibit 88: Chart on China - Market size and forecast 2021-2026 ($ million)
- Exhibit 89: Data Table on China - Market size and forecast 2021-2026 ($ million)
- Exhibit 90: Chart on China - Year-over-year growth 2021-2026 (%)
- Exhibit 91: Data Table on China - Year-over-year growth 2021-2026 (%)
- 8.9 UK - Market size and forecast 2021-2026
- Exhibit 92: Chart on UK - Market size and forecast 2021-2026 ($ million)
- Exhibit 93: Data Table on UK - Market size and forecast 2021-2026 ($ million)
- Exhibit 94: Chart on UK - Year-over-year growth 2021-2026 (%)
- Exhibit 95: Data Table on UK - Year-over-year growth 2021-2026 (%)
- 8.10 Germany - Market size and forecast 2021-2026
- Exhibit 96: Chart on Germany - Market size and forecast 2021-2026 ($ million)
- Exhibit 97: Data Table on Germany - Market size and forecast 2021-2026 ($ million)
- Exhibit 98: Chart on Germany - Year-over-year growth 2021-2026 (%)
- Exhibit 99: Data Table on Germany - Year-over-year growth 2021-2026 (%)
- 8.11 Canada - Market size and forecast 2021-2026
- Exhibit 100: Chart on Canada - Market size and forecast 2021-2026 ($ million)
- Exhibit 101: Data Table on Canada - Market size and forecast 2021-2026 ($ million)
- Exhibit 102: Chart on Canada - Year-over-year growth 2021-2026 (%)
- Exhibit 103: Data Table on Canada - Year-over-year growth 2021-2026 (%)
- 8.12 Market opportunity by geography
- Exhibit 104: Market opportunity by geography ($ million)
9 Drivers, Challenges, and Trends
- 9.1 Market drivers
- 9.2 Market challenges
- 9.3 Impact of drivers and challenges
- Exhibit 105: Impact of drivers and challenges in 2021 and 2026
- 9.4 Market trends
10 Vendor Landscape
- 10.1 Overview
- 10.2 Vendor landscape
- Exhibit 106: Overview on Criticality of inputs and Factors of differentiation
- 10.3 Landscape disruption
- Exhibit 107: Overview on factors of disruption
- 10.4 Industry risks
- Exhibit 108: Impact of key risks on business
11 Vendor Analysis
- 11.1 Vendors covered
- Exhibit 109: Vendors covered
- 11.2 Market positioning of vendors
- Exhibit 110: Matrix on vendor position and classification
- 11.3 Agilent Technologies Inc.
- Exhibit 111: Agilent Technologies Inc. - Overview
- Exhibit 112: Agilent Technologies Inc. - Business segments
- Exhibit 113: Agilent Technologies Inc. - Key news
- Exhibit 114: Agilent Technologies Inc. - Key offerings
- Exhibit 115: Agilent Technologies Inc. - Segment focus
- 11.4 Becton Dickinson and Co.
- Exhibit 116: Becton Dickinson and Co. - Overview
- Exhibit 117: Becton Dickinson and Co. - Business segments
- Exhibit 118: Becton Dickinson and Co. - Key news
- Exhibit 119: Becton Dickinson and Co. - Key offerings
- Exhibit 120: Becton Dickinson and Co. - Segment focus
- 11.5 Bio Rad Laboratories Inc.
- Exhibit 121: Bio Rad Laboratories Inc. - Overview
- Exhibit 122: Bio Rad Laboratories Inc. - Business segments
- Exhibit 123: Bio Rad Laboratories Inc. - Key news
- Exhibit 124: Bio Rad Laboratories Inc. - Key offerings
- Exhibit 125: Bio Rad Laboratories Inc. - Segment focus
- 11.6 F. Hoffmann La Roche Ltd.
- Exhibit 126: F. Hoffmann La Roche Ltd. - Overview
- Exhibit 127: F. Hoffmann La Roche Ltd. - Business segments
- Exhibit 128: F. Hoffmann La Roche Ltd. - Key news
- Exhibit 129: F. Hoffmann La Roche Ltd. - Key offerings
- Exhibit 130: F. Hoffmann La Roche Ltd. - Segment focus
- 11.7 Fluigent SA
- Exhibit 131: Fluigent SA - Overview
- Exhibit 132: Fluigent SA - Product / Service
- Exhibit 133: Fluigent SA - Key offerings
- 11.8 IDEX Corp.
- Exhibit 134: IDEX Corp. - Overview
- Exhibit 135: IDEX Corp. - Business segments
- Exhibit 136: IDEX Corp. - Key offerings
- Exhibit 137: IDEX Corp. - Segment focus
- 11.9 Illumina Inc.
- Exhibit 138: Illumina Inc. - Overview
- Exhibit 139: Illumina Inc. - Business segments
- Exhibit 140: Illumina Inc. - Key news
- Exhibit 141: Illumina Inc. - Key offerings
- Exhibit 142: Illumina Inc. - Segment focus
- 11.10 PerkinElmer Inc.
- Exhibit 143: PerkinElmer Inc. - Overview
- Exhibit 144: PerkinElmer Inc. - Business segments
- Exhibit 145: PerkinElmer Inc. - Key news
- Exhibit 146: PerkinElmer Inc. - Key offerings
- Exhibit 147: PerkinElmer Inc. - Segment focus
- 11.11 SMC Corp.
- Exhibit 148: SMC Corp. - Overview
- Exhibit 149: SMC Corp. - Product / Service
- Exhibit 150: SMC Corp. - Key offerings
- 11.12 Thermo Fisher Scientific Inc.
- Exhibit 151: Thermo Fisher Scientific Inc. - Overview
- Exhibit 152: Thermo Fisher Scientific Inc. - Business segments
- Exhibit 153: Thermo Fisher Scientific Inc. - Key news
- Exhibit 154: Thermo Fisher Scientific Inc. - Key offerings
- Exhibit 155: Thermo Fisher Scientific Inc. - Segment focus
12 Appendix
- 12.1 Scope of the report
- 12.2 Inclusions and exclusions checklist
- Exhibit 156: Inclusions checklist
- Exhibit 157: Exclusions checklist
- 12.3 Currency conversion rates for US$
- Exhibit 158: Currency conversion rates for US$
- 12.4 Research methodology
- Exhibit 159: Research methodology
- Exhibit 160: Validation techniques employed for market sizing
- Exhibit 161: Information sources
- 12.5 List of abbreviations
- Exhibit 162: List of abbreviations
About Us
Technavio is a leading global technology research and advisory company. Their research and analysis focus on emerging market trends and provides actionable insights to help businesses identify market opportunities and develop effective strategies to optimize their market positions. With over 500 specialized analysts, Technavio's report library consists of more than 17,000 reports and counting, covering 800 technologies, spanning across 50 countries. Their client base consists of enterprises of all sizes, including more than 100 Fortune 500 companies. This growing client base relies on Technavio's comprehensive coverage, extensive research, and actionable market insights to identify opportunities in existing and potential markets and assess their competitive positions within changing market scenarios.
Contact
Technavio Research
Jesse Maida
Media & Marketing Executive
US: +1 844 364 1100
UK: +44 203 893 3200
Email: media@technavio.com
Website: www.technavio.com/


SOURCE Technavio
© 2024 Benzinga.com. Benzinga does not provide investment advice. All rights reserved.
Trade confidently with insights and alerts from analyst ratings, free reports and breaking news that affects the stocks you care about.

