


NEW YORK, Sept. 29, 2022 /PRNewswire/ -- The "Automotive Smart Helmet Market by Type (Full helmet and Half helmet) and Geography (North America, Europe, APAC, South America, and the Middle East and Africa) - Forecast and Analysis 2022-2026" report has been added to Technavio's offering. The potential growth difference for the automotive smart helmet market size between 2021 and 2026 is USD 72.71 million. To get the exact CAGR and the Y-O-Y growth rate, Request a FREE PDF Sample Report

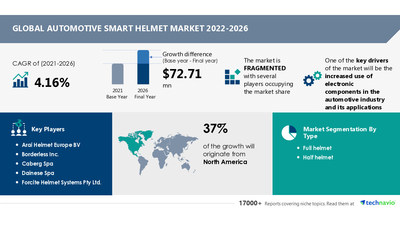
The automotive smart helmet market is fragmented, and the vendors are deploying organic and inorganic growth strategies to compete in the market. The market will be driven by technology innovation and the penetration rate of motorcycle ADAS functionalities. Developed economies of North America and Europe are expected to dominate the market owing to regional market dynamics and the presence of various smart helmet manufacturing vendors. In addition, the market has a large proportion of aftermarket players that offer advanced automotive functionalities. Therefore, investments in helmet design and related technologies are expected to continue during the forecast period.
The automotive smart helmet market report provides complete insights on key vendors including Arai Helmet Europe BV, Borderless Inc., Caberg Spa, Dainese Spa, Forcite Helmet Systems Pty Ltd., HJC EUROPE S.A.R.L., KIDO Sports Co. Ltd., Locatelli Spa, MOMO Helmets, MT HELMETS, Nexxpro SA, Nolangroup Spa, OGK KABUTO Co. Ltd., Praseus Technologies Pvt. Ltd., Schuberth GmbH, Sena Technologies Inc., SHOEI Co. Ltd., SMK Helmets, Steelbird Hi Tech India Ltd., and SUOMY Motorsport Srl.
Technavio's reports provide key strategic initiatives used by vendors, along with key news and the latest developments. View our FREE PDF Sample Report Now
The report includes the competitive analysis, which is a proprietary tool to analyze and evaluate the position of companies based on their industry position score and market performance score. The tool uses various factors for categorizing the players into various categories. Some of these factors considered for analysis are growth strategies, financial performance over the last three years, new product launches, innovation score, growth in market share, and investments.
The increased use of electronic components in the automotive industry and its applications are driving the automotive smart helmet market growth. However, factors such as expensive helmet HUD technology may challenge the market growth during the forecast period.
Technavio has identified key trends, drivers, and challenges in the market, which will help vendors improve their strategies to stay ahead of their competitors. View our FREE PDF Sample Report
- By type, the market has been classified into full helmet and half helmet. The full helmet segment will contribute the largest share of the market during the forecast period.
- By geography, the market has been classified into North America, Europe, APAC, South America, and the Middle East and Africa. North America will have the largest share of the market during the forecast period.
View our FREE PDF sample report for additional insights into the contribution of all the segments and regional opportunities in the automotive smart helmet report
Related Reports
Sports Bicycle Market by Product and Geography - Forecast and Analysis 2022-2026: The sports bicycle market share is expected to increase by USD 5.22 billion from 2021 to 2026.
Balance Bike Market by Type and Geography - Forecast and Analysis 2022-2026: The balance bike market share is expected to increase by USD 898.35 million from 2021 to 2026.
Automotive Smart Helmet Market Scope | |
Report Coverage | Details |
Page number | 120 |
Base year | 2021 |
Forecast period | 2022-2026 |
Growth momentum & CAGR | Accelerate at a CAGR of 4.16% |
Market growth 2022-2026 | USD 72.71 million |
Market structure | Fragmented |
YoY growth (%) | 3.98 |
Regional analysis | North America, Europe, APAC, South America, and Middle East and Africa |
Performing market contribution | North America at 37% |
Key consumer countries | US, Canada, Japan, Germany, and France |
Competitive landscape | Leading companies, competitive strategies, consumer engagement scope |
Companies profiled | Arai Helmet Europe BV, Borderless Inc., Caberg Spa, Dainese Spa, Forcite Helmet Systems Pty Ltd., HJC EUROPE S.A.R.L., KIDO Sports Co. Ltd., Locatelli Spa, MOMO Helmets, MT HELMETS, Nexxpro SA, Nolangroup Spa, OGK KABUTO Co. Ltd., Praseus Technologies Pvt. Ltd., Schuberth GmbH, Sena Technologies Inc., SHOEI Co. Ltd., SMK Helmets, Steelbird Hi Tech India Ltd., and SUOMY Motorsport Srl |
Market Dynamics | Parent market analysis, market growth inducers and obstacles, fast-growing and slow-growing segment analysis, COVID-19 impact and future consumer dynamics, and market condition analysis for the forecast period. |
Customization purview | If our report has not included the data that you are looking for, you can reach out to our analysts and get segments customized. |
Browse Consumer Discretionary Market Reports
Key Topics Covered
1 Executive Summary
- 1.1 Market overview
- Exhibit 01: Executive Summary – Chart on Market Overview
- Exhibit 02: Executive Summary – Data Table on Market Overview
- Exhibit 03: Executive Summary – Chart on Global Market Characteristics
- Exhibit 04: Executive Summary – Chart on Market by Geography
- Exhibit 05: Executive Summary – Chart on Market Segmentation by Type
- Exhibit 06: Executive Summary – Chart on Incremental Growth
- Exhibit 07: Executive Summary – Data Table on Incremental Growth
- Exhibit 08: Executive Summary – Chart on Vendor Market Positioning
2 Market Landscape
- 2.1 Market ecosystem
- Exhibit 09: Parent market
- Exhibit 10: Market Characteristics
3 Market Sizing
- 3.1 Market definition
- Exhibit 11: Offerings of vendors included in the market definition
- 3.2 Market segment analysis
- Exhibit 12: Market segments
- 3.3 Market size 2021
- 3.4 Market outlook: Forecast for 2021-2026
- Exhibit 13: Chart on Global - Market size and forecast 2021-2026 ($ million)
- Exhibit 14: Data Table on Global - Market size and forecast 2021-2026 ($ million)
- Exhibit 15: Chart on Global Market: Year-over-year growth 2021-2026 (%)
- Exhibit 16: Data Table on Global Market: Year-over-year growth 2021-2026 (%)
4 Five Forces Analysis
- 4.1 Five forces summary
- Exhibit 17: Five forces analysis - Comparison between 2021 and 2026
- 4.2 Bargaining power of buyers
- Exhibit 18: Chart on Bargaining power of buyers – Impact of key factors 2021 and 2026
- 4.3 Bargaining power of suppliers
- Exhibit 19: Bargaining power of suppliers – Impact of key factors in 2021 and 2026
- 4.4 Threat of new entrants
- Exhibit 20: Threat of new entrants – Impact of key factors in 2021 and 2026
- 4.5 Threat of substitutes
- Exhibit 21: Threat of substitutes – Impact of key factors in 2021 and 2026
- 4.6 Threat of rivalry
- Exhibit 22: Threat of rivalry – Impact of key factors in 2021 and 2026
- 4.7 Market condition
- Exhibit 23: Chart on Market condition - Five forces 2021 and 2026
5 Market Segmentation by Type
- 5.1 Market segments
- Exhibit 24: Chart on Type - Market share 2021-2026 (%)
- Exhibit 25: Data Table on Type - Market share 2021-2026 (%)
- 5.2 Comparison by Type
- Exhibit 26: Chart on Comparison by Type
- Exhibit 27: Data Table on Comparison by Type
- 5.3 Full helmet - Market size and forecast 2021-2026
- Exhibit 28: Chart on Full helmet - Market size and forecast 2021-2026 ($ million)
- Exhibit 29: Data Table on Full helmet - Market size and forecast 2021-2026 ($ million)
- Exhibit 30: Chart on Full helmet - Year-over-year growth 2021-2026 (%)
- Exhibit 31: Data Table on Full helmet - Year-over-year growth 2021-2026 (%)
- 5.4 Half helmet - Market size and forecast 2021-2026
- Exhibit 32: Chart on Half helmet - Market size and forecast 2021-2026 ($ million)
- Exhibit 33: Data Table on Half helmet - Market size and forecast 2021-2026 ($ million)
- Exhibit 34: Chart on Half helmet - Year-over-year growth 2021-2026 (%)
- Exhibit 35: Data Table on Half helmet - Year-over-year growth 2021-2026 (%)
- 5.5 Market opportunity by Type
- Exhibit 36: Market opportunity by Type ($ million)
6 Customer Landscape
- 6.1 Customer landscape overview
- Exhibit 37: Analysis of price sensitivity, lifecycle, customer purchase basket, adoption rates, and purchase criteria
7 Geographic Landscape
- 7.1 Geographic segmentation
- Exhibit 38: Chart on Market share by geography 2021-2026 (%)
- Exhibit 39: Data Table on Market share by geography 2021-2026 (%)
- 7.2 Geographic comparison
- Exhibit 40: Chart on Geographic comparison
- Exhibit 41: Data Table on Geographic comparison
- 7.3 North America - Market size and forecast 2021-2026
- Exhibit 42: Chart on North America - Market size and forecast 2021-2026 ($ million)
- Exhibit 43: Data Table on North America - Market size and forecast 2021-2026 ($ million)
- Exhibit 44: Chart on North America - Year-over-year growth 2021-2026 (%)
- Exhibit 45: Data Table on North America - Year-over-year growth 2021-2026 (%)
- 7.4 Europe - Market size and forecast 2021-2026
- Exhibit 46: Chart on Europe - Market size and forecast 2021-2026 ($ million)
- Exhibit 47: Data Table on Europe - Market size and forecast 2021-2026 ($ million)
- Exhibit 48: Chart on Europe - Year-over-year growth 2021-2026 (%)
- Exhibit 49: Data Table on Europe - Year-over-year growth 2021-2026 (%)
- 7.5 APAC - Market size and forecast 2021-2026
- Exhibit 50: Chart on APAC - Market size and forecast 2021-2026 ($ million)
- Exhibit 51: Data Table on APAC - Market size and forecast 2021-2026 ($ million)
- Exhibit 52: Chart on APAC - Year-over-year growth 2021-2026 (%)
- Exhibit 53: Data Table on APAC - Year-over-year growth 2021-2026 (%)
- 7.6 South America - Market size and forecast 2021-2026
- Exhibit 54: Chart on South America - Market size and forecast 2021-2026 ($ million)
- Exhibit 55: Data Table on South America - Market size and forecast 2021-2026 ($ million)
- Exhibit 56: Chart on South America - Year-over-year growth 2021-2026 (%)
- Exhibit 57: Data Table on South America - Year-over-year growth 2021-2026 (%)
- 7.7 Middle East and Africa - Market size and forecast 2021-2026
- Exhibit 58: Chart on Middle East and Africa - Market size and forecast 2021-2026 ($ million)
- Exhibit 59: Data Table on Middle East and Africa - Market size and forecast 2021-2026 ($ million)
- Exhibit 60: Chart on Middle East and Africa - Year-over-year growth 2021-2026 (%)
- Exhibit 61: Data Table on Middle East and Africa - Year-over-year growth 2021-2026 (%)
- 7.8 US - Market size and forecast 2021-2026
- Exhibit 62: Chart on US - Market size and forecast 2021-2026 ($ million)
- Exhibit 63: Data Table on US - Market size and forecast 2021-2026 ($ million)
- Exhibit 64: Chart on US - Year-over-year growth 2021-2026 (%)
- Exhibit 65: Data Table on US - Year-over-year growth 2021-2026 (%)
- 7.9 Germany - Market size and forecast 2021-2026
- Exhibit 66: Chart on Germany - Market size and forecast 2021-2026 ($ million)
- Exhibit 67: Data Table on Germany - Market size and forecast 2021-2026 ($ million)
- Exhibit 68: Chart on Germany - Year-over-year growth 2021-2026 (%)
- Exhibit 69: Data Table on Germany - Year-over-year growth 2021-2026 (%)
- 7.10 France - Market size and forecast 2021-2026
- Exhibit 70: Chart on France - Market size and forecast 2021-2026 ($ million)
- Exhibit 71: Data Table on France - Market size and forecast 2021-2026 ($ million)
- Exhibit 72: Chart on France - Year-over-year growth 2021-2026 (%)
- Exhibit 73: Data Table on France - Year-over-year growth 2021-2026 (%)
- 7.11 Canada - Market size and forecast 2021-2026
- Exhibit 74: Chart on Canada - Market size and forecast 2021-2026 ($ million)
- Exhibit 75: Data Table on Canada - Market size and forecast 2021-2026 ($ million)
- Exhibit 76: Chart on Canada - Year-over-year growth 2021-2026 (%)
- Exhibit 77: Data Table on Canada - Year-over-year growth 2021-2026 (%)
- 7.12 Japan - Market size and forecast 2021-2026
- Exhibit 78: Chart on Japan - Market size and forecast 2021-2026 ($ million)
- Exhibit 79: Data Table on Japan - Market size and forecast 2021-2026 ($ million)
- Exhibit 80: Chart on Japan - Year-over-year growth 2021-2026 (%)
- Exhibit 81: Data Table on Japan - Year-over-year growth 2021-2026 (%)
- 7.13 Market opportunity by geography
- Exhibit 82: Market opportunity by geography ($ million)
8 Drivers, Challenges, and Trends
- 8.1 Market drivers
- 8.2 Market challenges
- 8.3 Impact of drivers and challenges
- Exhibit 83: Impact of drivers and challenges in 2021 and 2026
- 8.4 Market trends
9 Vendor Landscape
- 9.1 Overview
- 9.2 Vendor landscape
- Exhibit 84: Overview on Criticality of inputs and Factors of differentiation
- 9.3 Landscape disruption
- Exhibit 85: Overview on factors of disruption
- 9.4 Industry risks
- Exhibit 86: Impact of key risks on business
10 Vendor Analysis
- 10.1 Vendors covered
- Exhibit 87: Vendors covered
- 10.2 Market positioning of vendors
- Exhibit 88: Matrix on vendor position and classification
- 10.3 Arai Helmet Europe BV
- Exhibit 89: Arai Helmet Europe BV - Overview
- Exhibit 90: Arai Helmet Europe BV - Product / Service
- Exhibit 91: Arai Helmet Europe BV - Key offerings
- 10.4 Caberg Spa
- Exhibit 92: Caberg Spa - Overview
- Exhibit 93: Caberg Spa - Product / Service
- Exhibit 94: Caberg Spa - Key offerings
- 10.5 Dainese Spa
- Exhibit 95: Dainese Spa - Overview
- Exhibit 96: Dainese Spa - Product / Service
- Exhibit 97: Dainese Spa - Key offerings
- 10.6 Forcite Helmet Systems Pty Ltd.
- Exhibit 98: Forcite Helmet Systems Pty Ltd. - Overview
- Exhibit 99: Forcite Helmet Systems Pty Ltd. - Product / Service
- Exhibit 100: Forcite Helmet Systems Pty Ltd. - Key offerings
- 10.7 HJC EUROPE S.A.R.L.
- Exhibit 101: HJC EUROPE S.A.R.L. - Overview
- Exhibit 102: HJC EUROPE S.A.R.L. - Product / Service
- Exhibit 103: HJC EUROPE S.A.R.L. - Key offerings
- 10.8 Locatelli Spa
- Exhibit 104: Locatelli Spa - Overview
- Exhibit 105: Locatelli Spa - Product / Service
- Exhibit 106: Locatelli Spa - Key offerings
- 10.9 MOMO Helmets
- Exhibit 107: MOMO Helmets - Overview
- Exhibit 108: MOMO Helmets - Product / Service
- Exhibit 109: MOMO Helmets - Key offerings
- 10.10 MT HELMETS
- Exhibit 110: MT HELMETS - Overview
- Exhibit 111: MT HELMETS - Product / Service
- Exhibit 112: MT HELMETS - Key offerings
- 10.11 Nexxpro SA
- Exhibit 113: Nexxpro SA - Overview
- Exhibit 114: Nexxpro SA - Product / Service
- Exhibit 115: Nexxpro SA - Key offerings
- 10.12 Nolangroup Spa
- Exhibit 116: Nolangroup Spa - Overview
- Exhibit 117: Nolangroup Spa - Product / Service
- Exhibit 118: Nolangroup Spa - Key offerings
11 Appendix
- 11.1 Scope of the report
- 11.2 Inclusions and exclusions checklist
- Exhibit 119: Inclusions checklist
- Exhibit 120: Exclusions checklist
- 11.3 Currency conversion rates for US$
- Exhibit 121: Currency conversion rates for US$
- 11.4 Research methodology
- Exhibit 122: Research methodology
- Exhibit 123: Validation techniques employed for market sizing
- Exhibit 124: Information sources
- 11.5 List of abbreviations
- Exhibit 125: List of abbreviations
Technavio is a leading global technology research and advisory company. Their research and analysis focus on emerging market trends and provide actionable insights to help businesses identify market opportunities and develop effective strategies to optimize their market positions.
With over 500 specialized analysts, Technavio's report library consists of more than 17,000 reports and counting, covering 800 technologies, spanning across 50 countries. Their client base consists of enterprises of all sizes, including more than 100 Fortune 500 companies. This growing client base relies on Technavio's comprehensive coverage, extensive research, and actionable market insights to identify opportunities in existing and potential markets and assess their competitive positions within changing market scenarios.
Contact
Technavio Research
Jesse Maida
Media & Marketing Executive
US: +1 844 364 1100
UK: +44 203 893 3200
Email:media@technavio.com
Website: www.technavio.com/


SOURCE Infiniti Research, Inc.
© 2024 Benzinga.com. Benzinga does not provide investment advice. All rights reserved.
Trade confidently with insights and alerts from analyst ratings, free reports and breaking news that affects the stocks you care about.

