


NEW YORK, Sept. 29, 2022 /PRNewswire/ -- The Big Data Spending Market in Healthcare Sector is expected to grow by USD 8.93 billion during 2021-2026 according to the latest market research report by Technavio. As per Technavio, the increasing use of big data analytics in healthcare will have a positive impact on the market and contribute to its growth significantly over the forecast period. Download Free Sample Report.

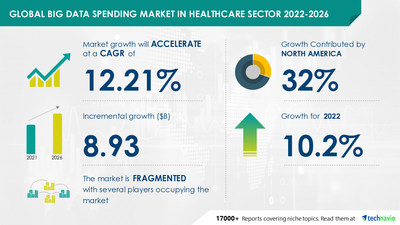
32% of the market's growth will originate from North America during the forecast period. The US and Canada are the key markets for the big data spending market in the healthcare sector in North America. Market growth in this region will be slower than the growth of the market in Europe and APAC.
The rise in advancements in IoT and the increase in the demand for analytical models on patient information for better service delivery and government policies will facilitate the big data spending market in the healthcare sector growth in North America over the forecast period. Buy Sample Report.
The services segment's big data spending market share will expand significantly in the healthcare sector. For instance, while having a small revenue market share within the services area, consulting services had a large impact on the entire revenue creation. Numerous businesses, like IBM and HP, offer consulting services tailored to the healthcare industry. Therefore, among the elements anticipated to contribute to the expansion of the services segment throughout the projection period are the expanding digitalization of healthcare, IoT and cloud deployment, and government support for HCIT.
One of the main factors influencing the growth of the big data spending market in the healthcare industry is the requirement to increase corporate efficiency. Massive data generation has increased as a result of the rise in linked devices in the healthcare industry. Due to this, there has been a tremendous increase in the use of IT worldwide for the storage and retrieval of medical and clinical data.
Furthermore, healthcare companies would be less congested in hospitals, would experience fewer system failures, and would be better prepared for impending calamities by utilizing big data analytics and predictive asset maintenance. As a result, the worldwide big data spending market in the healthcare industry is growing due to the increasing demand to increase corporate efficiency. Request Free Sample Report.
One of the major big data spending industry trends boosting market expansion is the growing use of big data analytics in healthcare. To create and maintain functional health information systems, governments are promoting the use of IT and telecommunications in the healthcare industry.
For instance, the National Health Insurance program by various governments is made to keep track of the planning and establishment of health information systems that apply error-free patient care management while avoiding errors. All of these activities have generated a tremendous amount of data, which must be efficiently stored and processed in order to yield actionable insights.
Digital Commerce Market by Business Segment and Geography - Forecast and Analysis 2022-2026
Advanced Distribution Management System Market by Component and Geography - Forecast and Analysis 2021-2025
Big Data Spending Market In Healthcare Sector Market Scope | |
Report Coverage | Details |
Page number | 120 |
Base year | 2021 |
Forecast period | 2022-2026 |
Growth momentum & CAGR | Accelerate at a CAGR of 12.21% |
Market growth 2022-2026 | $8.93 billion |
Market structure | Fragmented |
YoY growth (%) | 10.2 |
Regional analysis | North America, Europe, APAC, Middle East and Africa, and South America |
Performing market contribution | North America at 32% |
Key consumer countries | US, Canada, China, Germany, and UK |
Competitive landscape | Leading companies, competitive strategies, consumer engagement scope |
Companies profiled | Alphabet Inc., Amazon.com Inc., Cisco Systems Inc., Cloudera Inc., Cognizant Technology Solutions Corp., Couchbase Inc., Dell Technologies Inc., Health Catalyst Inc., Hewlett Packard Enterprise Co., Hitachi Vantara LLC, International Business Machines Corp., McKesson Corp., Medeanalytics Inc., Microsoft Corp., Oracle Corp., SAP SE, SAS Institute Inc., Splunk Inc., Teradata Corp., and Vizient Inc. |
Market Dynamics | Parent market analysis, Market growth inducers and obstacles, Fast-growing and slow-growing segment analysis, COVID-19 impact and future consumer dynamics, and market condition analysis for the forecast period. |
Customization purview | If our report has not included the data that you are looking for, you can reach out to our analysts and get segments customized. |
1 Executive Summary
- 1.1 Market Overview
- Exhibit 01: Executive Summary – Chart on Market Overview
- Exhibit 02: Executive Summary – Data Table on Market Overview
- Exhibit 03: Executive Summary – Chart on Global Market Characteristics
- Exhibit 04: Executive Summary – Chart on Market by Geography
- Exhibit 05: Executive Summary – Chart on Market Segmentation by Service
- Exhibit 06: Executive Summary – Chart on Incremental Growth
- Exhibit 07: Executive Summary – Data Table on Incremental Growth
- Exhibit 08: Executive Summary – Chart on Vendor Market Positioning
2 Market Landscape
- 2.1 Market ecosystem
- Exhibit 09: Parent market
- Exhibit 10: Market Characteristics
3 Market Sizing
- 3.1 Market definition
- Exhibit 11: Offerings of vendors included in the market definition
- 3.2 Market segment analysis
- Exhibit 12: Market segments
- 3.3 Market size 2021
- 3.4 Market outlook: Forecast for 2021-2026
- Exhibit 13: Chart on Global - Market size and forecast 2021-2026 ($ million)
- Exhibit 14: Data Table on Global - Market size and forecast 2021-2026 ($ million)
- Exhibit 15: Chart on Global Market: Year-over-year growth 2021-2026 (%)
- Exhibit 16: Data Table on Global Market: Year-over-year growth 2021-2026 (%)
4 Five Forces Analysis
- 4.1 Five forces summary
- Exhibit 17: Five forces analysis - Comparison between2021 and 2026
- 4.2 Bargaining power of buyers
- Exhibit 18: Chart on Bargaining power of buyers – Impact of key factors 2021 and 2026
- 4.3 Bargaining power of suppliers
- Exhibit 19: Bargaining power of suppliers – Impact of key factors in 2021 and 2026
- 4.4 Threat of new entrants
- Exhibit 20: Threat of new entrants – Impact of key factors in 2021 and 2026
- 4.5 Threat of substitutes
- Exhibit 21: Threat of substitutes – Impact of key factors in 2021 and 2026
- 4.6 Threat of rivalry
- Exhibit 22: Threat of rivalry – Impact of key factors in 2021 and 2026
- 4.7 Market condition
- Exhibit 23: Chart on Market condition - Five forces 2021 and 2026
5 Market Segmentation by Service
- 5.1 Market segments
- Exhibit 24: Chart on Service - Market share 2021-2026 (%)
- Exhibit 25: Data Table on Service - Market share 2021-2026 (%)
- 5.2 Comparison by Service
- Exhibit 26: Chart on Comparison by Service
- Exhibit 27: Data Table on Comparison by Service
- 5.3 Services - Market size and forecast 2021-2026
- Exhibit 28: Chart on Services - Market size and forecast 2021-2026 ($ million)
- Exhibit 29: Data Table on Services - Market size and forecast 2021-2026 ($ million)
- Exhibit 30: Chart on Services - Year-over-year growth 2021-2026 (%)
- Exhibit 31: Data Table on Services - Year-over-year growth 2021-2026 (%)
- 5.4 Software - Market size and forecast 2021-2026
- Exhibit 32: Chart on Software - Market size and forecast 2021-2026 ($ million)
- Exhibit 33: Data Table on Software - Market size and forecast 2021-2026 ($ million)
- Exhibit 34: Chart on Software - Year-over-year growth 2021-2026 (%)
- Exhibit 35: Data Table on Software - Year-over-year growth 2021-2026 (%)
- 5.5 Market opportunity by Service
- Exhibit 36: Market opportunity by Service ($ million)
6 Customer Landscape
- 6.1 Customer landscape overview
- Exhibit 37: Analysis of price sensitivity, lifecycle, customer purchase basket, adoption rates, and purchase criteria
7 Geographic Landscape
- 7.1 Geographic segmentation
- Exhibit 38: Chart on Market share by geography 2021-2026 (%)
- Exhibit 39: Data Table on Market share by geography 2021-2026 (%)
- 7.2 Geographic comparison
- Exhibit 40: Chart on Geographic comparison
- Exhibit 41: Data Table on Geographic comparison
- 7.3 North America - Market size and forecast 2021-2026
- Exhibit 42: Chart on North America - Market size and forecast 2021-2026 ($ million)
- Exhibit 43: Data Table on North America - Market size and forecast 2021-2026 ($ million)
- Exhibit 44: Chart on North America - Year-over-year growth 2021-2026 (%)
- Exhibit 45: Data Table on North America - Year-over-year growth 2021-2026 (%)
- 7.4 Europe - Market size and forecast 2021-2026
- Exhibit 46: Chart on Europe - Market size and forecast 2021-2026 ($ million)
- Exhibit 47: Data Table on Europe - Market size and forecast 2021-2026 ($ million)
- Exhibit 48: Chart on Europe - Year-over-year growth 2021-2026 (%)
- Exhibit 49: Data Table on Europe - Year-over-year growth 2021-2026 (%)
- 7.5 APAC - Market size and forecast 2021-2026
- Exhibit 50: Chart on APAC - Market size and forecast 2021-2026 ($ million)
- Exhibit 51: Data Table on APAC - Market size and forecast 2021-2026 ($ million)
- Exhibit 52: Chart on APAC - Year-over-year growth 2021-2026 (%)
- Exhibit 53: Data Table on APAC - Year-over-year growth 2021-2026 (%)
- 7.6 Middle East and Africa - Market size and forecast 2021-2026
- Exhibit 54: Chart on Middle East and Africa - Market size and forecast 2021-2026 ($ million)
- Exhibit 55: Data Table on Middle East and Africa - Market size and forecast 2021-2026 ($ million)
- Exhibit 56: Chart on Middle East and Africa - Year-over-year growth 2021-2026 (%)
- Exhibit 57: Data Table on Middle East and Africa - Year-over-year growth 2021-2026 (%)
- 7.7 South America - Market size and forecast 2021-2026
- Exhibit 58: Chart on South America - Market size and forecast 2021-2026 ($ million)
- Exhibit 59: Data Table on South America - Market size and forecast 2021-2026 ($ million)
- Exhibit 60: Chart on South America - Year-over-year growth 2021-2026 (%)
- Exhibit 61: Data Table on South America - Year-over-year growth 2021-2026 (%)
- 7.8 US - Market size and forecast 2021-2026
- Exhibit 62: Chart on US - Market size and forecast 2021-2026 ($ million)
- Exhibit 63: Data Table on US - Market size and forecast 2021-2026 ($ million)
- Exhibit 64: Chart on US - Year-over-year growth 2021-2026 (%)
- Exhibit 65: Data Table on US - Year-over-year growth 2021-2026 (%)
- 7.9 China - Market size and forecast 2021-2026
- Exhibit 66: Chart on China - Market size and forecast 2021-2026 ($ million)
- Exhibit 67: Data Table on China - Market size and forecast 2021-2026 ($ million)
- Exhibit 68: Chart on China - Year-over-year growth 2021-2026 (%)
- Exhibit 69: Data Table on China - Year-over-year growth 2021-2026 (%)
- 7.10 Germany - Market size and forecast 2021-2026
- Exhibit 70: Chart on Germany - Market size and forecast 2021-2026 ($ million)
- Exhibit 71: Data Table on Germany - Market size and forecast 2021-2026 ($ million)
- Exhibit 72: Chart on Germany - Year-over-year growth 2021-2026 (%)
- Exhibit 73: Data Table on Germany - Year-over-year growth 2021-2026 (%)
- 7.11 Canada - Market size and forecast 2021-2026
- Exhibit 74: Chart on Canada - Market size and forecast 2021-2026 ($ million)
- Exhibit 75: Data Table on Canada - Market size and forecast 2021-2026 ($ million)
- Exhibit 76: Chart on Canada - Year-over-year growth 2021-2026 (%)
- Exhibit 77: Data Table on Canada - Year-over-year growth 2021-2026 (%)
- 7.12 UK - Market size and forecast 2021-2026
- Exhibit 78: Chart on UK - Market size and forecast 2021-2026 ($ million)
- Exhibit 79: Data Table on UK - Market size and forecast 2021-2026 ($ million)
- Exhibit 80: Chart on UK - Year-over-year growth 2021-2026 (%)
- Exhibit 81: Data Table on UK - Year-over-year growth 2021-2026 (%)
- 7.13 Market opportunity by geography
- Exhibit 82: Market opportunity by geography ($ million)
8 Drivers, Challenges, and Trends
- 8.1 Market drivers
- 8.2 Market challenges
- 8.3 Impact of drivers and challenges
- Exhibit 83: Impact of drivers and challenges in 2021 and 2026
- 8.4 Market trends
9 Vendor Landscape
- 9.1 Overview
- 9.2 Vendor landscape
- Exhibit 84: Overview on Criticality of inputs and Factors of differentiation
- 9.3 Landscape disruption
- Exhibit 85: Overview on factors of disruption
- 9.4 Industry risks
- Exhibit 86: Impact of key risks on business
10 Vendor Analysis
- 10.1 Vendors covered
- Exhibit 87: Vendors covered
- 10.2 Market positioning of vendors
- Exhibit 88: Matrix on vendor position and classification
- 10.3 Alphabet Inc.
- Exhibit 89: Alphabet Inc. - Overview
- Exhibit 90: Alphabet Inc. - Business segments
- Exhibit 91: Alphabet Inc. - Key news
- Exhibit 92: Alphabet Inc. - Key offerings
- Exhibit 93: Alphabet Inc. - Segment focus
- 10.4 Amazon.com Inc.
- Exhibit 94: Amazon.com Inc. - Overview
- Exhibit 95: Amazon.com Inc. - Business segments
- Exhibit 96: Amazon.com Inc. - Key news
- Exhibit 97: Amazon.com Inc. - Key offerings
- Exhibit 98: Amazon.com Inc. - Segment focus
- 10.5 Cisco Systems Inc.
- Exhibit 99: Cisco Systems Inc. - Overview
- Exhibit 100: Cisco Systems Inc. - Business segments
- Exhibit 101: Cisco Systems Inc. - Key news
- Exhibit 102: Cisco Systems Inc. - Key offerings
- Exhibit 103: Cisco Systems Inc. - Segment focus
- 10.6 Cloudera Inc.
- Exhibit 104: Cloudera Inc. - Overview
- Exhibit 105: Cloudera Inc. - Business segments
- Exhibit 106: Cloudera Inc. - Key offerings
- Exhibit 107: Cloudera Inc. - Segment focus
- 10.7 Cognizant Technology Solutions Corp.
- Exhibit 108: Cognizant Technology Solutions Corp. - Overview
- Exhibit 109: Cognizant Technology Solutions Corp. - Business segments
- Exhibit 110: Cognizant Technology Solutions Corp. - Key news
- Exhibit 111: Cognizant Technology Solutions Corp. - Key offerings
- Exhibit 112: Cognizant Technology Solutions Corp. - Segment focus
- 10.8 Couchbase Inc.
- Exhibit 113: Couchbase Inc. - Overview
- Exhibit 114: Couchbase Inc. - Key offerings
- 10.9 Dell Technologies Inc.
- Exhibit 115: Dell Technologies Inc. - Overview
- Exhibit 116: Dell Technologies Inc. - Business segments
- Exhibit 117: Dell Technologies Inc. - Key news
- Exhibit 118: Dell Technologies Inc. - Key offerings
- Exhibit 119: Dell Technologies Inc. - Segment focus
- 10.10 Health Catalyst Inc.
- Exhibit 120: Health Catalyst Inc. - Overview
- Exhibit 121: Health Catalyst Inc. - Business segments
- Exhibit 122: Health Catalyst Inc. - Key offerings
- Exhibit 123: Health Catalyst Inc. - Segment focus
- 10.11 Hewlett Packard Enterprise Co.
- Exhibit 124: Hewlett Packard Enterprise Co. - Overview
- Exhibit 125: Hewlett Packard Enterprise Co. - Business segments
- Exhibit 126: Hewlett Packard Enterprise Co. - Key news
- Exhibit 127: Hewlett Packard Enterprise Co. - Key offerings
- Exhibit 128: Hewlett Packard Enterprise Co. - Segment focus
- 10.12 Hitachi Vantara LLC
- Exhibit 129: Hitachi Vantara LLC - Overview
- Exhibit 130: Hitachi Vantara LLC - Product / Service
- Exhibit 131: Hitachi Vantara LLC - Key offerings
11 Appendix
- 11.1 Scope of the report
- 11.2 Inclusions and exclusions checklist
- Exhibit 132: Inclusions checklist
- Exhibit 133: Exclusions checklist
- 11.3 Currency conversion rates for US$
- Exhibit 134: Currency conversion rates for US$
- 11.4 Research methodology
- Exhibit 135: Research methodology
- Exhibit 136: Validation techniques employed for market sizing
- Exhibit 137: Information sources
- 11.5 List of abbreviations
- Exhibit 138: List of abbreviations
Technavio is a leading global technology research and advisory company. Their research and analysis focus on emerging market trends and provides actionable insights to help businesses identify market opportunities and develop effective strategies to optimize their market positions.
With over 500 specialized analysts, Technavio's report library consists of more than 17,000 reports and counting, covering 800 technologies, spanning across 50 countries. Their client base consists of enterprises of all sizes, including more than 100 Fortune 500 companies. This growing client base relies on Technavio's comprehensive coverage, extensive research, and actionable market insights to identify opportunities in existing and potential markets and assess their competitive positions within changing market scenarios.
Contacts
Technavio Research
Jesse Maida
Media & Marketing Executive
US: +1 844 364 1100
UK: +44 203 893 3200
Email: media@technavio.com
Website: www.technavio.com/


SOURCE Technavio
© 2024 Benzinga.com. Benzinga does not provide investment advice. All rights reserved.
Trade confidently with insights and alerts from analyst ratings, free reports and breaking news that affects the stocks you care about.

