


NEW YORK, Sept. 27, 2022 /PRNewswire/ -- The "Specialty Pulp and Paper Chemicals Market by Type and Geography - Forecast and Analysis 2022-2026" report has been added to Technavio's offering. With ISO 9001:2015 certification, Technavio is proudly partnering with more than 100 Fortune 500 companies for over 16 years.

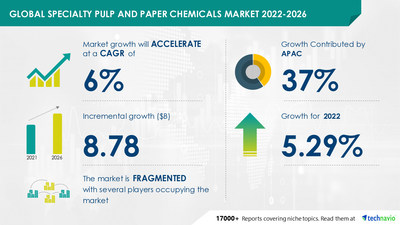
The potential growth difference for the specialty pulp and paper chemicals market between 2021 and 2026 is USD 8.78 billion. To estimate the size of the market, Technavio has considered various factors including the growth rate of consumer markets, adoption rate of specialty pulp and paper chemicals, retail sales of specialty pulp and paper chemicals, and consumer base among others. Understand the scope of the full report. Download PDF Sample Report
- Market Driver
- Market Challenges
The rise in demand for specialty paper is driving the growth of the market. The demand for specialty paper is increasing significantly in emerging markets such as India, China, Brazil, Turkey, Poland, and Russia. This can be attributed to the rise in the use of specialty paper across industries for use in filtration, labeling, and graphic arts. In addition, the rising demand for specialty paper products such as cups, wraps, and bags from quick-service restaurants in the food services sector is also contributing to the overall growth of the global specialty pulp and paper chemicals market.
In addition, the increasing use of recycled fibers will further accelerate market growth. However, the increasing competition among vendors will challenge the growth of the market.
The specialty pulp and paper chemicals market report is segmented by type (functional chemicals, bleaching chemicals, process chemicals, and other chemicals) and geography (APAC, North America, Europe, South America, and the Middle East and Africa).
By type, the market will observe significant growth in the functional chemicals segment during the forecast period. The segment is driven by the increasing demand for functional chemicals such as dyes, pigments, and others for printing and writing purposes.
Similarly, by region, APAC will account for the largest share of the market. About 37% of the market growth will originate from APAC during the forecast period. Factors such as the presence of a large customer base, cheap labor, low cost of infrastructure, low-cost raw materials, and the emergence of e-commerce companies are driving the growth of the regional market.
Identify potential segments to invest in over the forecast period. Read Sample Report Here
The global specialty pulp and paper chemicals market is fragmented due to the presence of several vendors competing for market share. Vendors compete based on several factors, such as quality, price, service, brand image, distribution, and marketing. They are trying to increase their sales by offering personalization options in their products. Some vendors follow the patented process to achieve competitive advantages in the global market. Vendors are also entering into new agreements with commercial end-users to increase their sales volume. The increasing competition among vendors may compel vendors to reduce their product prices, which can negatively impact their profit margins and market growth.
Technavio identifies the following as the dominant players in the market.
- Archroma Management GmbH
- Arkema S.A.
- Ashland Global Holdings Inc.
- BASF SE
- Buckman Laboratories lnternational Inc.
- Croda International Plc
- Ecolab Inc.
- ERCO Worldwide
- Evonik Industries AG
- Imerys S.A.
- INEOS Group Holdings SA
- Kemira Oyj
- Nouryon Chemicals Holding BV
- Novozymes AS
- Robert Specialty Paper Corp.
- Sappi Ltd.
- Solenis LLC
- Solvay SA
- SPCM SA
- The Dow Chemical Co.
- Paper and Paperboard Container and Packaging Market by Product, End-user, and Geography - Forecast and Analysis 2022-2026
- Paper Manufacturing Market by Product and End-user - Forecast and Analysis 2022-2026
Specialty Pulp and Paper Chemicals Market Scope | |
Report Coverage | Details |
Page number | 120 |
Base year | 2021 |
Forecast period | 2022-2026 |
Growth momentum & CAGR | Accelerate at a CAGR of almost 6% |
Market growth 2022-2026 | USD 8.78 billion |
Market structure | Fragmented |
YoY growth (%) | 5.29 |
Regional analysis | APAC, North America, Europe, South America, and Middle East and Africa |
Performing market contribution | APAC at 37% |
Key consumer countries | US, China, Japan, Germany, and Italy |
Competitive landscape | Leading companies, competitive strategies, consumer engagement scope |
Companies profiled | Archroma Management GmbH, Arkema S.A., Ashland Global Holdings Inc., BASF SE, Buckman Laboratories lnternational Inc., Croda International Plc, Ecolab Inc., ERCO Worldwide, Evonik Industries AG, Imerys S.A., INEOS Group Holdings SA, Kemira Oyj, Nouryon Chemicals Holding BV, Novozymes AS, Robert Specialty Paper Corp., Sappi Ltd., Solenis LLC, Solvay SA, SPCM SA, and The Dow Chemical Co. |
Market Dynamics | Parent market analysis, Market growth inducers and obstacles, Fast-growing and slow-growing segment analysis, COVID-19 impact and future consumer dynamics, market condition analysis for forecast period. |
Customization purview | If our report has not included the data that you are looking for, you can reach out to our analysts and get segments customized. |
1 Executive Summary
- 1.1 Market overview
- Exhibit 01: Executive Summary – Chart on Market Overview
- Exhibit 02: Executive Summary – Data Table on Market Overview
- Exhibit 03: Executive Summary – Chart on Global Market Characteristics
- Exhibit 04: Executive Summary – Chart on Market by Geography
- Exhibit 05: Executive Summary – Chart on Market Segmentation by Type
- Exhibit 06: Executive Summary – Chart on Incremental Growth
- Exhibit 07: Executive Summary – Data Table on Incremental Growth
- Exhibit 08: Executive Summary – Chart on Vendor Market Positioning
2 Market Landscape
- 2.1 Market ecosystem
- Exhibit 09: Parent market
- Exhibit 10: Market Characteristics
3 Market Sizing
- 3.1 Market definition
- Exhibit 11: Offerings of vendors included in the market definition
- 3.2 Market segment analysis
- Exhibit 12: Market segments
- 3.3 Market size 2021
- 3.4 Market outlook: Forecast for 2021-2026
- Exhibit 13: Chart on Global - Market size and forecast 2021-2026 ($ million)
- Exhibit 14: Data Table on Global - Market size and forecast 2021-2026 ($ million)
- Exhibit 15: Chart on Global Market: Year-over-year growth 2021-2026 (%)
- Exhibit 16: Data Table on Global Market: Year-over-year growth 2021-2026 (%)
4 Five Forces Analysis
- 4.1 Five forces summary
- Exhibit 17: Five forces analysis - Comparison between 2021 and 2026
- 4.2 Bargaining power of buyers
- Exhibit 18: Chart on Bargaining power of buyers – Impact of key factors 2021 and 2026
- 4.3 Bargaining power of suppliers
- Exhibit 19: Bargaining power of suppliers – Impact of key factors in 2021 and 2026
- 4.4 Threat of new entrants
- Exhibit 20: Threat of new entrants – Impact of key factors in 2021 and 2026
- 4.5 Threat of substitutes
- Exhibit 21: Threat of substitutes – Impact of key factors in 2021 and 2026
- 4.6 Threat of rivalry
- Exhibit 22: Threat of rivalry – Impact of key factors in 2021 and 2026
- 4.7 Market condition
- Exhibit 23: Chart on Market condition - Five forces 2021 and 2026
5 Market Segmentation by Type
- 5.1 Market segments
- Exhibit 24: Chart on Type - Market share 2021-2026 (%)
- Exhibit 25: Data Table on Type - Market share 2021-2026 (%)
- 5.2 Comparison by Type
- Exhibit 26: Chart on Comparison by Type
- Exhibit 27: Data Table on Comparison by Type
- 5.3 Functional chemicals - Market size and forecast 2021-2026
- Exhibit 28: Chart on Functional chemicals - Market size and forecast 2021-2026 ($ million)
- Exhibit 29: Data Table on Functional chemicals - Market size and forecast 2021-2026 ($ million)
- Exhibit 30: Chart on Functional chemicals - Year-over-year growth 2021-2026 (%)
- Exhibit 31: Data Table on Functional chemicals - Year-over-year growth 2021-2026 (%)
- 5.4 Bleaching chemicals - Market size and forecast 2021-2026
- Exhibit 32: Chart on Bleaching chemicals - Market size and forecast 2021-2026 ($ million)
- Exhibit 33: Data Table on Bleaching chemicals - Market size and forecast 2021-2026 ($ million)
- Exhibit 34: Chart on Bleaching chemicals - Year-over-year growth 2021-2026 (%)
- Exhibit 35: Data Table on Bleaching chemicals - Year-over-year growth 2021-2026 (%)
- 5.5 Process chemicals - Market size and forecast 2021-2026
- Exhibit 36: Chart on Process chemicals - Market size and forecast 2021-2026 ($ million)
- Exhibit 37: Data Table on Process chemicals - Market size and forecast 2021-2026 ($ million)
- Exhibit 38: Chart on Process chemicals - Year-over-year growth 2021-2026 (%)
- Exhibit 39: Data Table on Process chemicals - Year-over-year growth 2021-2026 (%)
- 5.6 Other chemicals - Market size and forecast 2021-2026
- Exhibit 40: Chart on Other chemicals - Market size and forecast 2021-2026 ($ million)
- Exhibit 41: Data Table on Other chemicals - Market size and forecast 2021-2026 ($ million)
- Exhibit 42: Chart on Other chemicals - Year-over-year growth 2021-2026 (%)
- Exhibit 43: Data Table on Other chemicals - Year-over-year growth 2021-2026 (%)
- 5.7 Market opportunity by Type
- Exhibit 44: Market opportunity by Type ($ million)
6 Customer Landscape
- 6.1 Customer landscape overview
- Exhibit 45: Analysis of price sensitivity, lifecycle, customer purchase basket, adoption rates, and purchase criteria
7 Geographic Landscape
- 7.1 Geographic segmentation
- Exhibit 46: Chart on Market share by geography 2021-2026 (%)
- Exhibit 47: Data Table on Market share by geography 2021-2026 (%)
- 7.2 Geographic comparison
- Exhibit 48: Chart on Geographic comparison
- Exhibit 49: Data Table on Geographic comparison
- 7.3 APAC - Market size and forecast 2021-2026
- Exhibit 50: Chart on APAC - Market size and forecast 2021-2026 ($ million)
- Exhibit 51: Data Table on APAC - Market size and forecast 2021-2026 ($ million)
- Exhibit 52: Chart on APAC - Year-over-year growth 2021-2026 (%)
- Exhibit 53: Data Table on APAC - Year-over-year growth 2021-2026 (%)
- 7.4 North America - Market size and forecast 2021-2026
- Exhibit 54: Chart on North America - Market size and forecast 2021-2026 ($ million)
- Exhibit 55: Data Table on North America - Market size and forecast 2021-2026 ($ million)
- Exhibit 56: Chart on North America - Year-over-year growth 2021-2026 (%)
- Exhibit 57: Data Table on North America - Year-over-year growth 2021-2026 (%)
- 7.5 Europe - Market size and forecast 2021-2026
- Exhibit 58: Chart on Europe - Market size and forecast 2021-2026 ($ million)
- Exhibit 59: Data Table on Europe - Market size and forecast 2021-2026 ($ million)
- Exhibit 60: Chart on Europe - Year-over-year growth 2021-2026 (%)
- Exhibit 61: Data Table on Europe - Year-over-year growth 2021-2026 (%)
- 7.6 South America - Market size and forecast 2021-2026
- Exhibit 62: Chart on South America - Market size and forecast 2021-2026 ($ million)
- Exhibit 63: Data Table on South America - Market size and forecast 2021-2026 ($ million)
- Exhibit 64: Chart on South America - Year-over-year growth 2021-2026 (%)
- Exhibit 65: Data Table on South America - Year-over-year growth 2021-2026 (%)
- 7.7 Middle East and Africa - Market size and forecast 2021-2026
- Exhibit 66: Chart on Middle East and Africa - Market size and forecast 2021-2026 ($ million)
- Exhibit 67: Data Table on Middle East and Africa - Market size and forecast 2021-2026 ($ million)
- Exhibit 68: Chart on Middle East and Africa - Year-over-year growth 2021-2026 (%)
- Exhibit 69: Data Table on Middle East and Africa - Year-over-year growth 2021-2026 (%)
- 7.8 US - Market size and forecast 2021-2026
- Exhibit 70: Chart on US - Market size and forecast 2021-2026 ($ million)
- Exhibit 71: Data Table on US - Market size and forecast 2021-2026 ($ million)
- Exhibit 72: Chart on US - Year-over-year growth 2021-2026 (%)
- Exhibit 73: Data Table on US - Year-over-year growth 2021-2026 (%)
- 7.9 China - Market size and forecast 2021-2026
- Exhibit 74: Chart on China - Market size and forecast 2021-2026 ($ million)
- Exhibit 75: Data Table on China - Market size and forecast 2021-2026 ($ million)
- Exhibit 76: Chart on China - Year-over-year growth 2021-2026 (%)
- Exhibit 77: Data Table on China - Year-over-year growth 2021-2026 (%)
- 7.10 Japan - Market size and forecast 2021-2026
- Exhibit 78: Chart on Japan - Market size and forecast 2021-2026 ($ million)
- Exhibit 79: Data Table on Japan - Market size and forecast 2021-2026 ($ million)
- Exhibit 80: Chart on Japan - Year-over-year growth 2021-2026 (%)
- Exhibit 81: Data Table on Japan - Year-over-year growth 2021-2026 (%)
- 7.11 Germany - Market size and forecast 2021-2026
- Exhibit 82: Chart on Germany - Market size and forecast 2021-2026 ($ million)
- Exhibit 83: Data Table on Germany - Market size and forecast 2021-2026 ($ million)
- Exhibit 84: Chart on Germany - Year-over-year growth 2021-2026 (%)
- Exhibit 85: Data Table on Germany - Year-over-year growth 2021-2026 (%)
- 7.12 Italy - Market size and forecast 2021-2026
- Exhibit 86: Chart on Italy - Market size and forecast 2021-2026 ($ million)
- Exhibit 87: Data Table on Italy - Market size and forecast 2021-2026 ($ million)
- Exhibit 88: Chart on Italy - Year-over-year growth 2021-2026 (%)
- Exhibit 89: Data Table on Italy - Year-over-year growth 2021-2026 (%)
- 7.13 Market opportunity by geography
- Exhibit 90: Market opportunity by geography ($ million)
8 Drivers, Challenges, and Trends
- 8.1 Market drivers
- 8.2 Market challenges
- 8.3 Impact of drivers and challenges
- Exhibit 91: Impact of drivers and challenges in 2021 and 2026
- 8.4 Market trends
9 Vendor Landscape
- 9.1 Overview
- 9.2 Vendor landscape
- Exhibit 92: Overview on Criticality of inputs and Factors of differentiation
- 9.3 Landscape disruption
- Exhibit 93: Overview on factors of disruption
- 9.4 Industry risks
- Exhibit 94: Impact of key risks on business
10 Vendor Analysis
- 10.1 Vendors covered
- Exhibit 95: Vendors covered
- 10.2 Market positioning of vendors
- Exhibit 96: Matrix on vendor position and classification
- 10.3 Archroma Management GmbH
- Exhibit 97: Archroma Management GmbH - Overview
- Exhibit 98: Archroma Management GmbH - Product / Service
- Exhibit 99: Archroma Management GmbH - Key offerings
- 10.4 Ashland Global Holdings Inc.
- Exhibit 100: Ashland Global Holdings Inc. - Overview
- Exhibit 101: Ashland Global Holdings Inc. - Business segments
- Exhibit 102: Ashland Global Holdings Inc. - Key news
- Exhibit 103: Ashland Global Holdings Inc. - Key offerings
- Exhibit 104: Ashland Global Holdings Inc. - Segment focus
- 10.5 BASF SE
- Exhibit 105: BASF SE - Overview
- Exhibit 106: BASF SE - Business segments
- Exhibit 107: BASF SE - Key news
- Exhibit 108: BASF SE - Key offerings
- Exhibit 109: BASF SE - Segment focus
- 10.6 Buckman Laboratories lnternational Inc.
- Exhibit 110: Buckman Laboratories lnternational Inc. - Overview
- Exhibit 111: Buckman Laboratories lnternational Inc. - Product / Service
- Exhibit 112: Buckman Laboratories lnternational Inc. - Key news
- Exhibit 113: Buckman Laboratories lnternational Inc. - Key offerings
- 10.7 Ecolab Inc.
- Exhibit 114: Ecolab Inc. - Overview
- Exhibit 115: Ecolab Inc. - Business segments
- Exhibit 116: Ecolab Inc. - Key news
- Exhibit 117: Ecolab Inc. - Key offerings
- Exhibit 118: Ecolab Inc. - Segment focus
- 10.8 Evonik Industries AG
- Exhibit 119: Evonik Industries AG - Overview
- Exhibit 120: Evonik Industries AG - Business segments
- Exhibit 121: Evonik Industries AG - Key news
- Exhibit 122: Evonik Industries AG - Key offerings
- Exhibit 123: Evonik Industries AG - Segment focus
- 10.9 Kemira Oyj
- Exhibit 124: Kemira Oyj - Overview
- Exhibit 125: Kemira Oyj - Business segments
- Exhibit 126: Kemira Oyj - Key news
- Exhibit 127: Kemira Oyj - Key offerings
- Exhibit 128: Kemira Oyj - Segment focus
- 10.10 Novozymes AS
- Exhibit 129: Novozymes AS - Overview
- Exhibit 130: Novozymes AS - Business segments
- Exhibit 131: Novozymes AS - Key news
- Exhibit 132: Novozymes AS - Key offerings
- Exhibit 133: Novozymes AS - Segment focus
- 10.11 Solenis LLC
- Exhibit 134: Solenis LLC - Overview
- Exhibit 135: Solenis LLC - Product / Service
- Exhibit 136: Solenis LLC - Key offerings
- 10.12 The Dow Chemical Co.
- Exhibit 137: The Dow Chemical Co. - Overview
- Exhibit 138: The Dow Chemical Co. - Business segments
- Exhibit 139: The Dow Chemical Co. - Key news
- Exhibit 140: The Dow Chemical Co. - Key offerings
- Exhibit 141: The Dow Chemical Co. - Segment focus
11 Appendix
- 11.1 Scope of the report
- 11.2 Inclusions and exclusions checklist
- Exhibit 142: Inclusions checklist
- Exhibit 143: Exclusions checklist
- 11.3 Currency conversion rates for US$
- Exhibit 144: Currency conversion rates for US$
- 11.4 Research methodology
- Exhibit 145: Research methodology
- Exhibit 146: Validation techniques employed for market sizing
- Exhibit 147: Information sources
- 11.5 List of abbreviations
- Exhibit 148: List of abbreviations
Technavio is a leading global technology research and advisory company. Their research and analysis focuses on emerging market trends and provides actionable insights to help businesses identify market opportunities and develop effective strategies to optimize their market positions.
With over 500 specialized analysts, Technavio's report library consists of more than 17,000 reports and counting, covering 800 technologies, spanning across 50 countries. Their client base consists of enterprises of all sizes, including more than 100 Fortune 500 companies. This growing client base relies on Technavio's comprehensive coverage, extensive research, and actionable market insights to identify opportunities in existing and potential markets and assess their competitive positions within changing market scenarios.
Contact
Technavio Research
Jesse Maida
Media & Marketing Executive
US: +1 844 364 1100
UK: +44 203 893 3200
Email:media@technavio.com
Website: www.technavio.com/


SOURCE Technavio
© 2024 Benzinga.com. Benzinga does not provide investment advice. All rights reserved.
Trade confidently with insights and alerts from analyst ratings, free reports and breaking news that affects the stocks you care about.

