


NEW YORK, Sept. 26, 2022 /PRNewswire/ -- The global ophthalmology devices market has been categorized as a part of the global healthcare equipment market. The parent market, the global healthcare equipment market, covers products and companies engaged in the R&D of a variety of product categories, including capital equipment, instruments, implants, accessories, and consumables that are used for the diagnosis, monitoring, and treatment of various diseases.

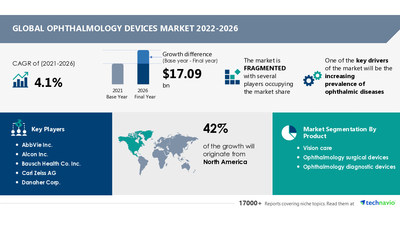
The ophthalmology devices market size is expected to grow by USD 17.09 billion from 2021 to 2026. In addition, the growth momentum of the market will accelerate at a CAGR of 4.1% during the forecast period, according to Technavio.
The report offers an up-to-date analysis regarding the current market scenario, latest trends and drivers, and the overall market environment. Request Latest FREE PDF Sample Report
Ophthalmology Devices Market 2022-2026: Scope
The ophthalmology devices market report covers the following areas:
- Ophthalmology Devices Market Size
- Ophthalmology Devices Market Trends
- Ophthalmology Devices Market Industry Analysis
Ophthalmology Devices Market 2022-2026: Vendor Landscape
The ophthalmology devices market is fragmented. Vendors are deploying growth strategies such as organic and inorganic strategies to compete in the market. The market has several major market players. Prominent vendors are developing new devices with upgraded technologies to compete with existing vendors in the market. Some vendors are entering into partnerships to establish their market position globally. The competition in the market will intensify, with the rise in the number of ophthalmic disorders. Vendors are investing in developing customized solutions to expand their foothold in the market.
AbbVie Inc., Alcon Inc., Bausch Health Co. Inc., Carl Zeiss AG, Danaher Corp., Digital Diagnostics Inc., EssilorLuxottica, EyeQue Corp., Glaukos Corp, HOYA Corp., IRIDEX Corp., Johnson and Johnson, LENSAR Inc., Lumenis Ltd., LUMIBIRD SA, Metall Zug AG, NIDEK Co. Ltd, STAAR Surgical Co., The Cooper Companies Inc., and Ziemer Ophthalmic Systems AG are among some of the major market participants.
Ophthalmology Devices Market 2022-2026: Segmentation
- Product
- Vision Care
- Ophthalmology Surgical Devices
- Ophthalmology Diagnostic Devices
- Geography
- North America
- Europe
- Asia
- The Rest Of The World (ROW)
- End-user
- Hospitals And Clinics
- ASCs And Physicians
- Offices
- Optical Retailers
Ophthalmology Devices Market 2022-2026: Revenue-generating Product Segments
The vision care segment will be the largest contributor to market growth during the forecast period. Spectacle lenses that are made of high-tech plastics are more resistant to scratches than conventional plastics. In addition, high-definition (HD) spectacle lenses can be customized for individuals. Thus, the rising investments in marketing and product promotions by vendors are driving the market growth.
Ophthalmology Devices Market 2022-2026: Regional Analysis
North America will account for 42% of the market's growth during the forecast period. The growth of this region is attributed to factors such as the increasing healthcare expenditure on ocular diseases, the rising number of product approvals, and the growing adoption of technologically advanced ophthalmology devices. Moreover, market growth in this region will be slower than the growth of the market in other regions. The US is the key country for the ophthalmology devices market in North America.
Learn about the contribution of each region summarized in concise infographics and thorough descriptions. View a FREE PDF Sample Report
Ophthalmology Devices Market 2022-2026: Key Highlights
- CAGR of the market during 2022-2026
- Detailed information about factors that will assist ophthalmology devices market growth during the next five years
- Approximation of the ophthalmology devices market size and its contribution to the parent market
- Forecasts on upcoming trends and changes in consumer behavior
- The growth of the ophthalmology devices market
- Analysis of the market's competitive landscape and detailed information on vendors
- Comprehensive details of factors that will challenge the growth of ophthalmology devices market vendors
Related Reports
Ophthalmology Surgical Devices Market by Product and Geography - Forecast and Analysis 2022-2026: The ophthalmology surgical devices market share is expected to increase by USD 3.13 billion from 2021 to 2026.
Synoptophore Market by Application and Geography - Forecast and Analysis 2022-2026: The synoptophore market share is expected to increase by USD 62.28 million from 2021 to 2026.
Ophthalmology Devices Market Scope | |
Report Coverage | Details |
Page number | 120 |
Base year | 2021 |
Forecast period | 2022-2026 |
Growth momentum & CAGR | Accelerate at a CAGR of 4.1% |
Market growth 2022-2026 | USD 17.09 billion |
Market structure | Fragmented |
YoY growth (%) | 3.51 |
Regional analysis | North America, Europe, Asia, and Rest of World (ROW) |
Performing market contribution | North America at 42% |
Key consumer countries | US, Canada, Germany, UK, and China |
Competitive landscape | Leading companies, competitive strategies, consumer engagement scope |
Companies profiled | AbbVie Inc., Alcon Inc., Bausch Health Co. Inc., Carl Zeiss AG, Danaher Corp., Digital Diagnostics Inc., EssilorLuxottica, EyeQue Corp., Glaukos Corp, HOYA Corp., IRIDEX Corp., Johnson and Johnson, LENSAR Inc., Lumenis Ltd., LUMIBIRD SA, Metall Zug AG, NIDEK Co. Ltd, STAAR Surgical Co., The Cooper Companies Inc., and Ziemer Ophthalmic Systems AG |
Market Dynamics | Parent market analysis, market growth inducers and obstacles, fast-growing and slow-growing segment analysis, COVID-19 impact and future consumer dynamics, and market condition analysis for the forecast period. |
Customization purview | If our report has not included the data that you are looking for, you can reach out to our analysts and get segments customized. |
Browse Health Care Market Reports
Table of Contents
1 Executive Summary
- 1.1 Market overview
- Exhibit 01: Executive Summary – Chart on Market Overview
- Exhibit 02: Executive Summary – Data Table on Market Overview
- Exhibit 03: Executive Summary – Chart on Global Market Characteristics
- Exhibit 04: Executive Summary – Chart on Market by Geography
- Exhibit 05: Executive Summary – Chart on Market Segmentation by Product
- Exhibit 06: Executive Summary – Chart on Incremental Growth
- Exhibit 07: Executive Summary – Data Table on Incremental Growth
- Exhibit 08: Executive Summary – Chart on Vendor Market Positioning
2 Market Landscape
- 2.1 Market ecosystem
- Exhibit 09: Parent market
- Exhibit 10: Market Characteristics
3 Market Sizing
- 3.1 Market definition
- Exhibit 11: Offerings of vendors included in the market definition
- 3.2 Market segment analysis
- Exhibit 12: Market segments
- 3.3 Market size 2021
- 3.4 Market outlook: Forecast for 2021-2026
- Exhibit 13: Chart on Global - Market size and forecast 2021-2026 ($ billion)
- Exhibit 14: Data Table on Global - Market size and forecast 2021-2026 ($ billion)
- Exhibit 15: Chart on Global Market: Year-over-year growth 2021-2026 (%)
- Exhibit 16: Data Table on Global Market: Year-over-year growth 2021-2026 (%)
4 Five Forces Analysis
- 4.1 Five forces summary
- Exhibit 17: Five forces analysis - Comparison between 2021 and 2026
- 4.2 Bargaining power of buyers
- Exhibit 18: Chart on Bargaining power of buyers – Impact of key factors 2021 and 2026
- 4.3 Bargaining power of suppliers
- Exhibit 19: Bargaining power of suppliers – Impact of key factors in 2021 and 2026
- 4.4 Threat of new entrants
- Exhibit 20: Threat of new entrants – Impact of key factors in 2021 and 2026
- 4.5 Threat of substitutes
- Exhibit 21: Threat of substitutes – Impact of key factors in 2021 and 2026
- 4.6 Threat of rivalry
- Exhibit 22: Threat of rivalry – Impact of key factors in 2021 and 2026
- 4.7 Market condition
- Exhibit 23: Chart on Market condition - Five forces 2021 and 2026
5 Market Segmentation by Product
- 5.1 Market segments
- Exhibit 24: Chart on Product - Market share 2021-2026 (%)
- Exhibit 25: Data Table on Product - Market share 2021-2026 (%)
- 5.2 Comparison by Product
- Exhibit 26: Chart on Comparison by Product
- Exhibit 27: Data Table on Comparison by Product
- 5.3 Vision care - Market size and forecast 2021-2026
- Exhibit 28: Chart on Vision care - Market size and forecast 2021-2026 ($ billion)
- Exhibit 29: Data Table on Vision care - Market size and forecast 2021-2026 ($ billion)
- Exhibit 30: Chart on Vision care - Year-over-year growth 2021-2026 (%)
- Exhibit 31: Data Table on Vision care - Year-over-year growth 2021-2026 (%)
- 5.4 Ophthalmology surgical devices - Market size and forecast 2021-2026
- Exhibit 32: Chart on Ophthalmology surgical devices - Market size and forecast 2021-2026 ($ billion)
- Exhibit 33: Data Table on Ophthalmology surgical devices - Market size and forecast 2021-2026 ($ billion)
- Exhibit 34: Chart on Ophthalmology surgical devices - Year-over-year growth 2021-2026 (%)
- Exhibit 35: Data Table on Ophthalmology surgical devices - Year-over-year growth 2021-2026 (%)
- 5.5 Ophthalmology diagnostic devices - Market size and forecast 2021-2026
- Exhibit 36: Chart on Ophthalmology diagnostic devices - Market size and forecast 2021-2026 ($ billion)
- Exhibit 37: Data Table on Ophthalmology diagnostic devices - Market size and forecast 2021-2026 ($ billion)
- Exhibit 38: Chart on Ophthalmology diagnostic devices - Year-over-year growth 2021-2026 (%)
- Exhibit 39: Data Table on Ophthalmology diagnostic devices - Year-over-year growth 2021-2026 (%)
- 5.6 Market opportunity by Product
- Exhibit 40: Market opportunity by Product ($ billion)
6 Customer Landscape
- 6.1 Customer landscape overview
- Exhibit 41: Analysis of price sensitivity, lifecycle, customer purchase basket, adoption rates, and purchase criteria
7 Geographic Landscape
- 7.1 Geographic segmentation
- Exhibit 42: Chart on Market share by geography 2021-2026 (%)
- Exhibit 43: Data Table on Market share by geography 2021-2026 (%)
- 7.2 Geographic comparison
- Exhibit 44: Chart on Geographic comparison
- Exhibit 45: Data Table on Geographic comparison
- 7.3 North America - Market size and forecast 2021-2026
- Exhibit 46: Chart on North America - Market size and forecast 2021-2026 ($ billion)
- Exhibit 47: Data Table on North America - Market size and forecast 2021-2026 ($ billion)
- Exhibit 48: Chart on North America - Year-over-year growth 2021-2026 (%)
- Exhibit 49: Data Table on North America - Year-over-year growth 2021-2026 (%)
- 7.4 Europe - Market size and forecast 2021-2026
- Exhibit 50: Chart on Europe - Market size and forecast 2021-2026 ($ billion)
- Exhibit 51: Data Table on Europe - Market size and forecast 2021-2026 ($ billion)
- Exhibit 52: Chart on Europe - Year-over-year growth 2021-2026 (%)
- Exhibit 53: Data Table on Europe - Year-over-year growth 2021-2026 (%)
- 7.5 Asia - Market size and forecast 2021-2026
- Exhibit 54: Chart on Asia - Market size and forecast 2021-2026 ($ billion)
- Exhibit 55: Data Table on Asia - Market size and forecast 2021-2026 ($ billion)
- Exhibit 56: Chart on Asia - Year-over-year growth 2021-2026 (%)
- Exhibit 57: Data Table on Asia - Year-over-year growth 2021-2026 (%)
- 7.6 Rest of World (ROW) - Market size and forecast 2021-2026
- Exhibit 58: Chart on Rest of World (ROW) - Market size and forecast 2021-2026 ($ billion)
- Exhibit 59: Data Table on Rest of World (ROW) - Market size and forecast 2021-2026 ($ billion)
- Exhibit 60: Chart on Rest of World (ROW) - Year-over-year growth 2021-2026 (%)
- Exhibit 61: Data Table on Rest of World (ROW) - Year-over-year growth 2021-2026 (%)
- 7.7 US - Market size and forecast 2021-2026
- Exhibit 62: Chart on US - Market size and forecast 2021-2026 ($ billion)
- Exhibit 63: Data Table on US - Market size and forecast 2021-2026 ($ billion)
- Exhibit 64: Chart on US - Year-over-year growth 2021-2026 (%)
- Exhibit 65: Data Table on US - Year-over-year growth 2021-2026 (%)
- 7.8 Germany - Market size and forecast 2021-2026
- Exhibit 66: Chart on Germany - Market size and forecast 2021-2026 ($ billion)
- Exhibit 67: Data Table on Germany - Market size and forecast 2021-2026 ($ billion)
- Exhibit 68: Chart on Germany - Year-over-year growth 2021-2026 (%)
- Exhibit 69: Data Table on Germany - Year-over-year growth 2021-2026 (%)
- 7.9 UK - Market size and forecast 2021-2026
- Exhibit 70: Chart on UK - Market size and forecast 2021-2026 ($ billion)
- Exhibit 71: Data Table on UK - Market size and forecast 2021-2026 ($ billion)
- Exhibit 72: Chart on UK - Year-over-year growth 2021-2026 (%)
- Exhibit 73: Data Table on UK - Year-over-year growth 2021-2026 (%)
- 7.10 China - Market size and forecast 2021-2026
- Exhibit 74: Chart on China - Market size and forecast 2021-2026 ($ billion)
- Exhibit 75: Data Table on China - Market size and forecast 2021-2026 ($ billion)
- Exhibit 76: Chart on China - Year-over-year growth 2021-2026 (%)
- Exhibit 77: Data Table on China - Year-over-year growth 2021-2026 (%)
- 7.11 Canada - Market size and forecast 2021-2026
- Exhibit 78: Chart on Canada - Market size and forecast 2021-2026 ($ billion)
- Exhibit 79: Data Table on Canada - Market size and forecast 2021-2026 ($ billion)
- Exhibit 80: Chart on Canada - Year-over-year growth 2021-2026 (%)
- Exhibit 81: Data Table on Canada - Year-over-year growth 2021-2026 (%)
- 7.12 Market opportunity by geography
- Exhibit 82: Market opportunity by geography ($ billion)
8 Drivers, Challenges, and Trends
- 8.1 Market drivers
- 8.2 Market challenges
- 8.3 Impact of drivers and challenges
- Exhibit 83: Impact of drivers and challenges in 2021 and 2026
- 8.4 Market trends
9 Vendor Landscape
- 9.1 Overview
- 9.2 Vendor landscape
- Exhibit 84: Overview on Criticality of inputs and Factors of differentiation
- 9.3 Landscape disruption
- Exhibit 85: Overview on factors of disruption
- 9.4 Industry risks
- Exhibit 86: Impact of key risks on business
10 Vendor Analysis
- 10.1 Vendors covered
- Exhibit 87: Vendors covered
- 10.2 Market positioning of vendors
- Exhibit 88: Matrix on vendor position and classification
- 10.3 AbbVie Inc.
- Exhibit 89: AbbVie Inc. - Overview
- Exhibit 90: AbbVie Inc. - Product / Service
- Exhibit 91: AbbVie Inc. - Key offerings
- 10.4 Alcon Inc.
- Exhibit 92: Alcon Inc. - Overview
- Exhibit 93: Alcon Inc. - Business segments
- Exhibit 94: Alcon Inc. - Key offerings
- Exhibit 95: Alcon Inc. - Segment focus
- 10.5 Bausch Health Co. Inc.
- Exhibit 96: Bausch Health Co. Inc. - Overview
- Exhibit 97: Bausch Health Co. Inc. - Business segments
- Exhibit 98: Bausch Health Co. Inc. - Key news
- Exhibit 99: Bausch Health Co. Inc. - Key offerings
- Exhibit 100: Bausch Health Co. Inc. - Segment focus
- 10.6 Carl Zeiss AG
- Exhibit 101: Carl Zeiss AG - Overview
- Exhibit 102: Carl Zeiss AG - Business segments
- Exhibit 103: Carl Zeiss AG - Key offerings
- Exhibit 104: Carl Zeiss AG - Segment focus
- 10.7 Danaher Corp.
- Exhibit 105: Danaher Corp. - Overview
- Exhibit 106: Danaher Corp. - Business segments
- Exhibit 107: Danaher Corp. - Key news
- Exhibit 108: Danaher Corp. - Key offerings
- Exhibit 109: Danaher Corp. - Segment focus
- 10.8 EssilorLuxottica
- Exhibit 110: EssilorLuxottica - Overview
- Exhibit 111: EssilorLuxottica - Business segments
- Exhibit 112: EssilorLuxottica - Key offerings
- Exhibit 113: EssilorLuxottica - Segment focus
- 10.9 HOYA Corp.
- Exhibit 114: HOYA Corp. - Overview
- Exhibit 115: HOYA Corp. - Business segments
- Exhibit 116: HOYA Corp. - Key offerings
- Exhibit 117: HOYA Corp. - Segment focus
- 10.10 Johnson and Johnson
- Exhibit 118: Johnson and Johnson - Overview
- Exhibit 119: Johnson and Johnson - Business segments
- Exhibit 120: Johnson and Johnson - Key news
- Exhibit 121: Johnson and Johnson - Key offerings
- Exhibit 122: Johnson and Johnson - Segment focus
- 10.11 NIDEK Co. Ltd
- Exhibit 123: NIDEK Co. Ltd - Overview
- Exhibit 124: NIDEK Co. Ltd - Business segments
- Exhibit 125: NIDEK Co. Ltd - Key news
- Exhibit 126: NIDEK Co. Ltd - Key offerings
- Exhibit 127: NIDEK Co. Ltd - Segment focus
- 10.12 The Cooper Companies Inc.
- Exhibit 128: The Cooper Companies Inc. - Overview
- Exhibit 129: The Cooper Companies Inc. - Business segments
- Exhibit 130: The Cooper Companies Inc. - Key offerings
- Exhibit 131: The Cooper Companies Inc. - Segment focus
11 Appendix
- 11.1 Scope of the report
- 11.2 Inclusions and exclusions checklist
- Exhibit 132: Inclusions checklist
- Exhibit 133: Exclusions checklist
- 11.3 Currency conversion rates for US$
- Exhibit 134: Currency conversion rates for US$
- 11.4 Research methodology
- Exhibit 135: Research methodology
- Exhibit 136: Validation techniques employed for market sizing
- Exhibit 137: Information sources
- 11.5 List of abbreviations
- Exhibit 138: List of abbreviations
Technavio is a leading global technology research and advisory company. Their research and analysis focus on emerging market trends and provide actionable insights to help businesses identify market opportunities and develop effective strategies to optimize their market positions. With over 500 specialized analysts, Technavio's report library consists of more than 17,000 reports and counting, covering 800 technologies, spanning across 50 countries. Their client base consists of enterprises of all sizes, including more than 100 Fortune 500 companies. This growing client base relies on Technavio's comprehensive coverage, extensive research, and actionable market insights to identify opportunities in existing and potential markets and assess their competitive positions within changing market scenarios.
Contact
Technavio Research
Jesse Maida
Media & Marketing Executive
US: +1 844 364 1100
UK: +44 203 893 3200
Email: media@technavio.com
Website: www.technavio.com/


SOURCE Technavio
© 2024 Benzinga.com. Benzinga does not provide investment advice. All rights reserved.
Trade confidently with insights and alerts from analyst ratings, free reports and breaking news that affects the stocks you care about.

