


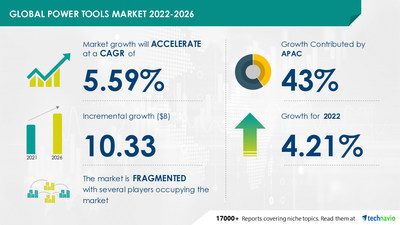
NEW YORK, Sept. 26, 2022 /PRNewswire/ -- The "Power Tools Market by Technology (Electric, Pneumatic, And Others) and Geography (North America, Europe, APAC, Middle East and Africa, and South America) - Forecast and Analysis 2022-2026" report has been added to Technavio's offering. The potential growth difference for the power tools market size between 2021 and 2026 is USD 10.33 billion. To get the exact CAGR and the Y-O-Y growth rate, Request a FREE PDF Sample Report

The increase in global construction and infrastructure development activities is driving the growth of the market. The construction industry is a major user of power tools. They are used to carry out operations such as drilling, cutting, and grinding. The growth in construction activities will have a positive impact on the growth of the global power tools market. The rising demand for public infrastructure in emerging markets such as Russia, Brazil, China, India, and South Africa is also driving the market growth.
Technavio has identified key trends, drivers, and challenges in the market, which will help vendors improve their strategies to stay ahead of their competitors. View our FREE PDF Sample Report
By technology, the electric segment will be the largest contributor to market growth during the forecast period. The popularity of electric power tools has increased owing to their advantages in terms of form, size, and convenience. Moreover, the demand for cordless, battery-driven power tools is driving the growth of the electric power tools market during the forecast period. In addition, electric power tools are considered environment-friendly and energy-efficient.
By geography, APAC will dominate the market with 43% of the market's growth during the forecast period. This growth is attributed to factors such as slow growth in the automotive industry, an increase in the rise in residential construction activities, and high demand from the aerospace industry. Moreover, this region will grow at a faster rate than other regions. Japan and China are the key countries for the power tools market in APAC.
View our FREE PDF Sample Report for additional insights into the contribution of all the segments and regional opportunities in the report
ANDREAS STIHL AG and Co. KG, Atlas Copco AB, Apex Tool Group LLC, C. and E. Fein GmbH, CHERVON China Trading Co. Ltd., Evolution Power Tools Ltd, Emerson Electric Co., Illinois Tool Works Inc. Group Silverline Ltd, Hilti Corp., JPW Industries Inc., Koki Holdings Co. Ltd., Makita USA Inc., Nemo Power Tools Ltd., Panasonic Corp, Positec Tool Corp, Robert Bosch GmbH, Snap On Inc., Stanley Black and Decker Inc., Techtronic Industries Co. Ltd., among others, are the main players operating in the market. The key offerings of some of these vendors are listed below:
- ANDREAS STIHL AG and Co. KG - The company offers power tools that include cordless chainsaws used for cutting firewood, grounds maintenance, horticulture, and indoor sawing work.
- Apex Tool Group LLC - The company offers power tools that improve operator safety while minimizing marring, scratching, and damage.
- Atlas Copco AB - The company offers power tools such as pistol cordless screwdriver and cordless nutrunner.
- Emerson Electric Co. - The company offers power tools that include pneumatics, bench and stationary, corded power tools, cordless power tools, and tile saws.
- Illinois Tool Works Inc. - The company offers power tools that improve contractor productivity and building quality in residential and commercial construction.
Want your report customized? Speak to an analyst and personalize your report according to your needs
Cordless Power Tools Market by End-user and Geography - Forecast and Analysis 2021-2025: The cordless power tools market share is expected to increase by USD 6.17 billion from 2021 to 2025.
Power Tools Market in Europe by Technology, Application, and Geography - Forecast and Analysis 2021-2025: The power tools market share in Europe is expected to increase by USD 1.59 billion from 2020 to 2025.
Power Tools Market Scope | |
Report Coverage | Details |
Page number | 120 |
Base year | 2021 |
Forecast period | 2022-2026 |
Growth momentum & CAGR | Accelerate at a CAGR of 5.59% |
Market growth 2022-2026 | USD 10.33 billion |
Market structure | Fragmented |
YoY growth (%) | 4.21 |
Regional analysis | North America, Europe, APAC, Middle East and Africa, and South America |
Performing market contribution | APAC at 43% |
Key consumer countries | US, China, Japan, Germany, and France |
Competitive landscape | Leading companies, competitive strategies, consumer engagement scope |
Companies profiled | ANDREAS STIHL AG and Co. KG, Apex Tool Group LLC, Atlas Copco AB, C. and E. Fein GmbH, CHERVON China Trading Co. Ltd., Emerson Electric Co., Evolution Power Tools Ltd, Group Silverline Ltd, Hilti Corp., Illinois Tool Works Inc., JPW Industries Inc., Koki Holdings Co. Ltd., Makita USA Inc., Nemo Power Tools Ltd., Panasonic Corp, Positec Tool Corp, Robert Bosch GmbH, Snap On Inc., Stanley Black and Decker Inc., and Techtronic Industries Co. Ltd. |
Market Dynamics | Parent market analysis, market growth inducers and obstacles, fast-growing and slow-growing segment analysis, COVID-19 impact and future consumer dynamics, and market condition analysis for the forecast period. |
Customization purview | If our report has not included the data that you are looking for, you can reach out to our analysts and get segments customized. |
Browse for Industrials Market Reports
1 Executive Summary
- 1.1 Market overview
- Exhibit 01: Executive Summary – Chart on Market Overview
- Exhibit 02: Executive Summary – Data Table on Market Overview
- Exhibit 03: Executive Summary – Chart on Global Market Characteristics
- Exhibit 04: Executive Summary – Chart on Market by Geography
- Exhibit 05: Executive Summary – Chart on Market Segmentation by Technology
- Exhibit 06: Executive Summary – Chart on Incremental Growth
- Exhibit 07: Executive Summary – Data Table on Incremental Growth
- Exhibit 08: Executive Summary – Chart on Vendor Market Positioning
2 Market Landscape
- 2.1 Market ecosystem
- Exhibit 09: Parent market
- Exhibit 10: Market Characteristics
3 Market Sizing
- 3.1 Market definition
- Exhibit 11: Offerings of vendors included in the market definition
- 3.2 Market segment analysis
- Exhibit 12: Market segments
- 3.3 Market size 2021
- 3.4 Market outlook: Forecast for 2021-2026
- Exhibit 13: Chart on Global - Market size and forecast 2021-2026 ($ million)
- Exhibit 14: Data Table on Global - Market size and forecast 2021-2026 ($ million)
- Exhibit 15: Chart on Global Market: Year-over-year growth 2021-2026 (%)
- Exhibit 16: Data Table on Global Market: Year-over-year growth 2021-2026 (%)
4 Five Forces Analysis
- 4.1 Five forces summary
- Exhibit 17: Five forces analysis - Comparison between 2021 and 2026
- 4.2 Bargaining power of buyers
- Exhibit 18: Chart on Bargaining power of buyers – Impact of key factors 2021 and 2026
- 4.3 Bargaining power of suppliers
- Exhibit 19: Bargaining power of suppliers – Impact of key factors in 2021 and 2026
- 4.4 Threat of new entrants
- Exhibit 20: Threat of new entrants – Impact of key factors in 2021 and 2026
- 4.5 Threat of substitutes
- Exhibit 21: Threat of substitutes – Impact of key factors in 2021 and 2026
- 4.6 Threat of rivalry
- Exhibit 22: Threat of rivalry – Impact of key factors in 2021 and 2026
- 4.7 Market condition
- Exhibit 23: Chart on Market condition - Five forces 2021 and 2026
5 Market Segmentation by Technology
- 5.1 Market segments
- Exhibit 24: Chart on Technology - Market share 2021-2026 (%)
- Exhibit 25: Data Table on Technology - Market share 2021-2026 (%)
- 5.2 Comparison by Technology
- Exhibit 26: Chart on Comparison by Technology
- Exhibit 27: Data Table on Comparison by Technology
- 5.3 Electric - Market size and forecast 2021-2026
- Exhibit 28: Chart on Electric - Market size and forecast 2021-2026 ($ million)
- Exhibit 29: Data Table on Electric - Market size and forecast 2021-2026 ($ million)
- Exhibit 30: Chart on Electric - Year-over-year growth 2021-2026 (%)
- Exhibit 31: Data Table on Electric - Year-over-year growth 2021-2026 (%)
- 5.4 Pneumatic - Market size and forecast 2021-2026
- Exhibit 32: Chart on Pneumatic - Market size and forecast 2021-2026 ($ million)
- Exhibit 33: Data Table on Pneumatic - Market size and forecast 2021-2026 ($ million)
- Exhibit 34: Chart on Pneumatic - Year-over-year growth 2021-2026 (%)
- Exhibit 35: Data Table on Pneumatic - Year-over-year growth 2021-2026 (%)
- 5.5 Others - Market size and forecast 2021-2026
- Exhibit 36: Chart on Others - Market size and forecast 2021-2026 ($ million)
- Exhibit 37: Data Table on Others - Market size and forecast 2021-2026 ($ million)
- Exhibit 38: Chart on Others - Year-over-year growth 2021-2026 (%)
- Exhibit 39: Data Table on Others - Year-over-year growth 2021-2026 (%)
- 5.6 Market opportunity by Technology
- Exhibit 40: Market opportunity by Technology ($ million)
6 Customer Landscape
- 6.1 Customer landscape overview
- Exhibit 41: Analysis of price sensitivity, lifecycle, customer purchase basket, adoption rates, and purchase criteria
7 Geographic Landscape
- 7.1 Geographic segmentation
- Exhibit 42: Chart on Market share by geography 2021-2026 (%)
- Exhibit 43: Data Table on Market share by geography 2021-2026 (%)
- 7.2 Geographic comparison
- Exhibit 44: Chart on Geographic comparison
- Exhibit 45: Data Table on Geographic comparison
- 7.3 North America - Market size and forecast 2021-2026
- Exhibit 46: Chart on North America - Market size and forecast 2021-2026 ($ million)
- Exhibit 47: Data Table on North America - Market size and forecast 2021-2026 ($ million)
- Exhibit 48: Chart on North America - Year-over-year growth 2021-2026 (%)
- Exhibit 49: Data Table on North America - Year-over-year growth 2021-2026 (%)
- 7.4 Europe - Market size and forecast 2021-2026
- Exhibit 50: Chart on Europe - Market size and forecast 2021-2026 ($ million)
- Exhibit 51: Data Table on Europe - Market size and forecast 2021-2026 ($ million)
- Exhibit 52: Chart on Europe - Year-over-year growth 2021-2026 (%)
- Exhibit 53: Data Table on Europe - Year-over-year growth 2021-2026 (%)
- 7.5 APAC - Market size and forecast 2021-2026
- Exhibit 54: Chart on APAC - Market size and forecast 2021-2026 ($ million)
- Exhibit 55: Data Table on APAC - Market size and forecast 2021-2026 ($ million)
- Exhibit 56: Chart on APAC - Year-over-year growth 2021-2026 (%)
- Exhibit 57: Data Table on APAC - Year-over-year growth 2021-2026 (%)
- 7.6 Middle East and Africa - Market size and forecast 2021-2026
- Exhibit 58: Chart on Middle East and Africa - Market size and forecast 2021-2026 ($ million)
- Exhibit 59: Data Table on Middle East and Africa - Market size and forecast 2021-2026 ($ million)
- Exhibit 60: Chart on Middle East and Africa - Year-over-year growth 2021-2026 (%)
- Exhibit 61: Data Table on Middle East and Africa - Year-over-year growth 2021-2026 (%)
- 7.7 South America - Market size and forecast 2021-2026
- Exhibit 62: Chart on South America - Market size and forecast 2021-2026 ($ million)
- Exhibit 63: Data Table on South America - Market size and forecast 2021-2026 ($ million)
- Exhibit 64: Chart on South America - Year-over-year growth 2021-2026 (%)
- Exhibit 65: Data Table on South America - Year-over-year growth 2021-2026 (%)
- 7.8 US - Market size and forecast 2021-2026
- Exhibit 66: Chart on US - Market size and forecast 2021-2026 ($ million)
- Exhibit 67: Data Table on US - Market size and forecast 2021-2026 ($ million)
- Exhibit 68: Chart on US - Year-over-year growth 2021-2026 (%)
- Exhibit 69: Data Table on US - Year-over-year growth 2021-2026 (%)
- 7.9 China - Market size and forecast 2021-2026
- Exhibit 70: Chart on China - Market size and forecast 2021-2026 ($ million)
- Exhibit 71: Data Table on China - Market size and forecast 2021-2026 ($ million)
- Exhibit 72: Chart on China - Year-over-year growth 2021-2026 (%)
- Exhibit 73: Data Table on China - Year-over-year growth 2021-2026 (%)
- 7.10 Japan - Market size and forecast 2021-2026
- Exhibit 74: Chart on Japan - Market size and forecast 2021-2026 ($ million)
- Exhibit 75: Data Table on Japan - Market size and forecast 2021-2026 ($ million)
- Exhibit 76: Chart on Japan - Year-over-year growth 2021-2026 (%)
- Exhibit 77: Data Table on Japan - Year-over-year growth 2021-2026 (%)
- 7.11 Germany - Market size and forecast 2021-2026
- Exhibit 78: Chart on Germany - Market size and forecast 2021-2026 ($ million)
- Exhibit 79: Data Table on Germany - Market size and forecast 2021-2026 ($ million)
- Exhibit 80: Chart on Germany - Year-over-year growth 2021-2026 (%)
- Exhibit 81: Data Table on Germany - Year-over-year growth 2021-2026 (%)
- 7.12 France - Market size and forecast 2021-2026
- Exhibit 82: Chart on France - Market size and forecast 2021-2026 ($ million)
- Exhibit 83: Data Table on France - Market size and forecast 2021-2026 ($ million)
- Exhibit 84: Chart on France - Year-over-year growth 2021-2026 (%)
- Exhibit 85: Data Table on France - Year-over-year growth 2021-2026 (%)
- 7.13 Market opportunity by geography
- Exhibit 86: Market opportunity by geography ($ million)
8 Drivers, Challenges, and Trends
- 8.1 Market drivers
- 8.2 Market challenges
- 8.3 Impact of drivers and challenges
- Exhibit 87: Impact of drivers and challenges in 2021 and 2026
- 8.4 Market trends
9 Vendor Landscape
- 9.1 Overview
- 9.2 Vendor landscape
- Exhibit 88: Overview on Criticality of inputs and Factors of differentiation
- 9.3 Landscape disruption
- Exhibit 89: Overview on factors of disruption
- 9.4 Industry risks
- Exhibit 90: Impact of key risks on business
10 Vendor Analysis
- 10.1 Vendors covered
- Exhibit 91: Vendors covered
- 10.2 Market positioning of vendors
- Exhibit 92: Matrix on vendor position and classification
- 10.3 ANDREAS STIHL AG and Co. KG
- Exhibit 93: ANDREAS STIHL AG and Co. KG - Overview
- Exhibit 94: ANDREAS STIHL AG and Co. KG - Product / Service
- Exhibit 95: ANDREAS STIHL AG and Co. KG - Key news
- Exhibit 96: ANDREAS STIHL AG and Co. KG - Key offerings
- 10.4 Apex Tool Group LLC
- Exhibit 97: Apex Tool Group LLC - Overview
- Exhibit 98: Apex Tool Group LLC - Product / Service
- Exhibit 99: Apex Tool Group LLC - Key offerings
- 10.5 Atlas Copco AB
- Exhibit 100: Atlas Copco AB - Overview
- Exhibit 101: Atlas Copco AB - Business segments
- Exhibit 102: Atlas Copco AB - Key news
- Exhibit 103: Atlas Copco AB - Key offerings
- Exhibit 104: Atlas Copco AB - Segment focus
- 10.6 Emerson Electric Co.
- Exhibit 105: Emerson Electric Co. - Overview
- Exhibit 106: Emerson Electric Co. - Business segments
- Exhibit 107: Emerson Electric Co. - Key news
- Exhibit 108: Emerson Electric Co. - Key offerings
- Exhibit 109: Emerson Electric Co. - Segment focus
- 10.7 Illinois Tool Works Inc.
- Exhibit 110: Illinois Tool Works Inc. - Overview
- Exhibit 111: Illinois Tool Works Inc. - Business segments
- Exhibit 112: Illinois Tool Works Inc. - Key offerings
- Exhibit 113: Illinois Tool Works Inc. - Segment focus
- 10.8 Panasonic Corp
- Exhibit 114: Panasonic Corp - Overview
- Exhibit 115: Panasonic Corp - Business segments
- Exhibit 116: Panasonic Corp - Key news
- Exhibit 117: Panasonic Corp - Key offerings
- Exhibit 118: Panasonic Corp - Segment focus
- 10.9 Robert Bosch GmbH
- Exhibit 119: Robert Bosch GmbH - Overview
- Exhibit 120: Robert Bosch GmbH - Business segments
- Exhibit 121: Robert Bosch GmbH - Key news
- Exhibit 122: Robert Bosch GmbH - Key offerings
- Exhibit 123: Robert Bosch GmbH - Segment focus
- 10.10 Snap On Inc.
- Exhibit 124: Snap On Inc. - Overview
- Exhibit 125: Snap On Inc. - Business segments
- Exhibit 126: Snap On Inc. - Key news
- Exhibit 127: Snap On Inc. - Key offerings
- Exhibit 128: Snap On Inc. - Segment focus
- 10.11 Stanley Black and Decker Inc.
- Exhibit 129: Stanley Black and Decker Inc. - Overview
- Exhibit 130: Stanley Black and Decker Inc. - Business segments
- Exhibit 131: Stanley Black and Decker Inc. - Key news
- Exhibit 132: Stanley Black and Decker Inc. - Key offerings
- Exhibit 133: Stanley Black and Decker Inc. - Segment focus
- 10.12 Techtronic Industries Co. Ltd.
- Exhibit 134: Techtronic Industries Co. Ltd. - Overview
- Exhibit 135: Techtronic Industries Co. Ltd. - Business segments
- Exhibit 136: Techtronic Industries Co. Ltd. - Key offerings
- Exhibit 137: Techtronic Industries Co. Ltd. - Segment focus
11 Appendix
- 11.1 Scope of the report
- 11.2 Inclusions and exclusions checklist
- Exhibit 138: Inclusions checklist
- Exhibit 139: Exclusions checklist
- 11.3 Currency conversion rates for US$
- Exhibit 140: Currency conversion rates for US$
- 11.4 Research methodology
- Exhibit 141: Research methodology
- Exhibit 142: Validation techniques employed for market sizing
- Exhibit 143: Information sources
- 11.5 List of abbreviations
- Exhibit 144: List of abbreviations
Technavio is a leading global technology research and advisory company. Their research and analysis focus on emerging market trends and provide actionable insights to help businesses identify market opportunities and develop effective strategies to optimize their market positions.
With over 500 specialized analysts, Technavio's report library consists of more than 17,000 reports and counting, covering 800 technologies, spanning across 50 countries. Their client base consists of enterprises of all sizes, including more than 100 Fortune 500 companies. This growing client base relies on Technavio's comprehensive coverage, extensive research, and actionable market insights to identify opportunities in existing and potential markets and assess their competitive positions within changing market scenarios.
Contact
Technavio Research
Jesse Maida
Media & Marketing Executive
US: +1 844 364 1100
UK: +44 203 893 3200
Email:media@technavio.com
Website: www.technavio.com/


SOURCE Technavio
© 2024 Benzinga.com. Benzinga does not provide investment advice. All rights reserved.
Trade confidently with insights and alerts from analyst ratings, free reports and breaking news that affects the stocks you care about.

