


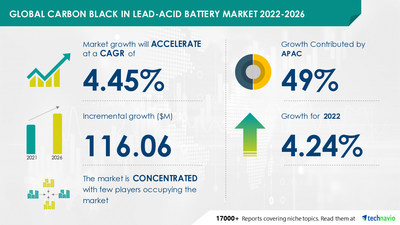
NEW YORK, Sept. 26, 2022 /PRNewswire/ -- The carbon black in the lead-acid battery market is expected to grow by USD 116.06 Mn during 2021-2026, progressing at a CAGR of over 4.45% during the forecast period. The market is driven by the increasing demand from the automotive industry. In addition, the increasing adoption of hybrid power systems in telecom towers is anticipated to boost the growth of carbon black in the Lead-acid Battery Market. Request free sample pages.

- Imerys S.A.: The company offers dried grapes that include golden raisins, black raisins, malayer raisins, and dark brown raisins.
- Orion Engineered Carbons SA: The company offers dried grapes that include Prunes, Prune Juice, Raisins, and Apricots.
- SGL Carbon SE: The company offers dried grapes that include raisins, seedless raisins, golden raisins, and chopped raisins.
- Superior graphite co: The company offers dried grapes that include Dried Fruit Raisins which have a sweet taste, chewy texture, and nutritional values.
- Cabot Corp.: The company offers dried grapes that include Probiotic Raisins.
Find additional highlights on the growth strategies adopted by vendors and their product offerings, Buy Sample Report.
Demand from the automotive industry, which is on the rise, is one of the main drivers propelling expansion in the market for carbon black in lead-acid batteries. The majority of batteries used in cars across the world are lead-acid batteries. However, because of its improved performance in specific applications, including UPS systems and ignition power sources for cars, carbon black is being used more and more in lead-acid batteries.
Significant battery R&D is being done to improve carbon black lead-acid battery technology's performance compared to other battery technologies, such as lithium-ion batteries, in order to increase the use of carbon black lead-acid batteries in the automobile sector. Such elements will increase the demand for carbon black in vehicle lead-acid batteries.
A market trend for carbon black in lead-acid batteries that are anticipated to have a favorable effect in the next years is the growing deployment of hybrid power systems in telecom towers. However, over the projection period, the market for carbon black in lead-acid batteries will face significant challenges due to the rising competition from carbon black lithium-ion batteries. Request Free Sample Report.
The category of flooded lead-acid batteries will significantly increase its market share in carbon black for lead-acid batteries. With regard to deep-cycle battery technology, flooded lead-acid batteries have the advantage of being the most cost-effective and have the lowest cost per kilowatt-hour (kWh) cycle. During the forecast period, it is predicted that these factors would encourage the expansion of the flooded lead-acid battery segment in the global carbon black lead-acid battery market.
Global Wind Power Systems Market Research Report, Size, Growth, Trends, Opportunity Analysis, Industry Forecast - 2022-2026: The global wind power systems market is projected to grow by USD 49.52 billion with a CAGR of 6.57% during the forecast period 2021 to 2026.
Solar PV Tracker Market by Technology, Product, and Geography - Forecast and Analysis 2022-2026: The Solar PV tracker Market study is a comprehensive report with in-depth qualitative and quantitative research evaluating the current scenario and analyzing the growth of 15.26% and a CAGR of 17.28% with the market share of USD 7.43 billion for the forecast period 2021 to 2026.
Carbon Black In Lead-acid Battery Market Scope | |
Report Coverage | Details |
Page number | 120 |
Base year | 2021 |
Forecast period | 2022-2026 |
Growth momentum & CAGR | Accelerate at a CAGR of 4.45% |
Market growth 2022-2026 | $ 116.06 million |
Market structure | Concentrated |
YoY growth (%) | 4.24 |
Regional analysis | APAC, North America, Europe, South America, and Middle East and Africa |
Performing market contribution | APAC at 49% |
Key consumer countries | US, Canada, China, Japan, and Germany |
Competitive landscape | Leading companies, competitive strategies, consumer engagement scope |
Companies profiled | Imerys S.A., IsraZion Ltd., Orion Engineered Carbons SA, SGL Carbon SE, Shandong Jinkeli Power Sources Technology Co. Ltd., Superior graphite co, Birla Carbon USA Inc, Cabot Corp., and Denka Co. Ltd. |
Market Dynamics | Parent market analysis, Market growth inducers and obstacles, Fast-growing and slow-growing segment analysis, COVID-19 impact and future consumer dynamics, and market condition analysis for the forecast period. |
Customization purview | If our report has not included the data that you are looking for, you can reach out to our analysts and get segments customized. |
Browse for Technavio "Utilities" Research Reports
1 Executive Summary
- 1.1 Market overview
- Exhibit 01: Executive Summary – Chart on Market Overview
- Exhibit 02: Executive Summary – Data Table on Market Overview
- Exhibit 03: Executive Summary – Chart on Global Market Characteristics
- Exhibit 04: Executive Summary – Chart on Market by Geography
- Exhibit 05: Executive Summary – Chart on Market Segmentation by Battery Type
- Exhibit 06: Executive Summary – Chart on Incremental Growth
- Exhibit 07: Executive Summary – Data Table on Incremental Growth
- Exhibit 08: Executive Summary – Chart on Vendor Market Positioning
2 Market Landscape
- 2.1 Market ecosystem
- Exhibit 09: Parent market
- Exhibit 10: Market Characteristics
3 Market Sizing
- 3.1 Market definition
- Exhibit 11: Offerings of vendors included in the market definition
- 3.2 Market segment analysis
- Exhibit 12: Market segments
- 3.3 Market size 2021
- 3.4 Market outlook: Forecast for 2021-2026
- Exhibit 13: Chart on Global - Market size and forecast 2021-2026 ($ million)
- Exhibit 14: Data Table on Global - Market size and forecast 2021-2026 ($ million)
- Exhibit 15: Chart on Global Market: Year-over-year growth 2021-2026 (%)
- Exhibit 16: Data Table on Global Market: Year-over-year growth 2021-2026 (%)
4 Five Forces Analysis
- 4.1 Five forces summary
- Exhibit 17: Five forces analysis - Comparison between 2021 and 2026
- 4.2 Bargaining power of buyers
- Exhibit 18: Chart on Bargaining power of buyers – Impact of key factors 2021 and 2026
- 4.3 Bargaining power of suppliers
- Exhibit 19: Bargaining power of suppliers – Impact of key factors in 2021 and 2026
- 4.4 Threat of new entrants
- Exhibit 20: Threat of new entrants – Impact of key factors in 2021 and 2026
- 4.5 Threat of substitutes
- Exhibit 21: Threat of substitutes – Impact of key factors in 2021 and 2026
- 4.6 Threat of rivalry
- Exhibit 22: Threat of rivalry – Impact of key factors in 2021 and 2026
- 4.7 Market condition
- Exhibit 23: Chart on Market condition - Five forces 2021 and 2026
5 Market Segmentation by Battery Type
- 5.1 Market segments
- Exhibit 24: Chart on Battery Type - Market share 2021-2026 (%)
- Exhibit 25: Data Table on Battery Type - Market share 2021-2026 (%)
- 5.2 Comparison by Battery Type
- Exhibit 26: Chart on Comparison by Battery Type
- Exhibit 27: Data Table on Comparison by Battery Type
- 5.3 Flooded lead-acid battery - Market size and forecast 2021-2026
- Exhibit 28: Chart on Flooded lead-acid battery - Market size and forecast 2021-2026 ($ million)
- Exhibit 29: Data Table on Flooded lead-acid battery - Market size and forecast 2021-2026 ($ million)
- Exhibit 30: Chart on Flooded lead-acid battery - Year-over-year growth 2021-2026 (%)
- Exhibit 31: Data Table on Flooded lead-acid battery - Year-over-year growth 2021-2026 (%)
- 5.4 Valve regulated lead-acid (VRLA) battery - Market size and forecast 2021-2026
- Exhibit 32: Chart on Valve regulated lead-acid (VRLA) battery - Market size and forecast 2021-2026 ($ million)
- Exhibit 33: Data Table on Valve regulated lead-acid (VRLA) battery - Market size and forecast 2021-2026 ($ million)
- Exhibit 34: Chart on Valve regulated lead-acid (VRLA) battery - Year-over-year growth 2021-2026 (%)
- Exhibit 35: Data Table on Valve regulated lead-acid (VRLA) battery - Year-over-year growth 2021-2026 (%)
- 5.5 Market opportunity by Battery Type
- Exhibit 36: Market opportunity by Battery Type ($ million)
6 Customer Landscape
- 6.1 Customer landscape overview
- Exhibit 37: Analysis of price sensitivity, lifecycle, customer purchase basket, adoption rates, and purchase criteria
7 Geographic Landscape
- 7.1 Geographic segmentation
- Exhibit 38: Chart on Market share by geography 2021-2026 (%)
- Exhibit 39: Data Table on Market share by geography 2021-2026 (%)
- 7.2 Geographic comparison
- Exhibit 40: Chart on Geographic comparison
- Exhibit 41: Data Table on Geographic comparison
- 7.3 APAC - Market size and forecast 2021-2026
- Exhibit 42: Chart on APAC - Market size and forecast 2021-2026 ($ million)
- Exhibit 43: Data Table on APAC - Market size and forecast 2021-2026 ($ million)
- Exhibit 44: Chart on APAC - Year-over-year growth 2021-2026 (%)
- Exhibit 45: Data Table on APAC - Year-over-year growth 2021-2026 (%)
- 7.4 North America - Market size and forecast 2021-2026
- Exhibit 46: Chart on North America - Market size and forecast 2021-2026 ($ million)
- Exhibit 47: Data Table on North America - Market size and forecast 2021-2026 ($ million)
- Exhibit 48: Chart on North America - Year-over-year growth 2021-2026 (%)
- Exhibit 49: Data Table on North America - Year-over-year growth 2021-2026 (%)
- 7.5 Europe - Market size and forecast 2021-2026
- Exhibit 50: Chart on Europe - Market size and forecast 2021-2026 ($ million)
- Exhibit 51: Data Table on Europe - Market size and forecast 2021-2026 ($ million)
- Exhibit 52: Chart on Europe - Year-over-year growth 2021-2026 (%)
- Exhibit 53: Data Table on Europe - Year-over-year growth 2021-2026 (%)
- 7.6 South America - Market size and forecast 2021-2026
- Exhibit 54: Chart on South America - Market size and forecast 2021-2026 ($ million)
- Exhibit 55: Data Table on South America - Market size and forecast 2021-2026 ($ million)
- Exhibit 56: Chart on South America - Year-over-year growth 2021-2026 (%)
- Exhibit 57: Data Table on South America - Year-over-year growth 2021-2026 (%)
- 7.7 Middle East and Africa - Market size and forecast 2021-2026
- Exhibit 58: Chart on Middle East and Africa - Market size and forecast 2021-2026 ($ million)
- Exhibit 59: Data Table on Middle East and Africa - Market size and forecast 2021-2026 ($ million)
- Exhibit 60: Chart on Middle East and Africa - Year-over-year growth 2021-2026 (%)
- Exhibit 61: Data Table on Middle East and Africa - Year-over-year growth 2021-2026 (%)
- 7.8 China - Market size and forecast 2021-2026
- Exhibit 62: Chart on China - Market size and forecast 2021-2026 ($ million)
- Exhibit 63: Data Table on China - Market size and forecast 2021-2026 ($ million)
- Exhibit 64: Chart on China - Year-over-year growth 2021-2026 (%)
- Exhibit 65: Data Table on China - Year-over-year growth 2021-2026 (%)
- 7.9 US - Market size and forecast 2021-2026
- Exhibit 66: Chart on US - Market size and forecast 2021-2026 ($ million)
- Exhibit 67: Data Table on US - Market size and forecast 2021-2026 ($ million)
- Exhibit 68: Chart on US - Year-over-year growth 2021-2026 (%)
- Exhibit 69: Data Table on US - Year-over-year growth 2021-2026 (%)
- 7.10 Japan - Market size and forecast 2021-2026
- Exhibit 70: Chart on Japan - Market size and forecast 2021-2026 ($ million)
- Exhibit 71: Data Table on Japan - Market size and forecast 2021-2026 ($ million)
- Exhibit 72: Chart on Japan - Year-over-year growth 2021-2026 (%)
- Exhibit 73: Data Table on Japan - Year-over-year growth 2021-2026 (%)
- 7.11 Germany - Market size and forecast 2021-2026
- Exhibit 74: Chart on Germany - Market size and forecast 2021-2026 ($ million)
- Exhibit 75: Data Table on Germany - Market size and forecast 2021-2026 ($ million)
- Exhibit 76: Chart on Germany - Year-over-year growth 2021-2026 (%)
- Exhibit 77: Data Table on Germany - Year-over-year growth 2021-2026 (%)
- 7.12 Canada - Market size and forecast 2021-2026
- Exhibit 78: Chart on Canada - Market size and forecast 2021-2026 ($ million)
- Exhibit 79: Data Table on Canada - Market size and forecast 2021-2026 ($ million)
- Exhibit 80: Chart on Canada - Year-over-year growth 2021-2026 (%)
- Exhibit 81: Data Table on Canada - Year-over-year growth 2021-2026 (%)
- 7.13 Market opportunity by geography
- Exhibit 82: Market opportunity by geography ($ million)
8 Drivers, Challenges, and Trends
- 8.1 Market drivers
- 8.2 Market challenges
- 8.3 Impact of drivers and challenges
- Exhibit 83: Impact of drivers and challenges in 2021 and 2026
- 8.4 Market trends
9 Vendor Landscape
- 9.1 Overview
- 9.2 Vendor landscape
- Exhibit 84: Overview on Criticality of inputs and Factors of differentiation
- 9.3 Landscape disruption
- Exhibit 85: Overview on factors of disruption
- 9.4 Industry risks
- Exhibit 86: Impact of key risks on business
10 Vendor Analysis
- 10.1 Vendors covered
- Exhibit 87: Vendors covered
- 10.2 Market positioning of vendors
- Exhibit 88: Matrix on vendor position and classification
- 10.3 Birla Carbon USA Inc
- Exhibit 89: Birla Carbon USA Inc - Overview
- Exhibit 90: Birla Carbon USA Inc - Product / Service
- Exhibit 91: Birla Carbon USA Inc - Key offerings
- 10.4 Cabot Corp.
- Exhibit 92: Cabot Corp. - Overview
- Exhibit 93: Cabot Corp. - Business segments
- Exhibit 94: Cabot Corp. - Key offerings
- Exhibit 95: Cabot Corp. - Segment focus
- 10.5 Denka Co. Ltd.
- Exhibit 96: Denka Co. Ltd. - Overview
- Exhibit 97: Denka Co. Ltd. - Business segments
- Exhibit 98: Denka Co. Ltd. - Key news
- Exhibit 99: Denka Co. Ltd. - Key offerings
- Exhibit 100: Denka Co. Ltd. - Segment focus
- 10.6 Imerys S.A.
- Exhibit 101: Imerys S.A. - Overview
- Exhibit 102: Imerys S.A. - Business segments
- Exhibit 103: Imerys S.A. - Key offerings
- Exhibit 104: Imerys S.A. - Segment focus
- 10.7 IsraZion Ltd.
- Exhibit 105: IsraZion Ltd. - Overview
- Exhibit 106: IsraZion Ltd. - Product / Service
- Exhibit 107: IsraZion Ltd. - Key offerings
- 10.8 Orion Engineered Carbons SA
- Exhibit 108: Orion Engineered Carbons SA - Overview
- Exhibit 109: Orion Engineered Carbons SA - Business segments
- Exhibit 110: Orion Engineered Carbons SA - Key news
- Exhibit 111: Orion Engineered Carbons SA - Key offerings
- Exhibit 112: Orion Engineered Carbons SA - Segment focus
- 10.9 SGL Carbon SE
- Exhibit 113: SGL Carbon SE - Overview
- Exhibit 114: SGL Carbon SE - Business segments
- Exhibit 115: SGL Carbon SE - Key news
- Exhibit 116: SGL Carbon SE - Key offerings
- Exhibit 117: SGL Carbon SE - Segment focus
- 10.10 Shandong Jinkeli Power Sources Technology Co. Ltd.
- Exhibit 118: Shandong Jinkeli Power Sources Technology Co. Ltd. - Overview
- Exhibit 119: Shandong Jinkeli Power Sources Technology Co. Ltd. - Product / Service
- Exhibit 120: Shandong Jinkeli Power Sources Technology Co. Ltd. - Key offerings
- 10.11 Superior graphite co
- Exhibit 121: Superior graphite co - Overview
- Exhibit 122: Superior graphite co - Product / Service
- Exhibit 123: Superior graphite co - Key offerings
11 Appendix
- 11.1 Scope of the report
- 11.2 Inclusions and exclusions checklist
- Exhibit 124: Inclusions checklist
- Exhibit 125: Exclusions checklist
- 11.3 Currency conversion rates for US$
- Exhibit 126: Currency conversion rates for US$
- 11.4 Research methodology
- Exhibit 127: Research methodology
- Exhibit 128: Validation techniques employed for market sizing
- Exhibit 129: Information sources
- 11.5 List of abbreviations
- Exhibit 130: List of abbreviations
Technavio is a leading global technology research and advisory company. Their research and analysis focus on emerging market trends and provides actionable insights to help businesses identify market opportunities and develop effective strategies to optimize their market positions.
With over 500 specialized analysts, Technavio's report library consists of more than 17,000 reports and counting, covering 800 technologies, spanning across 50 countries. Their client base consists of enterprises of all sizes, including more than 100 Fortune 500 companies. This growing client base relies on Technavio's comprehensive coverage, extensive research, and actionable market insights to identify opportunities in existing and potential markets and assess their competitive positions within changing market scenarios.
Contacts
Technavio Research
Jesse Maida
Media & Marketing Executive
US: +1 844 364 1100
UK: +44 203 893 3200
Email: media@technavio.com
Website: www.technavio.com/


SOURCE Technavio
© 2024 Benzinga.com. Benzinga does not provide investment advice. All rights reserved.
Trade confidently with insights and alerts from analyst ratings, free reports and breaking news that affects the stocks you care about.

