


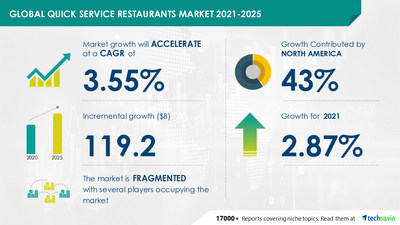
NEW YORK, Sept. 21, 2022 /PRNewswire/ -- The "Quick Service Restaurants Market Growth, Size, Trends, Analysis Report by Type, Application, Region and Segment Forecast 2021-2025" report has been added to Technavio's catalog. The growth momentum of the market is anticipated to accelerate at a CAGR of 3.55% during the forecast period. This growth can be attributed to the rising demand for fast food, especially in emerging economies. However, fluctuations in raw material prices can hamper the growth of the market during the next few years.

Get a comprehensive report summary describing the market size and forecast along with research methodology. The FREE sample report is available in PDF format
Key Vendor Analysis
American Dairy Queen Corp., Chick-fil-A Inc., Doctors Associates LLC, Domino's Pizza Inc., Dunkin Brands Group Inc., Inspire Brands Inc., McDonald Corp., Starbucks Coffee Company, The Wendy's Co., YUM Brands Inc., among others, are the main players in the market. The key offerings of some of these vendors are listed below:
- American Dairy Queen Corp. - The company offers a wide range of snacks, meals, and beverages through its chain of quick service restaurants named Dairy Queen.
- Chick-fil-A Inc. - The company offers a wide range of snacks and meal options through its chain of quick service restaurants named Chick-fill-A.
- Doctors Associates LLC - The company offers a wide range of snacks, meals, and breakfast through its chain of quick service restaurants named Subway.
- Domino's Pizza Inc. - The company offers a wide range of pizzas, snacks, and meals through its chain of quick service restaurants.
- Dunkin Brands Group Inc. - The company offers a wide range of snacks and ice creams through its chain of quick service restaurants named Dunkin and Baskin Robbins.
This report provides a full list of key vendors, their strategies, and the latest developments. Buy Now to gain access to exclusive vendor information
Quick Service Restaurants Market Service Outlook (Revenue, USD bn, 2020-2025)
- Eat-in service - size and forecast 2020-2025
- Takeaway service - size and forecast 2020-2025
- Drive-thru service - size and forecast 2020-2025
- Home delivery service - size and forecast 2020-2025
Quick Service Restaurants Market Geography Outlook (Revenue, USD bn, 2020-2025)
- North America - size and forecast 2020-2025
- APAC - size and forecast 2020-2025
- Europe - size and forecast 2020-2025
- South America - size and forecast 2020-2025
- MEA - size and forecast 2020-2025
Learn about the contribution of each segment summarized in concise infographics and thorough descriptions. View a FREE PDF Sample Report
Revenue-generating Service Segments
The eat-in service segment will be the largest revenue-generating service segment during the forecast period. Dining out is convenient for customers due to their fast-paced lifestyle and busy working schedules. Moreover, quick service restaurant operators are adding multi-cuisine dishes to their menus because of the changing tastes and preferences of consumers.
Market Driver
The rise in the number of quick service restaurants due to the increasing demand for fast food, especially in emerging economies, is driving the growth of the market. Fast food chains are expanding across the world. The changing tastes and preferences of customers have further led to the emergence of specialty coffee shops. Hence, large cafe chains such as Starbucks are establishing outlets in many developing economies in Asia and South America. Moreover, the growth in infrastructure, including new airports and expressways in developing countries, gives opportunities to major coffee chains.
Related Reports
Fast Casual Restaurants Market Growth, Size, Trends, Analysis Report by Type, Application, Region, and Segment Forecast 2022-2026: The fast casual restaurants market share is expected to increase by USD 186.27 billion from 2021 to 2026.
Specialty Coffee Shops Market Growth, Size, Trends, Analysis Report by Type, Application, Region, and Segment Forecast 2022-2026: The specialty coffee shops market share is expected to increase by USD 68.59 billion from 2021 to 2026.
Quick Service Restaurants Market Scope | |
Report Coverage | Details |
Page number | 120 |
Base year | 2020 |
Forecast period | 2021-2025 |
Growth momentum & CAGR | Accelerate at a CAGR of 3.55% |
Market growth 2021-2025 | USD 119.2 billion |
Market structure | Fragmented |
YoY growth (%) | 2.87 |
Regional analysis | North America, APAC, Europe, South America, and MEA |
Performing market contribution | North America at 43% |
Key consumer countries | US, China, Japan, UK, and Canada |
Competitive landscape | Leading companies, Competitive Strategies, Consumer engagement scope |
Key companies profiled | American Dairy Queen Corp., Chick-fil-A Inc., Doctors Associates LLC, Domino's Pizza Inc., Dunkin Brands Group Inc., Inspire Brands Inc., McDonald Corp., Starbucks Coffee Company, The Wendy's Co., and YUM Brands Inc. |
Market dynamics | Parent market analysis, market growth inducers and obstacles, fast-growing and slow-growing segment analysis, COVID-19 impact and recovery analysis and future consumer dynamics, and market condition analysis for the forecast period. |
Customization purview | If our report has not included the data that you are looking for, you can reach out to our analysts and get segments customized. |
Browse Consumer Discretionary Market Reports
Table of Contents
1 Executive Summary
2 Market Landscape
- 2.1 Market ecosystem
- Exhibit 01: Parent market
- Exhibit 02: Market characteristics
- 2.2 Value chain analysis
- Exhibit 03: Value chain analysis: Restaurant market
3 Market Sizing
- 3.1 Market definition
- Exhibit 04: Offerings of vendors included in the market definition
- 3.2 Market segment analysis
- Exhibit 05: Market segments
- 3.3 Market size 2020
- 3.4 Market outlook: Forecast for 2020 - 2025
- Exhibit 06: Global - Market size and forecast 2020 - 2025 ($ billion)
- Exhibit 07: Global market: Year-over-year growth 2020 - 2025 (%)
4 Five Forces Analysis
- 4.1 Five forces analysis
- Exhibit 08: Five forces analysis 2020 & 2025
- 4.2 Bargaining power of buyers
- Exhibit 09: Bargaining power of buyers
- 4.3 Bargaining power of suppliers
- Exhibit 10: Bargaining power of suppliers
- 4.4 Threat of new entrants
- Exhibit 11: Threat of new entrants
- 4.5 Threat of substitutes
- Exhibit 12: Threat of substitutes
- 4.6 Threat of rivalry
- Exhibit 13: Threat of rivalry
- 4.7 Market condition
- Exhibit 14: Market condition - Five forces 2020
5 Market Segmentation by Service
- 5.1 Market segments
- Exhibit 15: Service - Market share 2020-2025 (%)
- 5.2 Comparison by Service
- Exhibit 16: Comparison by Service
- 5.3 Eat-in service - Market size and forecast 2020-2025
- Exhibit 17: Eat-in service - Market size and forecast 2020-2025 ($ billion)
- Exhibit 18: Eat-in service - Year-over-year growth 2020-2025 (%)
- 5.4 Takeaway service - Market size and forecast 2020-2025
- Exhibit 19: Takeaway service - Market size and forecast 2020-2025 ($ billion)
- Exhibit 20: Takeaway service - Year-over-year growth 2020-2025 (%)
- 5.5 Drive-thru service - Market size and forecast 2020-2025
- Exhibit 21: Drive-thru service - Market size and forecast 2020-2025 ($ billion)
- Exhibit 22: Drive-thru service - Year-over-year growth 2020-2025 (%)
- 5.6 Home delivery service - Market size and forecast 2020-2025
- Exhibit 23: Home delivery service - Market size and forecast 2020-2025 ($ billion)
- Exhibit 24: Home delivery service - Year-over-year growth 2020-2025 (%)
- 5.7 Market opportunity by Service
- Exhibit 25: Market opportunity by Service
6 Customer landscape
- 6.1 Customer landscape
- Exhibit 26: Customer landscape
7 Geographic Landscape
- 7.1 Geographic segmentation
- Exhibit 27: Market share by geography 2020-2025 (%)
- 7.2 Geographic comparison
- Exhibit 28: Geographic comparison
- 7.3 North America - Market size and forecast 2020-2025
- Exhibit 29: North America - Market size and forecast 2020-2025 ($ billion)
- Exhibit 30: North America - Year-over-year growth 2020-2025 (%)
- 7.4 APAC - Market size and forecast 2020-2025
- Exhibit 31: APAC - Market size and forecast 2020-2025 ($ billion)
- Exhibit 32: APAC - Year-over-year growth 2020-2025 (%)
- 7.5 Europe - Market size and forecast 2020-2025
- Exhibit 33: Europe - Market size and forecast 2020-2025 ($ billion)
- Exhibit 34: Europe - Year-over-year growth 2020-2025 (%)
- 7.6 South America - Market size and forecast 2020-2025
- Exhibit 35: South America - Market size and forecast 2020-2025 ($ billion)
- Exhibit 36: South America - Year-over-year growth 2020-2025 (%)
- 7.7 MEA - Market size and forecast 2020-2025
- Exhibit 37: MEA - Market size and forecast 2020-2025 ($ billion)
- Exhibit 38: MEA - Year-over-year growth 2020-2025 (%)
- 7.8 Key leading countries
- Exhibit 39: Key leading countries
- 7.9 Market opportunity by geography
- Exhibit 40: Market opportunity by geography ($ billion)
8 Drivers, Challenges, and Trends
- 8.1 Market drivers
- 8.2 Market challenges
- Exhibit 41: Impact of drivers and challenges
- 8.3 Market trends
9 Vendor Landscape
- 9.1 Overview
- Exhibit 42: Vendor landscape
- 9.2 Landscape disruption
- Exhibit 43: Landscape disruption
- Exhibit 44: Industry risks
10 Vendor Analysis
- 10.1 Vendors covered
- Exhibit 45: Vendors covered
- 10.2 Market positioning of vendors
- 10.3 American Dairy Queen Corp.
- Exhibit 47: American Dairy Queen Corp. - Overview
- Exhibit 48: American Dairy Queen Corp. - Product and service
- Exhibit 49: American Dairy Queen Corp. - Key offerings
- 10.4 Chick-fil-A Inc.
- Exhibit 50: Chick-fil-A Inc. - Overview
- Exhibit 51: Chick-fil-A Inc. - Product and service
- Exhibit 52: Chick-fil-A Inc.- Key news
- Exhibit 53: Chick-fil-A Inc. - Key offerings
- 10.5 Doctors Associates LLC
- Exhibit 54: Doctors Associates LLC - Overview
- Exhibit 55: Doctors Associates LLC - Product and service
- Exhibit 56: Doctors Associates LLC- Key news
- Exhibit 57: Doctors Associates LLC - Key offerings
- 10.6 Domino's Pizza Inc.
- Exhibit 58: Domino's Pizza Inc. - Overview
- Exhibit 59: Domino's Pizza Inc. - Business segments
- Exhibit 60: Domino's Pizza Inc. - Key offerings
- Exhibit 61: Domino's Pizza Inc. - Segment focus
- 10.7 Dunkin Brands Group Inc.
- Exhibit 62: Dunkin Brands Group Inc. - Overview
- Exhibit 63: Dunkin Brands Group Inc. - Business segments
- Exhibit 64: Dunkin Brands Group Inc. - Key offerings
- Exhibit 65: Dunkin Brands Group Inc. - Segment focus
- 10.8 Inspire Brands Inc.
- Exhibit 66: Inspire Brands Inc. - Overview
- Exhibit 67: Inspire Brands Inc. - Product and service
- Exhibit 68: Inspire Brands Inc.- Key news
- Exhibit 69: Inspire Brands Inc. - Key offerings
- 10.9 McDonald Corp.
- Exhibit 70: McDonald Corp. - Overview
- Exhibit 71: McDonald Corp. - Product and service
- Exhibit 72: McDonalds Corp.- Key news
- Exhibit 73: McDonald Corp. - Key offerings
- 10.10 Starbucks Coffee Company
- Exhibit 74: Starbucks Coffee Company - Overview
- Exhibit 75: Starbucks Coffee Company - Business segments
- Exhibit 76: Starbucks Corp.- Key news
- Exhibit 77: Starbucks Coffee Company - Key offerings
- Exhibit 78: Starbucks Coffee Company - Segment focus
- 10.11 The Wendy's Co.
- Exhibit 79: The Wendy's Co. - Overview
- Exhibit 80: The Wendy's Co. - Business segments
- Exhibit 81: The Wendy's Co. - Key offerings
- Exhibit 82: The Wendy's Co. - Segment focus
- 10.12 YUM Brands Inc.
- Exhibit 83: YUM Brands Inc. - Overview
- Exhibit 84: YUM Brands Inc. - Business segments
- Exhibit 85: YUM Brands Inc. - Key offerings
- Exhibit 86: YUM Brands Inc. - Segment focus
11 Appendix
- 11.1 Scope of the report
- 11.2 Currency conversion rates for US$
- Exhibit 87: Currency conversion rates for US$
- 11.3 Research methodology
- Exhibit 88: Research Methodology
- Exhibit 89: Validation techniques employed for market sizing
- Exhibit 90: Information sources
- 11.4 List of abbreviations
- Exhibit 91: List of abbreviations
Technavio is a leading global technology research and advisory company. Their research and analysis focus on emerging market trends and provide actionable insights to help businesses identify market opportunities and develop effective strategies to optimize their market positions.
With over 500 specialized analysts, Technavio's report library consists of more than 17,000 reports and counting, covering 800 technologies, spanning across 50 countries. Their client base consists of enterprises of all sizes, including more than 100 Fortune 500 companies. This growing client base relies on Technavio's comprehensive coverage, extensive research, and actionable market insights to identify opportunities in existing and potential markets and assess their competitive positions within changing market scenarios.
Contacts
Technavio Research
Jesse Maida
Media & Marketing Executive
US: +1 844 364 1100
UK: +44 203 893 3200
Email: media@technavio.com
Website: www.technavio.com/
Newsroom: newsroom.technavio.org/news/quick-service-restaurantsmarket


SOURCE Technavio
© 2024 Benzinga.com. Benzinga does not provide investment advice. All rights reserved.
Trade confidently with insights and alerts from analyst ratings, free reports and breaking news that affects the stocks you care about.

