


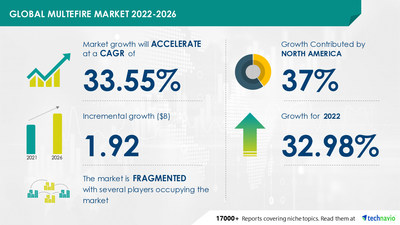
NEW YORK, Sept. 19, 2022 /PRNewswire/ -- The multefire market size is expected to grow by USD 1.92 bn from 2021 to 2026. In addition, the growth momentum of the market will accelerate at a CAGR of 33.55% during the forecast period. The rising demand from the industrial sector is driving the multefire market growth. However, factors such as lack of multefire devices may challenge market growth.

Technavio offers an up-to-date analysis regarding the current global market scenario and the overall market environment. View a FREE PDF Sample Report
To help businesses improve their market position, Technavio's report provides a detailed analysis of around 25 vendors operating in the market. Some of the major vendors of the multefire market include Casa Systems Inc., Huawei Investment and Holding Co. Ltd., Intel Corp., InterDigital Inc., Nokia Corp., Qualcomm Inc., Qucell Inc., Redline Communications Group Inc., Samsung Electronics Co. Ltd., Telefonaktiebolaget LM Ericsson, Athonet Srl, and Sony Group Corp. The key offerings of some of these vendors are listed below:
- Huawei Investment and Holding Co. Ltd. - The company offers multefire, which is an LTE-based technology that operates standalone in unlicensed and shared spectrum, including the global 5 GHz band.
- Intel Corp. - The company offers multefire technology which delivers higher performance in local area networks.
- InterDigital Inc. - The company offers multefire, which operates solely in unlicensed spectrum without requiring an LTE anchor in licensed spectrum.
The report also covers the following areas:
Get lifetime access to our Technavio Insights. Subscribe now to our most popular "Basic Plan" billed annually at USD 5000
- Type
- Small Cells: The small cells segment will be the largest contributor to market growth during the forecast period. The significant rise in the demand for reliable and private networks is driving the growth of this segment. Moreover, the continuously increasing demand for private networks based on unlicensed and shared frequencies would accelerate the use of small cells for enterprise applications.
- Switches
- Controllers
- Geography
- North America: This region will account for 37% of the market's growth during the forecast period. The growth is attributed to factors such as a significant rise in the adoption of multefire technology-based networks. Several initiatives taken by vendors to explore opportunities in making LTE technologies available in the unlicensed band for varied applications are also driving the growth of the market in the region. Moreover, market growth in this region will be faster than the growth of the market in other regions. The US and Canada are the key countries for the multefire market in North America.
- Europe
- APAC
- South America
- Middle East And Africa
Learn about the contribution of each segment summarized in concise infographics and thorough descriptions. View a FREE PDF Sample Report
- CAGR of the market during the forecast period 2022-2026
- Detailed information on factors that will assist multefire market growth during the next five years
- Estimation of the multefire market size and its contribution to the parent market
- Predictions on upcoming trends and changes in consumer behavior
- The growth of the multefire market
- Analysis of the market's competitive landscape and detailed information on vendors
- Comprehensive details of factors that will challenge the growth of multefire market vendors
Related Reports
Rugged Handheld Devices Market by Type, End-user, Product, and Geography - Forecast and Analysis 2022-2026: The rugged handheld devices market share is expected to increase by USD 1.85 billion from 2021 to 2026.
Graphics Processing Unit Market by Type and Geography - Forecast and Analysis 2022-2026: The graphics processing unit (GPU) market share is expected to increase by USD 105.70 billion from 2021 to 2026.
Multefire Market Scope | |
Report Coverage | Details |
Page number | 120 |
Base year | 2021 |
Forecast period | 2022-2026 |
Growth momentum & CAGR | Accelerate at a CAGR of 33.55% |
Market growth 2022-2026 | USD 1.92 billion |
Market structure | Fragmented |
YoY growth (%) | 32.98 |
Regional analysis | North America, Europe, APAC, South America, and Middle East and Africa |
Performing market contribution | North America at 37% |
Key consumer countries | US, Canada, China, UK, and Germany |
Competitive landscape | Leading companies, competitive strategies, consumer engagement scope |
Companies profiled | Casa Systems Inc., Huawei Investment and Holding Co. Ltd., Intel Corp., InterDigital Inc., Nokia Corp., Qualcomm Inc., Qucell Inc., Redline Communications Group Inc., Samsung Electronics Co. Ltd., Telefonaktiebolaget LM Ericsson, Athonet Srl, and Sony Group Corp. |
Market Dynamics | Parent market analysis, market growth inducers and obstacles, fast-growing and slow-growing segment analysis, COVID-19 impact and future consumer dynamics, and market condition analysis for the forecast period. |
Customization purview | If our report has not included the data that you are looking for, you can reach out to our analysts and get segments customized. |
Browse Information Technology Market Reports
Table of Contents
1 Executive Summary
- 1.1 Market overview
- Exhibit 01: Executive Summary – Chart on Market Overview
- Exhibit 02: Executive Summary – Data Table on Market Overview
- Exhibit 03: Executive Summary – Chart on Global Market Characteristics
- Exhibit 04: Executive Summary – Chart on Market by Geography
- Exhibit 05: Executive Summary – Chart on Market Segmentation by Type
- Exhibit 06: Executive Summary – Chart on Incremental Growth
- Exhibit 07: Executive Summary – Data Table on Incremental Growth
- Exhibit 08: Executive Summary – Chart on Vendor Market Positioning
2 Market Landscape
- 2.1 Market ecosystem
- Exhibit 09: Parent market
- Exhibit 10: Market Characteristics
3 Market Sizing
- 3.1 Market definition
- Exhibit 11: Offerings of vendors included in the market definition
- 3.2 Market segment analysis
- Exhibit 12: Market segments
- 3.3 Market size 2021
- 3.4 Market outlook: Forecast for 2021-2026
- Exhibit 13: Chart on Global - Market size and forecast 2021-2026 ($ million)
- Exhibit 14: Data Table on Global - Market size and forecast 2021-2026 ($ million)
- Exhibit 15: Chart on Global Market: Year-over-year growth 2021-2026 (%)
- Exhibit 16: Data Table on Global Market: Year-over-year growth 2021-2026 (%)
4 Five Forces Analysis
- 4.1 Five forces summary
- Exhibit 17: Five forces analysis - Comparison between2021 and 2026
- 4.2 Bargaining power of buyers
- Exhibit 18: Chart on Bargaining power of buyers – Impact of key factors 2021 and 2026
- 4.3 Bargaining power of suppliers
- Exhibit 19: Bargaining power of suppliers – Impact of key factors in 2021 and 2026
- 4.4 Threat of new entrants
- Exhibit 20: Threat of new entrants – Impact of key factors in 2021 and 2026
- 4.5 Threat of substitutes
- Exhibit 21: Threat of substitutes – Impact of key factors in 2021 and 2026
- 4.6 Threat of rivalry
- Exhibit 22: Threat of rivalry – Impact of key factors in 2021 and 2026
- 4.7 Market condition
- Exhibit 23: Chart on Market condition - Five forces 2021 and 2026
5 Market Segmentation by Type
- 5.1 Market segments
- Exhibit 24: Chart on Type - Market share 2021-2026 (%)
- Exhibit 25: Data Table on Type - Market share 2021-2026 (%)
- 5.2 Comparison by Type
- Exhibit 26: Chart on Comparison by Type
- Exhibit 27: Data Table on Comparison by Type
- 5.3 Small cells - Market size and forecast 2021-2026
- Exhibit 28: Chart on Small cells - Market size and forecast 2021-2026 ($ million)
- Exhibit 29: Data Table on Small cells - Market size and forecast 2021-2026 ($ million)
- Exhibit 30: Chart on Small cells - Year-over-year growth 2021-2026 (%)
- Exhibit 31: Data Table on Small cells - Year-over-year growth 2021-2026 (%)
- 5.4 Switches - Market size and forecast 2021-2026
- Exhibit 32: Chart on Switches - Market size and forecast 2021-2026 ($ million)
- Exhibit 33: Data Table on Switches - Market size and forecast 2021-2026 ($ million)
- Exhibit 34: Chart on Switches - Year-over-year growth 2021-2026 (%)
- Exhibit 35: Data Table on Switches - Year-over-year growth 2021-2026 (%)
- 5.5 Controllers - Market size and forecast 2021-2026
- Exhibit 36: Chart on Controllers - Market size and forecast 2021-2026 ($ million)
- Exhibit 37: Data Table on Controllers - Market size and forecast 2021-2026 ($ million)
- Exhibit 38: Chart on Controllers - Year-over-year growth 2021-2026 (%)
- Exhibit 39: Data Table on Controllers - Year-over-year growth 2021-2026 (%)
- 5.6 Market opportunity by Type
- Exhibit 40: Market opportunity by Type ($ million)
6 Customer Landscape
- 6.1 Customer landscape overview
- Exhibit 41: Analysis of price sensitivity, lifecycle, customer purchase basket, adoption rates, and purchase criteria
7 Geographic Landscape
- 7.1 Geographic segmentation
- Exhibit 42: Chart on Market share by geography 2021-2026 (%)
- Exhibit 43: Data Table on Market share by geography 2021-2026 (%)
- 7.2 Geographic comparison
- Exhibit 44: Chart on Geographic comparison
- Exhibit 45: Data Table on Geographic comparison
- 7.3 North America - Market size and forecast 2021-2026
- Exhibit 46: Chart on North America - Market size and forecast 2021-2026 ($ million)
- Exhibit 47: Data Table on North America - Market size and forecast 2021-2026 ($ million)
- Exhibit 48: Chart on North America - Year-over-year growth 2021-2026 (%)
- Exhibit 49: Data Table on North America - Year-over-year growth 2021-2026 (%)
- 7.4 Europe - Market size and forecast 2021-2026
- Exhibit 50: Chart on Europe - Market size and forecast 2021-2026 ($ million)
- Exhibit 51: Data Table on Europe - Market size and forecast 2021-2026 ($ million)
- Exhibit 52: Chart on Europe - Year-over-year growth 2021-2026 (%)
- Exhibit 53: Data Table on Europe - Year-over-year growth 2021-2026 (%)
- 7.5 APAC - Market size and forecast 2021-2026
- Exhibit 54: Chart on APAC - Market size and forecast 2021-2026 ($ million)
- Exhibit 55: Data Table on APAC - Market size and forecast 2021-2026 ($ million)
- Exhibit 56: Chart on APAC - Year-over-year growth 2021-2026 (%)
- Exhibit 57: Data Table on APAC - Year-over-year growth 2021-2026 (%)
- 7.6 South America - Market size and forecast 2021-2026
- Exhibit 58: Chart on South America - Market size and forecast 2021-2026 ($ million)
- Exhibit 59: Data Table on South America - Market size and forecast 2021-2026 ($ million)
- Exhibit 60: Chart on South America - Year-over-year growth 2021-2026 (%)
- Exhibit 61: Data Table on South America - Year-over-year growth 2021-2026 (%)
- 7.7 Middle East and Africa - Market size and forecast 2021-2026
- Exhibit 62: Chart on Middle East and Africa - Market size and forecast 2021-2026 ($ million)
- Exhibit 63: Data Table on Middle East and Africa - Market size and forecast 2021-2026 ($ million)
- Exhibit 64: Chart on Middle East and Africa - Year-over-year growth 2021-2026 (%)
- Exhibit 65: Data Table on Middle East and Africa - Year-over-year growth 2021-2026 (%)
- 7.8 US - Market size and forecast 2021-2026
- Exhibit 66: Chart on US - Market size and forecast 2021-2026 ($ million)
- Exhibit 67: Data Table on US - Market size and forecast 2021-2026 ($ million)
- Exhibit 68: Chart on US - Year-over-year growth 2021-2026 (%)
- Exhibit 69: Data Table on US - Year-over-year growth 2021-2026 (%)
- 7.9 UK - Market size and forecast 2021-2026
- Exhibit 70: Chart on UK - Market size and forecast 2021-2026 ($ million)
- Exhibit 71: Data Table on UK - Market size and forecast 2021-2026 ($ million)
- Exhibit 72: Chart on UK - Year-over-year growth 2021-2026 (%)
- Exhibit 73: Data Table on UK - Year-over-year growth 2021-2026 (%)
- 7.10 Germany - Market size and forecast 2021-2026
- Exhibit 74: Chart on Germany - Market size and forecast 2021-2026 ($ million)
- Exhibit 75: Data Table on Germany - Market size and forecast 2021-2026 ($ million)
- Exhibit 76: Chart on Germany - Year-over-year growth 2021-2026 (%)
- Exhibit 77: Data Table on Germany - Year-over-year growth 2021-2026 (%)
- 7.11 China - Market size and forecast 2021-2026
- Exhibit 78: Chart on China - Market size and forecast 2021-2026 ($ million)
- Exhibit 79: Data Table on China - Market size and forecast 2021-2026 ($ million)
- Exhibit 80: Chart on China - Year-over-year growth 2021-2026 (%)
- Exhibit 81: Data Table on China - Year-over-year growth 2021-2026 (%)
- 7.12 Canada - Market size and forecast 2021-2026
- Exhibit 82: Chart on Canada - Market size and forecast 2021-2026 ($ million)
- Exhibit 83: Data Table on Canada - Market size and forecast 2021-2026 ($ million)
- Exhibit 84: Chart on Canada - Year-over-year growth 2021-2026 (%)
- Exhibit 85: Data Table on Canada - Year-over-year growth 2021-2026 (%)
- 7.13 Market opportunity by geography
- Exhibit 86: Market opportunity by geography ($ million)
8 Drivers, Challenges, and Trends
- 8.1 Market drivers
- 8.2 Market challenges
- 8.3 Impact of drivers and challenges
- Exhibit 87: Impact of drivers and challenges in 2021 and 2026
- 8.4 Market trends
9 Vendor Landscape
- 9.1 Overview
- 9.2 Vendor landscape
- Exhibit 88: Overview on Criticality of inputs and Factors of differentiation
- 9.3 Landscape disruption
- Exhibit 89: Overview on factors of disruption
- 9.4 Industry risks
- Exhibit 90: Impact of key risks on business
10 Vendor Analysis
- 10.1 Vendors covered
- Exhibit 91: Vendors covered
- 10.2 Market positioning of vendors
- Exhibit 92: Matrix on vendor position and classification
- 10.3 Casa Systems Inc.
- Exhibit 93: Casa Systems Inc. - Overview
- Exhibit 94: Casa Systems Inc. - Product / Service
- Exhibit 95: Casa Systems Inc. - Key offerings
- 10.4 Huawei Investment and Holding Co. Ltd.
- Exhibit 96: Huawei Investment and Holding Co. Ltd. - Overview
- Exhibit 97: Huawei Investment and Holding Co. Ltd. - Business segments
- Exhibit 98: Huawei Investment and Holding Co. Ltd. - Key offerings
- Exhibit 99: Huawei Investment and Holding Co. Ltd. - Segment focus
- 10.5 Intel Corp.
- Exhibit 100: Intel Corp. - Overview
- Exhibit 101: Intel Corp. - Business segments
- Exhibit 102: Intel Corp. - Key news
- Exhibit 103: Intel Corp. - Key offerings
- Exhibit 104: Intel Corp. - Segment focus
- 10.6 InterDigital Inc.
- Exhibit 105: InterDigital Inc. - Overview
- Exhibit 106: InterDigital Inc. - Product / Service
- Exhibit 107: InterDigital Inc. - Key offerings
- 10.7 Nokia Corp.
- Exhibit 108: Nokia Corp. - Overview
- Exhibit 109: Nokia Corp. - Business segments
- Exhibit 110: Nokia Corp. - Key offerings
- Exhibit 111: Nokia Corp. - Segment focus
- 10.8 Qualcomm Inc.
- Exhibit 112: Qualcomm Inc. - Overview
- Exhibit 113: Qualcomm Inc. - Business segments
- Exhibit 114: Qualcomm Inc. - Key news
- Exhibit 115: Qualcomm Inc. - Key offerings
- Exhibit 116: Qualcomm Inc. - Segment focus
- 10.9 Redline Communications Group Inc.
- Exhibit 117: Redline Communications Group Inc. - Overview
- Exhibit 118: Redline Communications Group Inc. - Business segments
- Exhibit 119: Redline Communications Group Inc. - Key offerings
- Exhibit 120: Redline Communications Group Inc. - Segment focus
- 10.10 Samsung Electronics Co. Ltd.
- Exhibit 121: Samsung Electronics Co. Ltd. - Overview
- Exhibit 122: Samsung Electronics Co. Ltd. - Business segments
- Exhibit 123: Samsung Electronics Co. Ltd. - Key news
- Exhibit 124: Samsung Electronics Co. Ltd. - Key offerings
- Exhibit 125: Samsung Electronics Co. Ltd. - Segment focus
- 10.11 Sony Group Corp.
- Exhibit 126: Sony Group Corp. - Overview
- Exhibit 127: Sony Group Corp. - Business segments
- Exhibit 128: Sony Group Corp. - Key news
- Exhibit 129: Sony Group Corp. - Key offerings
- Exhibit 130: Sony Group Corp. - Segment focus
- 10.12 Telefonaktiebolaget LM Ericsson
- Exhibit 131: Telefonaktiebolaget LM Ericsson - Overview
- Exhibit 132: Telefonaktiebolaget LM Ericsson - Business segments
- Exhibit 133: Telefonaktiebolaget LM Ericsson - Key news
- Exhibit 134: Telefonaktiebolaget LM Ericsson - Key offerings
- Exhibit 135: Telefonaktiebolaget LM Ericsson - Segment focus
11 Appendix
- 11.1 Scope of the report
- 11.2 Inclusions and exclusions checklist
- Exhibit 136: Inclusions checklist
- Exhibit 137: Exclusions checklist
- 11.3 Currency conversion rates for US$
- Exhibit 138: Currency conversion rates for US$
- 11.4 Research methodology
- Exhibit 139: Research methodology
- Exhibit 140: Validation techniques employed for market sizing
- Exhibit 141: Information sources
- 11.5 List of abbreviations
- Exhibit 142: List of abbreviations
Technavio is a leading global technology research and advisory company. Their research and analysis focus on emerging market trends and provide actionable insights to help businesses identify market opportunities and develop effective strategies to optimize their market positions. With over 500 specialized analysts, Technavio's report library consists of more than 17,000 reports and counting, covering 800 technologies, spanning across 50 countries. Their client base consists of enterprises of all sizes, including more than 100 Fortune 500 companies. This growing client base relies on Technavio's comprehensive coverage, extensive research, and actionable market insights to identify opportunities in existing and potential markets and assess their competitive positions within changing market scenarios.
Contact
Technavio Research
Jesse Maida
Media & Marketing Executive
US: +1 844 364 1100
UK: +44 203 893 3200
Email: media@technavio.com
Website: www.technavio.com/


SOURCE Technavio
© 2024 Benzinga.com. Benzinga does not provide investment advice. All rights reserved.
Trade confidently with insights and alerts from analyst ratings, free reports and breaking news that affects the stocks you care about.

