


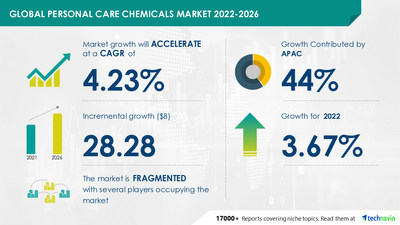
NEW YORK, Sept. 16, 2022 /PRNewswire/ -- The personal care chemicals market size is expected to grow by USD 28.28 billion at a CAGR of 4.23% during the forecast period of 2021-2026. Technavio report is compiled on research from a mix of primary interviews and secondary research, along with analytical tools that have been used to build the forecast and predictive models. The report will comprise of detailed analysis of emerging market trends, regional outlook, competitive landscape, and comprehensive analysis of different market segments helping you to plan your business strategies. Grab your Free Sample Report of Personal Care Chemicals Market Right Away!

Personal Care Chemicals Market Vendors
- Ashland Global Holdings Inc.
- BASF SE
- Berkshire Hathaway Inc.
- Clariant International Ltd.
- Corbion NV
- Croda International Plc
- Galaxy Surfactants Ltd.
- Huntsman International LLC
- Innospec Inc.
- Lonza Group Ltd.
- Merck KGaA
- Nouryon Chemicals Holding BV
- RAG-Stiftung
- Sasol Ltd.
- Solvay SA
- Stepan Co.
The personal care chemicals market will be affected by the growing demand for male personal care products. Apart from this, other market trends include an increase in demand for personal care products with active ingredients and growing R&D activities of market vendors. Buy Sample Report.
Personal Care Chemicals Market Split
- By Product
- Skincare
- Hair care
- Cosmetics
- Fragrances
- Others
- By Geography
- APAC
- Europe
- North America
- South America
- The Middle East and Africa
The market analysis is done on the basis of regional distribution helping us to utilize & make performance estimations for the international market over the period from 2021-2026. The personal care chemicals market research report shed light on the foremost regions: APAC, Europe, North America, South America, and the Middle East and Africa. Download Free Sample Report.
Imperative Insights on the following aspects:
- What was the size of the global personal care chemicals industry by value?
- What will be the size of the global personal care chemicals industry in 2026?
- What factors are affecting the strength of competition in the global personal care chemicals industry?
- How has the industry performed over the last five years?
- What are the main segments that make up the global personal care chemicals market?
The personal care chemicals market research report presents critical information and factual data about the personal care chemicals industry, with an overall statistical study of this market based on market drivers, market limitations, and its future prospects. The widespread trends and opportunities are also taken into consideration in the personal care chemicals market study.
The personal care chemicals market research report gives an overview of the personal care chemicals industry by analyzing various key segments of this personal care chemicals market based on the product and geography industries. The regional distribution of the personal care chemicals market across the globe is considered for this personal care chemicals industry analysis, the result of which is utilized to estimate the performance of the personal care chemicals market over the period from 2022 to the forecasted year.
Related Reports:
Gifts Novelty and Souvenirs Market by Product, Distribution Channel, and Geography - Forecast and Analysis 2022-2026: The gifts novelty and souvenirs market share is expected to increase by USD 13.04 billion from 2021 to 2026, and the market's growth momentum will accelerate at a CAGR of 3.4%.
Online Sex Toys Market by Product and Geography - Forecast and Analysis 2022-2026: The online sex toys market share is expected to increase by USD 7.48 billion from 2021 to 2026, and the market's growth momentum will accelerate at a CAGR of 8.25%.
Personal Care Chemicals Market Scope | |
Report Coverage | Details |
Page number | 120 |
Base year | 2021 |
Forecast period | 2022-2026 |
Growth momentum & CAGR | Accelerate at a CAGR of 4.23% |
Market growth 2022-2026 | $ 28.28 billion |
Market structure | Fragmented |
YoY growth (%) | 3.67 |
Regional analysis | APAC, Europe, North America, South America, and Middle East and Africa |
Performing market contribution | APAC at 44% |
Key consumer countries | US, China, Japan, Germany, and UK |
Competitive landscape | Leading companies, competitive strategies, consumer engagement scope |
Companies profiled | Ashland Global Holdings Inc., BASF SE, Berkshire Hathaway Inc., Clariant International Ltd., Corbion NV, Croda International Plc, Galaxy Surfactants Ltd., Huntsman International LLC, Innospec Inc., Lonza Group Ltd., Merck KGaA, Nouryon Chemicals Holding BV, RAG-Stiftung, Sasol Ltd., Solvay SA, Stepan Co., The Dow Chemical Co., and Wacker Chemie AG |
Market Dynamics | Parent market analysis, Market growth inducers and obstacles, Fast-growing and slow-growing segment analysis, COVID-19 impact and future consumer dynamics, and market condition analysis for the forecast period. |
Customization purview | If our report has not included the data that you are looking for, you can reach out to our analysts and get segments customized. |
Browse for Technavio "Consumer Staples" Research Reports
Table of Content:
1 Executive Summary
- 1.1 Market overview
- Exhibit 01: Executive Summary – Chart on Market Overview
- Exhibit 02: Executive Summary – Data Table on Market Overview
- Exhibit 03: Executive Summary – Chart on Global Market Characteristics
- Exhibit 04: Executive Summary – Chart on Market by Geography
- Exhibit 05: Executive Summary – Chart on Market Segmentation by Product
- Exhibit 06: Executive Summary – Chart on Incremental Growth
- Exhibit 07: Executive Summary – Data Table on Incremental Growth
- Exhibit 08: Executive Summary – Chart on Vendor Market Positioning
2 Market Landscape
- 2.1 Market ecosystem
- Exhibit 09: Parent market
- Exhibit 10: Market Characteristics
3 Market Sizing
- 3.1 Market definition
- Exhibit 11: Offerings of vendors included in the market definition
- 3.2 Market segment analysis
- Exhibit 12: Market segments
- 3.3 Market size 2021
- 3.4 Market outlook: Forecast for 2021-2026
- Exhibit 13: Chart on Global - Market size and forecast 2021-2026 ($ million)
- Exhibit 14: Data Table on Global - Market size and forecast 2021-2026 ($ million)
- Exhibit 15: Chart on Global Market: Year-over-year growth 2021-2026 (%)
- Exhibit 16: Data Table on Global Market: Year-over-year growth 2021-2026 (%)
4 Five Forces Analysis
- 4.1 Five forces summary
- Exhibit 17: Five forces analysis - Comparison between2021 and 2026
- 4.2 Bargaining power of buyers
- Exhibit 18: Chart on Bargaining power of buyers – Impact of key factors 2021 and 2026
- 4.3 Bargaining power of suppliers
- Exhibit 19: Bargaining power of suppliers – Impact of key factors in 2021 and 2026
- 4.4 Threat of new entrants
- Exhibit 20: Threat of new entrants – Impact of key factors in 2021 and 2026
- 4.5 Threat of substitutes
- Exhibit 21: Threat of substitutes – Impact of key factors in 2021 and 2026
- 4.6 Threat of rivalry
- Exhibit 22: Threat of rivalry – Impact of key factors in 2021 and 2026
- 4.7 Market condition
- Exhibit 23: Chart on Market condition - Five forces 2021 and 2026
5 Market Segmentation by Product
- 5.1 Market segments
- Exhibit 24: Chart on Product - Market share 2021-2026 (%)
- Exhibit 25: Data Table on Product - Market share 2021-2026 (%)
- 5.2 Comparison by Product
- Exhibit 26: Chart on Comparison by Product
- Exhibit 27: Data Table on Comparison by Product
- 5.3 Skin care - Market size and forecast 2021-2026
- Exhibit 28: Chart on Skin care - Market size and forecast 2021-2026 ($ million)
- Exhibit 29: Data Table on Skin care - Market size and forecast 2021-2026 ($ million)
- Exhibit 30: Chart on Skin care - Year-over-year growth 2021-2026 (%)
- Exhibit 31: Data Table on Skin care - Year-over-year growth 2021-2026 (%)
- 5.4 Hair care - Market size and forecast 2021-2026
- Exhibit 32: Chart on Hair care - Market size and forecast 2021-2026 ($ million)
- Exhibit 33: Data Table on Hair care - Market size and forecast 2021-2026 ($ million)
- Exhibit 34: Chart on Hair care - Year-over-year growth 2021-2026 (%)
- Exhibit 35: Data Table on Hair care - Year-over-year growth 2021-2026 (%)
- 5.5 Cosmetics - Market size and forecast 2021-2026
- Exhibit 36: Chart on Cosmetics - Market size and forecast 2021-2026 ($ million)
- Exhibit 37: Data Table on Cosmetics - Market size and forecast 2021-2026 ($ million)
- Exhibit 38: Chart on Cosmetics - Year-over-year growth 2021-2026 (%)
- Exhibit 39: Data Table on Cosmetics - Year-over-year growth 2021-2026 (%)
- 5.6 Fragrances - Market size and forecast 2021-2026
- Exhibit 40: Chart on Fragrances - Market size and forecast 2021-2026 ($ million)
- Exhibit 41: Data Table on Fragrances - Market size and forecast 2021-2026 ($ million)
- Exhibit 42: Chart on Fragrances - Year-over-year growth 2021-2026 (%)
- Exhibit 43: Data Table on Fragrances - Year-over-year growth 2021-2026 (%)
- 5.7 Others - Market size and forecast 2021-2026
- Exhibit 44: Chart on Others - Market size and forecast 2021-2026 ($ million)
- Exhibit 45: Data Table on Others - Market size and forecast 2021-2026 ($ million)
- Exhibit 46: Chart on Others - Year-over-year growth 2021-2026 (%)
- Exhibit 47: Data Table on Others - Year-over-year growth 2021-2026 (%)
- 5.8 Market opportunity by Product
- Exhibit 48: Market opportunity by Product ($ million)
6 Customer Landscape
- 6.1 Customer landscape overview
- Exhibit 49: Analysis of price sensitivity, lifecycle, customer purchase basket, adoption rates, and purchase criteria
7 Geographic Landscape
- 7.1 Geographic segmentation
- Exhibit 50: Chart on Market share by geography 2021-2026 (%)
- Exhibit 51: Data Table on Market share by geography 2021-2026 (%)
- 7.2 Geographic comparison
- Exhibit 52: Chart on Geographic comparison
- Exhibit 53: Data Table on Geographic comparison
- 7.3 APAC - Market size and forecast 2021-2026
- Exhibit 54: Chart on APAC - Market size and forecast 2021-2026 ($ million)
- Exhibit 55: Data Table on APAC - Market size and forecast 2021-2026 ($ million)
- Exhibit 56: Chart on APAC - Year-over-year growth 2021-2026 (%)
- Exhibit 57: Data Table on APAC - Year-over-year growth 2021-2026 (%)
- 7.4 Europe - Market size and forecast 2021-2026
- Exhibit 58: Chart on Europe - Market size and forecast 2021-2026 ($ million)
- Exhibit 59: Data Table on Europe - Market size and forecast 2021-2026 ($ million)
- Exhibit 60: Chart on Europe - Year-over-year growth 2021-2026 (%)
- Exhibit 61: Data Table on Europe - Year-over-year growth 2021-2026 (%)
- 7.5 North America - Market size and forecast 2021-2026
- Exhibit 62: Chart on North America - Market size and forecast 2021-2026 ($ million)
- Exhibit 63: Data Table on North America - Market size and forecast 2021-2026 ($ million)
- Exhibit 64: Chart on North America - Year-over-year growth 2021-2026 (%)
- Exhibit 65: Data Table on North America - Year-over-year growth 2021-2026 (%)
- 7.6 South America - Market size and forecast 2021-2026
- Exhibit 66: Chart on South America - Market size and forecast 2021-2026 ($ million)
- Exhibit 67: Data Table on South America - Market size and forecast 2021-2026 ($ million)
- Exhibit 68: Chart on South America - Year-over-year growth 2021-2026 (%)
- Exhibit 69: Data Table on South America - Year-over-year growth 2021-2026 (%)
- 7.7 Middle East and Africa - Market size and forecast 2021-2026
- Exhibit 70: Chart on Middle East and Africa - Market size and forecast 2021-2026 ($ million)
- Exhibit 71: Data Table on Middle East and Africa - Market size and forecast 2021-2026 ($ million)
- Exhibit 72: Chart on Middle East and Africa - Year-over-year growth 2021-2026 (%)
- Exhibit 73: Data Table on Middle East and Africa - Year-over-year growth 2021-2026 (%)
- 7.8 US - Market size and forecast 2021-2026
- Exhibit 74: Chart on US - Market size and forecast 2021-2026 ($ million)
- Exhibit 75: Data Table on US - Market size and forecast 2021-2026 ($ million)
- Exhibit 76: Chart on US - Year-over-year growth 2021-2026 (%)
- Exhibit 77: Data Table on US - Year-over-year growth 2021-2026 (%)
- 7.9 China - Market size and forecast 2021-2026
- Exhibit 78: Chart on China - Market size and forecast 2021-2026 ($ million)
- Exhibit 79: Data Table on China - Market size and forecast 2021-2026 ($ million)
- Exhibit 80: Chart on China - Year-over-year growth 2021-2026 (%)
- Exhibit 81: Data Table on China - Year-over-year growth 2021-2026 (%)
- 7.10 Japan - Market size and forecast 2021-2026
- Exhibit 82: Chart on Japan - Market size and forecast 2021-2026 ($ million)
- Exhibit 83: Data Table on Japan - Market size and forecast 2021-2026 ($ million)
- Exhibit 84: Chart on Japan - Year-over-year growth 2021-2026 (%)
- Exhibit 85: Data Table on Japan - Year-over-year growth 2021-2026 (%)
- 7.11 Germany - Market size and forecast 2021-2026
- Exhibit 86: Chart on Germany - Market size and forecast 2021-2026 ($ million)
- Exhibit 87: Data Table on Germany - Market size and forecast 2021-2026 ($ million)
- Exhibit 88: Chart on Germany - Year-over-year growth 2021-2026 (%)
- Exhibit 89: Data Table on Germany - Year-over-year growth 2021-2026 (%)
- 7.12 UK - Market size and forecast 2021-2026
- Exhibit 90: Chart on UK - Market size and forecast 2021-2026 ($ million)
- Exhibit 91: Data Table on UK - Market size and forecast 2021-2026 ($ million)
- Exhibit 92: Chart on UK - Year-over-year growth 2021-2026 (%)
- Exhibit 93: Data Table on UK - Year-over-year growth 2021-2026 (%)
- 7.13 Market opportunity by geography
- Exhibit 94: Market opportunity by geography ($ million)
8 Drivers, Challenges, and Trends
- 8.1 Market drivers
- 8.2 Market challenges
- 8.3 Impact of drivers and challenges
- Exhibit 95: Impact of drivers and challenges in 2021 and 2026
- 8.4 Market trends
9 Vendor Landscape
- 9.1 Overview
- 9.2 Vendor landscape
- Exhibit 96: Overview on Criticality of inputs and Factors of differentiation
- 9.3 Landscape disruption
- Exhibit 97: Overview on factors of disruption
- 9.4 Industry risks
- Exhibit 98: Impact of key risks on business
10 Vendor Analysis
- 10.1 Vendors covered
- Exhibit 99: Vendors covered
- 10.2 Market positioning of vendors
- Exhibit 100: Matrix on vendor position and classification
- 10.3 Ashland Global Holdings Inc.
- Exhibit 101: Ashland Global Holdings Inc. - Overview
- Exhibit 102: Ashland Global Holdings Inc. - Business segments
- Exhibit 103: Ashland Global Holdings Inc. - Key news
- Exhibit 104: Ashland Global Holdings Inc. - Key offerings
- Exhibit 105: Ashland Global Holdings Inc. - Segment focus
- 10.4 BASF SE
- Exhibit 106: BASF SE - Overview
- Exhibit 107: BASF SE - Business segments
- Exhibit 108: BASF SE - Key news
- Exhibit 109: BASF SE - Key offerings
- Exhibit 110: BASF SE - Segment focus
- 10.5 Clariant International Ltd.
- Exhibit 111: Clariant International Ltd. - Overview
- Exhibit 112: Clariant International Ltd. - Business segments
- Exhibit 113: Clariant International Ltd. - Key news
- Exhibit 114: Clariant International Ltd. - Key offerings
- Exhibit 115: Clariant International Ltd. - Segment focus
- 10.6 Croda International Plc
- Exhibit 116: Croda International Plc - Overview
- Exhibit 117: Croda International Plc - Business segments
- Exhibit 118: Croda International Plc - Key offerings
- Exhibit 119: Croda International Plc - Segment focus
- 10.7 Lonza Group Ltd.
- Exhibit 120: Lonza Group Ltd. - Overview
- Exhibit 121: Lonza Group Ltd. - Business segments
- Exhibit 122: Lonza Group Ltd. - Key offerings
- Exhibit 123: Lonza Group Ltd. - Segment focus
- 10.8 Nouryon Chemicals Holding BV
- Exhibit 124: Nouryon Chemicals Holding BV - Overview
- Exhibit 125: Nouryon Chemicals Holding BV - Business segments
- Exhibit 126: Nouryon Chemicals Holding BV - Key news
- Exhibit 127: Nouryon Chemicals Holding BV - Key offerings
- Exhibit 128: Nouryon Chemicals Holding BV - Segment focus
- 10.9 RAG-Stiftung
- Exhibit 129: RAG-Stiftung - Overview
- Exhibit 130: RAG-Stiftung - Product / Service
- Exhibit 131: RAG-Stiftung - Key offerings
- 10.10 Solvay SA
- Exhibit 132: Solvay SA - Overview
- Exhibit 133: Solvay SA - Business segments
- Exhibit 134: Solvay SA - Key news
- Exhibit 135: Solvay SA - Key offerings
- Exhibit 136: Solvay SA - Segment focus
- 10.11 The Dow Chemical Co.
- Exhibit 137: The Dow Chemical Co. - Overview
- Exhibit 138: The Dow Chemical Co. - Business segments
- Exhibit 139: The Dow Chemical Co. - Key news
- Exhibit 140: The Dow Chemical Co. - Key offerings
- Exhibit 141: The Dow Chemical Co. - Segment focus
- 10.12 Wacker Chemie AG
- Exhibit 142: Wacker Chemie AG - Overview
- Exhibit 143: Wacker Chemie AG - Business segments
- Exhibit 144: Wacker Chemie AG - Key offerings
- Exhibit 145: Wacker Chemie AG - Segment focus
11 Appendix
- 11.1 Scope of the report
- 11.2 Inclusions and exclusions checklist
- Exhibit 146: Inclusions checklist
- Exhibit 147: Exclusions checklist
- 11.3 Currency conversion rates for US$
- Exhibit 148: Currency conversion rates for US$
- 11.4 Research methodology
- Exhibit 149: Research methodology
- Exhibit 150: Validation techniques employed for market sizing
- Exhibit 151: Information sources
- 11.5 List of abbreviations
- Exhibit 152: List of abbreviations
About Us
Technavio is a leading global technology research and advisory company. Their research and analysis focus on emerging market trends and provides actionable insights to help businesses identify market opportunities and develop effective strategies to optimize their market positions. With over 500 specialized analysts, Technavio's report library consists of more than 17,000 reports and counting, covering 800 technologies, spanning across 50 countries. Their client base consists of enterprises of all sizes, including more than 100 Fortune 500 companies. This growing client base relies on Technavio's comprehensive coverage, extensive research, and actionable market insights to identify opportunities in existing and potential markets and assess their competitive positions within changing market scenarios.
Contact Us:
Technavio Research
Jesse Maida
Media & Marketing Executive
US: +1 844 364 1100
UK: +44 203 893 3200
Email: media@technavio.com
Website: www.technavio.com/


SOURCE Technavio
© 2024 Benzinga.com. Benzinga does not provide investment advice. All rights reserved.
Trade confidently with insights and alerts from analyst ratings, free reports and breaking news that affects the stocks you care about.

