


NEW YORK, Sept. 14, 2022 /PRNewswire/ -- The automotive die-stamping equipment market has grown substantially over the years. To estimate the size of the market, Technavio has tracked the recent trends and developments in the automotive die-stamping equipment market. The analysts at Technavio have considered various aspects such as the consumer base, adoption rate, average selling price, revenue generated by vendors, and various other factors to estimate the market size. Download Sample PDF Report Here to get an idea of the overall scope of the full report.

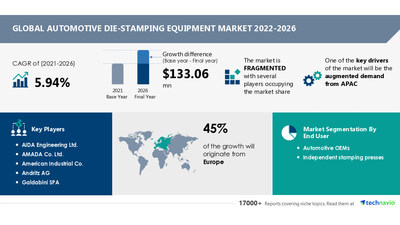
The report on the automotive die-stamping equipment market by Technavio expects the market size to increase at a CAGR of 5.94% and register an incremental growth of USD 133.06 million between 2021 and 2026. However, the growth forecast could be missed with the market growing slower than expected if the following factors come into play: high initial set-up cost and the availability of alternatives.
According to Technavio, the growth of the market is primarily driven by augmented demand from APAC.
Developing countries such as India, Singapore, Thailand, Indonesia, the Philippines, and Malaysia have observed a drastic increase in FDI in the automotive segment over the years. This can be attributed to various initiatives undertaken by governments to boost the manufacturing sector. For instance, the Make in India initiative by the Indian government has attracted significant FDI in the manufacturing sector. In October 2018, Suzuki Motors announced its plans to start building a new manufacturing facility in Gujarat, India. In addition, rapid industrial growth in countries such as China, India, and the rising adoption of electric vehicles are creating huge growth opportunities for vendors, which is fostering the growth of the market in focus.
"Rise in adoption of automation in the automotive industry and the use of lightweight metals in the automotive industry will further accelerate the growth of the market", says an analyst at Technavio.
The global automotive die-stamping equipment market is fragmented in nature and characterized by the presence of several well-established and small regional players, which makes the market extremely competitive for new entrants. Apart from top vendors, several regional and local vendors have started manufacturing customized and energy-efficient equipment. These vendors are posing tough competition to their international counterparts in terms of cost. Hence, to counter the threat from low-cost substitute products, international players in the global automotive die-stamping equipment market are constantly expanding their footprint in developing countries and are focusing on providing effective after-sales services to differentiate their products and increase their product portfolio.
Technavio identifies AIDA Engineering Ltd., AMADA Co. Ltd., American Industrial Co., Andritz AG, Galdabini SPA, Haco, Hyundai Motor Co., Industrie Automatisierungsgesellschaft mbh, JIER MACHINE-TOOL GROUP CO.LTD., Keats Manufacturing Co., Komatsu Ltd., Maschinenfabrik Lauffer GmbH and Co. KG, Macrodyne Technologies Inc., MONDRAGON Corp., and OMERA Srl as dominant players in the market.
The report breaks down the market into the following segments:
- End-user: automotive OEMs and independent stamping presses
- Geography: Europe, APAC, North America, South America, and the Middle East and Africa
Automotive OEMs are the prime end-users in the market. The growing demand and production volume of automobiles is driving the growth of the segment. In addition, the rising popularity of electric vehicles, increasing adoption of hot stamping technology, and increasing spending on new automobile production facilities in emerging markets will have a positive impact on the growth of the segment.
In terms of region, Europe will emerge as the dominant region, occupying 45% of the global market share. The increasing demand for lightweight metal components will be a key factor driving the growth of the regional market. In addition, the growth in automobile sales and the revival of the aerospace industry will further accelerate the growth of the automotive die-stamping equipment market in Europe during the forecast period.
The complete report on the global automotive die-stamping equipment market offers detailed insights on the potential business segments and regions to invest in over the forecast period. Before making the purchase, we recommend reading our Sample PDF Report.
The automotive die-stamping equipment market report answers questions such as:
- Is the market structure fragmented or concentrated?
- What was the market size in 2021 and the forecast for the automotive die-stamping equipment market through 2026?
- Which are the best product segment areas to invest in over the forecast period?
- What is the market share of dominant and strong vendors in the automotive die-stamping equipment market?
- What are the inhibiting factors and the impact of COVID-19 on the automotive die-stamping equipment market growth?
- What are the latest trends and regulatory frameworks in the automotive die-stamping equipment market?
Users who bought this report also purchased,
- Metal Stamping Market by End-user and Geography - Forecast and Analysis 2021-2025
- Roll Forming Machines Market by End-user and Geography - Forecast and Analysis 2022-2026
Automotive Die-Stamping Equipment Market Scope | |
Report Coverage | Details |
Page number | 120 |
Base year | 2021 |
Forecast period | 2022-2026 |
Growth momentum & CAGR | Accelerate at a CAGR of 5.94% |
Market growth 2022-2026 | USD 133.06 million |
Market structure | Fragmented |
YoY growth (%) | 5.12 |
Regional analysis | Europe, APAC, North America, South America, and Middle East and Africa |
Performing market contribution | Europe at 45% |
Key consumer countries | US, China, Japan, Germany, and France |
Competitive landscape | Leading companies, competitive strategies, consumer engagement scope |
Companies profiled | AIDA Engineering Ltd., AMADA Co. Ltd., American Industrial Co., Andritz AG, Galdabini SPA, Haco, Hyundai Motor Co., Industrie Automatisierungsgesellschaft mbh, JIER MACHINE-TOOL GROUP CO.LTD., Keats Manufacturing Co., Komatsu Ltd., Maschinenfabrik Lauffer GmbH and Co. KG, Macrodyne Technologies Inc., MONDRAGON Corp., and OMERA Srl |
Market Dynamics | Parent market analysis, Market growth inducers and obstacles, Fast-growing and slow-growing segment analysis, COVID-19 impact and future consumer dynamics, and market condition analysis for the forecast period. |
Customization purview | If our report has not included the data that you are looking for, you can reach out to our analysts and get segments customized. |
1 Executive Summary
- 1.1 Market overview
- Exhibit 01: Executive Summary – Chart on Market Overview
- Exhibit 02: Executive Summary – Data Table on Market Overview
- Exhibit 03: Executive Summary – Chart on Global Market Characteristics
- Exhibit 04: Executive Summary – Chart on Market by Geography
- Exhibit 05: Executive Summary – Chart on Market Segmentation by End-user
- Exhibit 06: Executive Summary – Chart on Incremental Growth
- Exhibit 07: Executive Summary – Data Table on Incremental Growth
- Exhibit 08: Executive Summary – Chart on Vendor Market Positioning
2 Market Landscape
- 2.1 Market ecosystem
- Exhibit 09: Parent market
- Exhibit 10: Market Characteristics
3 Market Sizing
- 3.1 Market definition
- Exhibit 11: Offerings of vendors included in the market definition
- 3.2 Market segment analysis
- Exhibit 12: Market segments
- 3.3 Market size 2021
- 3.4 Market outlook: Forecast for 2021-2026
- Exhibit 13: Chart on Global - Market size and forecast 2021-2026 ($ million)
- Exhibit 14: Data Table on Global - Market size and forecast 2021-2026 ($ million)
- Exhibit 15: Chart on Global Market: Year-over-year growth 2021-2026 (%)
- Exhibit 16: Data Table on Global Market: Year-over-year growth 2021-2026 (%)
4 Five Forces Analysis
- 4.1 Five forces summary
- Exhibit 17: Five forces analysis - Comparison between 2021 and 2026
- 4.2 Bargaining power of buyers
- Exhibit 18: Chart on Bargaining power of buyers – Impact of key factors 2021 and 2026
- 4.3 Bargaining power of suppliers
- Exhibit 19: Bargaining power of suppliers – Impact of key factors in 2021 and 2026
- 4.4 Threat of new entrants
- Exhibit 20: Threat of new entrants – Impact of key factors in 2021 and 2026
- 4.5 Threat of substitutes
- Exhibit 21: Threat of substitutes – Impact of key factors in 2021 and 2026
- 4.6 Threat of rivalry
- Exhibit 22: Threat of rivalry – Impact of key factors in 2021 and 2026
- 4.7 Market condition
- Exhibit 23: Chart on Market condition - Five forces 2021 and 2026
5 Market Segmentation by End-user
- 5.1 Market segments
- Exhibit 24: Chart on End-user - Market share 2021-2026 (%)
- Exhibit 25: Data Table on End-user - Market share 2021-2026 (%)
- 5.2 Comparison by End-user
- Exhibit 26: Chart on Comparison by End-user
- Exhibit 27: Data Table on Comparison by End-user
- 5.3 Automotive OEMs - Market size and forecast 2021-2026
- Exhibit 28: Chart on Automotive OEMs - Market size and forecast 2021-2026 ($ million)
- Exhibit 29: Data Table on Automotive OEMs - Market size and forecast 2021-2026 ($ million)
- Exhibit 30: Chart on Automotive OEMs - Year-over-year growth 2021-2026 (%)
- Exhibit 31: Data Table on Automotive OEMs - Year-over-year growth 2021-2026 (%)
- 5.4 Independent stamping presses - Market size and forecast 2021-2026
- Exhibit 32: Chart on Independent stamping presses - Market size and forecast 2021-2026 ($ million)
- Exhibit 33: Data Table on Independent stamping presses - Market size and forecast 2021-2026 ($ million)
- Exhibit 34: Chart on Independent stamping presses - Year-over-year growth 2021-2026 (%)
- Exhibit 35: Data Table on Independent stamping presses - Year-over-year growth 2021-2026 (%)
- 5.5 Market opportunity by End-user
- Exhibit 36: Market opportunity by End-user ($ million)
6 Customer Landscape
- 6.1 Customer landscape overview
- Exhibit 37: Analysis of price sensitivity, lifecycle, customer purchase basket, adoption rates, and purchase criteria
7 Geographic Landscape
- 7.1 Geographic segmentation
- Exhibit 38: Chart on Market share by geography 2021-2026 (%)
- Exhibit 39: Data Table on Market share by geography 2021-2026 (%)
- 7.2 Geographic comparison
- Exhibit 40: Chart on Geographic comparison
- Exhibit 41: Data Table on Geographic comparison
- 7.3 Europe - Market size and forecast 2021-2026
- Exhibit 42: Chart on Europe - Market size and forecast 2021-2026 ($ million)
- Exhibit 43: Data Table on Europe - Market size and forecast 2021-2026 ($ million)
- Exhibit 44: Chart on Europe - Year-over-year growth 2021-2026 (%)
- Exhibit 45: Data Table on Europe - Year-over-year growth 2021-2026 (%)
- 7.4 APAC - Market size and forecast 2021-2026
- Exhibit 46: Chart on APAC - Market size and forecast 2021-2026 ($ million)
- Exhibit 47: Data Table on APAC - Market size and forecast 2021-2026 ($ million)
- Exhibit 48: Chart on APAC - Year-over-year growth 2021-2026 (%)
- Exhibit 49: Data Table on APAC - Year-over-year growth 2021-2026 (%)
- 7.5 North America - Market size and forecast 2021-2026
- Exhibit 50: Chart on North America - Market size and forecast 2021-2026 ($ million)
- Exhibit 51: Data Table on North America - Market size and forecast 2021-2026 ($ million)
- Exhibit 52: Chart on North America - Year-over-year growth 2021-2026 (%)
- Exhibit 53: Data Table on North America - Year-over-year growth 2021-2026 (%)
- 7.6 South America - Market size and forecast 2021-2026
- Exhibit 54: Chart on South America - Market size and forecast 2021-2026 ($ million)
- Exhibit 55: Data Table on South America - Market size and forecast 2021-2026 ($ million)
- Exhibit 56: Chart on South America - Year-over-year growth 2021-2026 (%)
- Exhibit 57: Data Table on South America - Year-over-year growth 2021-2026 (%)
- 7.7 Middle East and Africa - Market size and forecast 2021-2026
- Exhibit 58: Chart on Middle East and Africa - Market size and forecast 2021-2026 ($ million)
- Exhibit 59: Data Table on Middle East and Africa - Market size and forecast 2021-2026 ($ million)
- Exhibit 60: Chart on Middle East and Africa - Year-over-year growth 2021-2026 (%)
- Exhibit 61: Data Table on Middle East and Africa - Year-over-year growth 2021-2026 (%)
- 7.8 China - Market size and forecast 2021-2026
- Exhibit 62: Chart on China - Market size and forecast 2021-2026 ($ million)
- Exhibit 63: Data Table on China - Market size and forecast 2021-2026 ($ million)
- Exhibit 64: Chart on China - Year-over-year growth 2021-2026 (%)
- Exhibit 65: Data Table on China - Year-over-year growth 2021-2026 (%)
- 7.9 US - Market size and forecast 2021-2026
- Exhibit 66: Chart on US - Market size and forecast 2021-2026 ($ million)
- Exhibit 67: Data Table on US - Market size and forecast 2021-2026 ($ million)
- Exhibit 68: Chart on US - Year-over-year growth 2021-2026 (%)
- Exhibit 69: Data Table on US - Year-over-year growth 2021-2026 (%)
- 7.10 Germany - Market size and forecast 2021-2026
- Exhibit 70: Chart on Germany - Market size and forecast 2021-2026 ($ million)
- Exhibit 71: Data Table on Germany - Market size and forecast 2021-2026 ($ million)
- Exhibit 72: Chart on Germany - Year-over-year growth 2021-2026 (%)
- Exhibit 73: Data Table on Germany - Year-over-year growth 2021-2026 (%)
- 7.11 France - Market size and forecast 2021-2026
- Exhibit 74: Chart on France - Market size and forecast 2021-2026 ($ million)
- Exhibit 75: Data Table on France - Market size and forecast 2021-2026 ($ million)
- Exhibit 76: Chart on France - Year-over-year growth 2021-2026 (%)
- Exhibit 77: Data Table on France - Year-over-year growth 2021-2026 (%)
- 7.12 Japan - Market size and forecast 2021-2026
- Exhibit 78: Chart on Japan - Market size and forecast 2021-2026 ($ million)
- Exhibit 79: Data Table on Japan - Market size and forecast 2021-2026 ($ million)
- Exhibit 80: Chart on Japan - Year-over-year growth 2021-2026 (%)
- Exhibit 81: Data Table on Japan - Year-over-year growth 2021-2026 (%)
- 7.13 Market opportunity by geography
- Exhibit 82: Market opportunity by geography ($ million)
8 Drivers, Challenges, and Trends
- 8.1 Market drivers
- 8.2 Market challenges
- 8.3 Impact of drivers and challenges
- Exhibit 83: Impact of drivers and challenges in 2021 and 2026
- 8.4 Market trends
9 Vendor Landscape
- 9.1 Overview
- 9.2 Vendor landscape
- Exhibit 84: Overview on Criticality of inputs and Factors of differentiation
- 9.3 Landscape disruption
- Exhibit 85: Overview on factors of disruption
- 9.4 Industry risks
- Exhibit 86: Impact of key risks on business
10 Vendor Analysis
- 10.1 Vendors covered
- Exhibit 87: Vendors covered
- 10.2 Market positioning of vendors
- Exhibit 88: Matrix on vendor position and classification
- 10.3 AIDA Engineering Ltd.
- Exhibit 89: AIDA Engineering Ltd. - Overview
- Exhibit 90: AIDA Engineering Ltd. - Business segments
- Exhibit 91: AIDA Engineering Ltd. - Key offerings
- Exhibit 92: AIDA Engineering Ltd. - Segment focus
- 10.4 AMADA Co. Ltd.
- Exhibit 93: AMADA Co. Ltd. - Overview
- Exhibit 94: AMADA Co. Ltd. - Business segments
- Exhibit 95: AMADA Co. Ltd. - Key news
- Exhibit 96: AMADA Co. Ltd. - Key offerings
- Exhibit 97: AMADA Co. Ltd. - Segment focus
- 10.5 Andritz AG
- Exhibit 98: Andritz AG - Overview
- Exhibit 99: Andritz AG - Business segments
- Exhibit 100: Andritz AG - Key offerings
- Exhibit 101: Andritz AG - Segment focus
- 10.6 Galdabini SPA
- Exhibit 102: Galdabini SPA - Overview
- Exhibit 103: Galdabini SPA - Product / Service
- Exhibit 104: Galdabini SPA - Key offerings
- 10.7 Haco
- Exhibit 105: Haco - Overview
- Exhibit 106: Haco - Product / Service
- Exhibit 107: Haco - Key offerings
- 10.8 Hyundai Motor Co.
- Exhibit 108: Hyundai Motor Co. - Overview
- Exhibit 109: Hyundai Motor Co. - Business segments
- Exhibit 110: Hyundai Motor Co. - Key news
- Exhibit 111: Hyundai Motor Co. - Key offerings
- Exhibit 112: Hyundai Motor Co. - Segment focus
- 10.9 Industrie Automatisierungsgesellschaft mbh
- Exhibit 113: Industrie Automatisierungsgesellschaft mbh - Overview
- Exhibit 114: Industrie Automatisierungsgesellschaft mbh - Product / Service
- Exhibit 115: Industrie Automatisierungsgesellschaft mbh - Key offerings
- 10.10 JIER MACHINE-TOOL GROUP CO.LTD.
- Exhibit 116: JIER MACHINE-TOOL GROUP CO.LTD. - Overview
- Exhibit 117: JIER MACHINE-TOOL GROUP CO.LTD. - Product / Service
- Exhibit 118: JIER MACHINE-TOOL GROUP CO.LTD. - Key offerings
- 10.11 Komatsu Ltd.
- Exhibit 119: Komatsu Ltd. - Overview
- Exhibit 120: Komatsu Ltd. - Business segments
- Exhibit 121: Komatsu Ltd. - Key news
- Exhibit 122: Komatsu Ltd. - Key offerings
- Exhibit 123: Komatsu Ltd. - Segment focus
- 10.12 Macrodyne Technologies Inc.
- Exhibit 124: Macrodyne Technologies Inc. - Overview
- Exhibit 125: Macrodyne Technologies Inc. - Product / Service
- Exhibit 126: Macrodyne Technologies Inc. - Key news
- Exhibit 127: Macrodyne Technologies Inc. - Key offerings
11 Appendix
- 11.1 Scope of the report
- 11.2 Inclusions and exclusions checklist
- Exhibit 128: Inclusions checklist
- Exhibit 129: Exclusions checklist
- 11.3 Currency conversion rates for US$
- Exhibit 130: Currency conversion rates for US$
- 11.4 Research methodology
- Exhibit 131: Research methodology
- Exhibit 132: Validation techniques employed for market sizing
- Exhibit 133: Information sources
- 11.5 List of abbreviations
- Exhibit 134: List of abbreviations
- in manufacturing industry: Market dynamics in some major processes and discrete industries are changing drastically, and manufacturers are gradually feeling the brunt of excessive demand fluctuations. The fluctuating prices of oil and gas and metals in the global market and the shortage of a skilled workforce worldwide have directly affected the profitability of manufacturing companies. A sudden and unexpected shift in market dynamics can drastically impact manufacturing processes and investments in capital goods.
- slowdown in the automotive industry: High motorization rates in North America and Europe, the increase in tariffs on imported vehicles in the US and China, and the global economic slowdown are likely to reduce vehicle sales in the coming years. Anticipating a decline in vehicle sales, several vehicle manufacturers are halting their vehicle production. For instance, in March 2019, Ford announced the shutdown of its three vehicle-manufacturing sites in Russia. Similarly, in August 2019, Mahindra and Mahindra Ltd. stopped vehicle production at its manufacturing units in India for 8-14 days. During the same month, Maruti Suzuki announced that it had cut its vehicle production for the sixth consecutive month in 2019. In August 2019, Honda announced a halt in car production at its Argentina-based manufacturing plants. Such a slowdown in the automotive industry is expected to hamper the growth of the market during the forecast period.
Technavio is a leading global technology research and advisory company. Their research and analysis focus on emerging market trends and provides actionable insights to help businesses identify market opportunities and develop effective strategies to optimize their market positions. With over 500 specialized analysts, Technavio's report library consists of more than 17,000 reports and counting, covering 800 technologies, spanning across 50 countries. Their client base consists of enterprises of all sizes, including more than 100 Fortune 500 companies. This growing client base relies on Technavio's comprehensive coverage, extensive research, and actionable market insights to identify opportunities in existing and potential markets and assess their competitive positions within changing market scenarios.
Contact
Technavio Research
Jesse Maida
Media & Marketing Executive
US: +1 844 364 1100
UK: +44 203 893 3200
Email: media@technavio.com
Website: www.technavio.com/


SOURCE Technavio
© 2024 Benzinga.com. Benzinga does not provide investment advice. All rights reserved.
Trade confidently with insights and alerts from analyst ratings, free reports and breaking news that affects the stocks you care about.

