


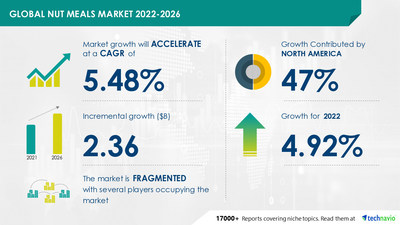
NEW YORK, Sept. 9, 2022 /PRNewswire/ -- The "Nut Meals Market Research by Product and Geography - Forecast and Analysis 2022-2026" report has been added to Technavio's offering. The report expects the market size to grow by USD 2.36 billion between 2021 and 2026, expanding at a CAGR of 5.48% during the forecast period. The report considers various aspects such as the consumer base, adoption rate, average selling price, revenue generated by vendors, and various other factors to estimate the market size. Download Sample PDF Report Here

The global nut meals market is fragmented owing to the presence of several vendors operating in the market. Vendors mainly compete in the market by introducing new products and launching marketing campaigns. Vendors in the market compete on factors such as price, quality, innovation, service, packaging, brand image, distribution, and promotion. Besides, any technological advances by one player in the market can render products from other vendors obsolete or uneconomical. Vendors also focus on diversifying business operations and positioning their products, making the competition intense during the forecast period.
The report identifies Blue Diamond Growers, Bobs Red Mill Natural Foods Inc., COFCO International, Detroit Gourmet Nut Co., HBS Natural Choice, Honeyville Inc., Kanegrade Ltd., King Arthur Baking Co. Inc., Ludlow Nut Co. Ltd., McCormick and Co. Inc., NOW Health Group Inc., Oh Nuts, Royal Nut Co., Sun Organic Farm, Superior Nut Co. Inc., The Hershey Co., The Wonderful Co. LLC, and Tierra Farm as some of the major market participants.
Although the increasing demand from millennials will offer immense growth opportunities, stringent government regulations in most developed countries will challenge the growth of the market participants. To make the most of the opportunities, market vendors should focus more on the growth prospects in the fast-growing segments, while maintaining their positions in the slow-growing segments. Request Sample Report Here
The global nut meals market is segmented as below:
- Product
- Inorganic Nut Meals
- Organic Nut Meals
The market growth in the inorganic nut meals segment will be significant over the forecast period. Inorganic nut meals are affordable and are available in the form of different packages. This is the key factor driving the growth of the segment.
- Geography
- North America
- Europe
- APAC
- The Middle East and Africa
- South America
North America will emerge as the key market, occupying 47% of the global market share. The increasing demand for convenient sources of nutrition that can be consumed on the go, such as nut meals is driving the growth of the regional market. Technavio presents a detailed picture of the market by the way of study, synthesis, and summation of data from multiple sources. Our nut meals market report covers the following areas:
We provide a detailed analysis of around 25 vendors operating in the nut meals market. Backed with competitive intelligence and benchmarking, our research report on the nut meals market is designed to provide entry support, customer profile, and M&As as well as go-to-market strategy support.
- CAGR of the market during the forecast period 2022-2026
- Detailed information on factors that will assist nut meals market growth during the next five years
- Estimation of the nut meals market size and its contribution to the parent market
- Predictions on upcoming trends and changes in consumer behavior
- The growth of the nut meals market
- Analysis of the market's competitive landscape and detailed information on vendors
- Comprehensive details of factors that will challenge the growth of nut meals market vendors
- Almond Ingredients Market by Type and Geography - Forecast and Analysis 2022-2026
- Macadamia Milk Market by Type and Geography - Forecast and Analysis 2022-2026
Nut Meals Market Scope | |
Report Coverage | Details |
Page number | 120 |
Base year | 2021 |
Forecast period | 2022-2026 |
Growth momentum & CAGR | Accelerate at a CAGR of 5.48% |
Market growth 2022-2026 | USD 2.36 billion |
Market structure | Fragmented |
YoY growth (%) | 4.92 |
Regional analysis | North America, Europe, APAC, Middle East and Africa, and South America |
Performing market contribution | North America at 47% |
Key consumer countries | US, China, Germany, France, and UK |
Competitive landscape | Leading companies, competitive strategies, consumer engagement scope |
Companies profiled | Blue Diamond Growers, Bobs Red Mill Natural Foods Inc., COFCO International, Detriot Gourmet Nut Co., HBS Natural Choice, Honeyville Inc., Kanegrade Ltd., King Arthur Baking Co. Inc., Ludlow Nut Co. Ltd., McCormick and Co. Inc., NOW Health Group Inc., Oh Nuts, Royal Nut Co., Sun Organic Farm, Superior Nut Co. Inc., The Hershey Co., The Wonderful Co. LLC, and Tierra Farm |
Market Dynamics | Parent market analysis, Market growth inducers and obstacles, Fast-growing and slow-growing segment analysis, COVID 19 impact and future consumer dynamics, market condition analysis for the forecast period. |
Customization purview | If our report has not included the data that you are looking for, you can reach out to our analysts and get segments customized. |
1 Executive Summary
- 1.1 Market overview
- Exhibit 01: Executive Summary – Chart on Market Overview
- Exhibit 02: Executive Summary – Data Table on Market Overview
- Exhibit 03: Executive Summary – Chart on Global Market Characteristics
- Exhibit 04: Executive Summary – Chart on Market by Geography
- Exhibit 05: Executive Summary – Chart on Market Segmentation by Product
- Exhibit 06: Executive Summary – Chart on Incremental Growth
- Exhibit 07: Executive Summary – Data Table on Incremental Growth
- Exhibit 08: Executive Summary – Chart on Vendor Market Positioning
2 Market Landscape
- 2.1 Market ecosystem
- Exhibit 09: Parent market
- Exhibit 10: Market Characteristics
3 Market Sizing
- 3.1 Market definition
- Exhibit 11: Offerings of vendors included in the market definition
- 3.2 Market segment analysis
- Exhibit 12: Market segments
- 3.3 Market size 2021
- 3.4 Market outlook: Forecast for 2021-2026
- Exhibit 13: Chart on Global - Market size and forecast 2021-2026 ($ million)
- Exhibit 14: Data Table on Global - Market size and forecast 2021-2026 ($ million)
- Exhibit 15: Chart on Global Market: Year-over-year growth 2021-2026 (%)
- Exhibit 16: Data Table on Global Market: Year-over-year growth 2021-2026 (%)
4 Five Forces Analysis
- 4.1 Five forces summary
- Exhibit 17: Five forces analysis - Comparison between 2021 and 2026
- 4.2 Bargaining power of buyers
- Exhibit 18: Chart on Bargaining power of buyers – Impact of key factors 2021 and 2026
- 4.3 Bargaining power of suppliers
- Exhibit 19: Bargaining power of suppliers – Impact of key factors in 2021 and 2026
- 4.4 Threat of new entrants
- Exhibit 20: Threat of new entrants – Impact of key factors in 2021 and 2026
- 4.5 Threat of substitutes
- Exhibit 21: Threat of substitutes – Impact of key factors in 2021 and 2026
- 4.6 Threat of rivalry
- Exhibit 22: Threat of rivalry – Impact of key factors in 2021 and 2026
- 4.7 Market condition
- Exhibit 23: Chart on Market condition - Five forces 2021 and 2026
5 Market Segmentation by Product
- 5.1 Market segments
- Exhibit 24: Chart on Product - Market share 2021-2026 (%)
- Exhibit 25: Data Table on Product - Market share 2021-2026 (%)
- 5.2 Comparison by Product
- Exhibit 26: Chart on Comparison by Product
- Exhibit 27: Data Table on Comparison by Product
- 5.3 Inorganic nut meals - Market size and forecast 2021-2026
- Exhibit 28: Chart on Inorganic nut meals - Market size and forecast 2021-2026 ($ million)
- Exhibit 29: Data Table on Inorganic nut meals - Market size and forecast 2021-2026 ($ million)
- Exhibit 30: Chart on Inorganic nut meals - Year-over-year growth 2021-2026 (%)
- Exhibit 31: Data Table on Inorganic nut meals - Year-over-year growth 2021-2026 (%)
- 5.4 Organic nut meals - Market size and forecast 2021-2026
- Exhibit 32: Chart on Organic nut meals - Market size and forecast 2021-2026 ($ million)
- Exhibit 33: Data Table on Organic nut meals - Market size and forecast 2021-2026 ($ million)
- Exhibit 34: Chart on Organic nut meals - Year-over-year growth 2021-2026 (%)
- Exhibit 35: Data Table on Organic nut meals - Year-over-year growth 2021-2026 (%)
- 5.5 Market opportunity by Product
- Exhibit 36: Market opportunity by Product ($ million)
6 Customer Landscape
- 6.1 Customer landscape overview
- Exhibit 37: Analysis of price sensitivity, lifecycle, customer purchase basket, adoption rates, and purchase criteria
7 Geographic Landscape
- 7.1 Geographic segmentation
- Exhibit 38: Chart on Market share by geography 2021-2026 (%)
- Exhibit 39: Data Table on Market share by geography 2021-2026 (%)
- 7.2 Geographic comparison
- Exhibit 40: Chart on Geographic comparison
- Exhibit 41: Data Table on Geographic comparison
- 7.3 North America - Market size and forecast 2021-2026
- Exhibit 42: Chart on North America - Market size and forecast 2021-2026 ($ million)
- Exhibit 43: Data Table on North America - Market size and forecast 2021-2026 ($ million)
- Exhibit 44: Chart on North America - Year-over-year growth 2021-2026 (%)
- Exhibit 45: Data Table on North America - Year-over-year growth 2021-2026 (%)
- 7.4 Europe - Market size and forecast 2021-2026
- Exhibit 46: Chart on Europe - Market size and forecast 2021-2026 ($ million)
- Exhibit 47: Data Table on Europe - Market size and forecast 2021-2026 ($ million)
- Exhibit 48: Chart on Europe - Year-over-year growth 2021-2026 (%)
- Exhibit 49: Data Table on Europe - Year-over-year growth 2021-2026 (%)
- 7.5 APAC - Market size and forecast 2021-2026
- Exhibit 50: Chart on APAC - Market size and forecast 2021-2026 ($ million)
- Exhibit 51: Data Table on APAC - Market size and forecast 2021-2026 ($ million)
- Exhibit 52: Chart on APAC - Year-over-year growth 2021-2026 (%)
- Exhibit 53: Data Table on APAC - Year-over-year growth 2021-2026 (%)
- 7.6 Middle East and Africa - Market size and forecast 2021-2026
- Exhibit 54: Chart on Middle East and Africa - Market size and forecast 2021-2026 ($ million)
- Exhibit 55: Data Table on Middle East and Africa - Market size and forecast 2021-2026 ($ million)
- Exhibit 56: Chart on Middle East and Africa - Year-over-year growth 2021-2026 (%)
- Exhibit 57: Data Table on Middle East and Africa - Year-over-year growth 2021-2026 (%)
- 7.7 South America - Market size and forecast 2021-2026
- Exhibit 58: Chart on South America - Market size and forecast 2021-2026 ($ million)
- Exhibit 59: Data Table on South America - Market size and forecast 2021-2026 ($ million)
- Exhibit 60: Chart on South America - Year-over-year growth 2021-2026 (%)
- Exhibit 61: Data Table on South America - Year-over-year growth 2021-2026 (%)
- 7.8 US - Market size and forecast 2021-2026
- Exhibit 62: Chart on US - Market size and forecast 2021-2026 ($ million)
- Exhibit 63: Data Table on US - Market size and forecast 2021-2026 ($ million)
- Exhibit 64: Chart on US - Year-over-year growth 2021-2026 (%)
- Exhibit 65: Data Table on US - Year-over-year growth 2021-2026 (%)
- 7.9 Germany - Market size and forecast 2021-2026
- Exhibit 66: Chart on Germany - Market size and forecast 2021-2026 ($ million)
- Exhibit 67: Data Table on Germany - Market size and forecast 2021-2026 ($ million)
- Exhibit 68: Chart on Germany - Year-over-year growth 2021-2026 (%)
- Exhibit 69: Data Table on Germany - Year-over-year growth 2021-2026 (%)
- 7.10 France - Market size and forecast 2021-2026
- Exhibit 70: Chart on France - Market size and forecast 2021-2026 ($ million)
- Exhibit 71: Data Table on France - Market size and forecast 2021-2026 ($ million)
- Exhibit 72: Chart on France - Year-over-year growth 2021-2026 (%)
- Exhibit 73: Data Table on France - Year-over-year growth 2021-2026 (%)
- 7.11 China - Market size and forecast 2021-2026
- Exhibit 74: Chart on China - Market size and forecast 2021-2026 ($ million)
- Exhibit 75: Data Table on China - Market size and forecast 2021-2026 ($ million)
- Exhibit 76: Chart on China - Year-over-year growth 2021-2026 (%)
- Exhibit 77: Data Table on China - Year-over-year growth 2021-2026 (%)
- 7.12 UK - Market size and forecast 2021-2026
- Exhibit 78: Chart on UK - Market size and forecast 2021-2026 ($ million)
- Exhibit 79: Data Table on UK - Market size and forecast 2021-2026 ($ million)
- Exhibit 80: Chart on UK - Year-over-year growth 2021-2026 (%)
- Exhibit 81: Data Table on UK - Year-over-year growth 2021-2026 (%)
- 7.13 Market opportunity by geography
- Exhibit 82: Market opportunity by geography ($ million)
8 Drivers, Challenges, and Trends
- 8.1 Market drivers
- 8.2 Market challenges
- 8.3 Impact of drivers and challenges
- Exhibit 83: Impact of drivers and challenges in 2021 and 2026
- 8.4 Market trends
9 Vendor Landscape
- 9.1 Overview
- 9.2 Vendor landscape
- Exhibit 84: Overview on Criticality of inputs and Factors of differentiation
- 9.3 Landscape disruption
- Exhibit 85: Overview on factors of disruption
- 9.4 Industry risks
- Exhibit 86: Impact of key risks on business
10 Vendor Analysis
- 10.1 Vendors covered
- Exhibit 87: Vendors covered
- 10.2 Market positioning of vendors
- Exhibit 88: Matrix on vendor position and classification
- 10.3 Blue Diamond Growers
- Exhibit 89: Blue Diamond Growers - Overview
- Exhibit 90: Blue Diamond Growers - Product / Service
- Exhibit 91: Blue Diamond Growers - Key offerings
- 10.4 Bobs Red Mill Natural Foods Inc.
- Exhibit 92: Bobs Red Mill Natural Foods Inc. - Overview
- Exhibit 93: Bobs Red Mill Natural Foods Inc. - Product / Service
- Exhibit 94: Bobs Red Mill Natural Foods Inc. - Key offerings
- 10.5 HBS Natural Choice
- Exhibit 95: HBS Natural Choice - Overview
- Exhibit 96: HBS Natural Choice - Product / Service
- Exhibit 97: HBS Natural Choice - Key offerings
- 10.6 Honeyville Inc.
- Exhibit 98: Honeyville Inc. - Overview
- Exhibit 99: Honeyville Inc. - Product / Service
- Exhibit 100: Honeyville Inc. - Key offerings
- 10.7 Kanegrade Ltd.
- Exhibit 101: Kanegrade Ltd. - Overview
- Exhibit 102: Kanegrade Ltd. - Product / Service
- Exhibit 103: Kanegrade Ltd. - Key offerings
- 10.8 King Arthur Baking Co. Inc.
- Exhibit 104: King Arthur Baking Co. Inc. - Overview
- Exhibit 105: King Arthur Baking Co. Inc. - Product / Service
- Exhibit 106: King Arthur Baking Co. Inc. - Key offerings
- 10.9 Ludlow Nut Co. Ltd.
- Exhibit 107: Ludlow Nut Co. Ltd. - Overview
- Exhibit 108: Ludlow Nut Co. Ltd. - Product / Service
- Exhibit 109: Ludlow Nut Co. Ltd. - Key offerings
- 10.10 Oh Nuts
- Exhibit 110: Oh Nuts - Overview
- Exhibit 111: Oh Nuts - Product / Service
- Exhibit 112: Oh Nuts - Key offerings
- 10.11 Royal Nut Co.
- Exhibit 113: Royal Nut Co. - Overview
- Exhibit 114: Royal Nut Co. - Product / Service
- Exhibit 115: Royal Nut Co. - Key offerings
- 10.12 Tierra Farm
- Exhibit 116: Tierra Farm - Overview
- Exhibit 117: Tierra Farm - Product / Service
- Exhibit 118: Tierra Farm - Key offerings
11 Appendix
- 11.1 Scope of the report
- 11.2 Inclusions and exclusions checklist
- Exhibit 119: Inclusions checklist
- Exhibit 120: Exclusions checklist
- 11.3 Currency conversion rates for US$
- Exhibit 121: Currency conversion rates for US$
- 11.4 Research methodology
- Exhibit 122: Research methodology
- Exhibit 123: Validation techniques employed for market sizing
- Exhibit 124: Information sources
- 11.5 List of abbreviations
- Exhibit 125: List of abbreviations
- food allergy among consumers: There is an increase in the number of people suffering from food allergies globally. Food allergy is caused when the immune system reacts to the ingestion of certain foods. Ingredients of packaged foods and meats that can create allergic reactions in some people include (but are not limited to) milk, eggs, fish, crustacean shellfish (e.g., crab, lobster, and shrimp), tree nuts (e.g., almonds, walnuts, and pecan), peanuts, wheat, and soybeans. Even consumption of small amounts of food allergens can trigger signs and symptoms such as digestive problems, hives, and swollen airways. In some people, a food allergy can cause severe symptoms, or even a life-threatening reaction is, known as anaphylaxis. For example, in the US, nearly 3% of the adult population suffers from shellfish allergy.
Technavio is a leading global technology research and advisory company. Their research and analysis focus on emerging market trends and provides actionable insights to help businesses identify market opportunities and develop effective strategies to optimize their market positions. With over 500 specialized analysts, Technavio's report library consists of more than 17,000 reports and counting, covering 800 technologies, spanning across 50 countries. Their client base consists of enterprises of all sizes, including more than 100 Fortune 500 companies. This growing client base relies on Technavio's comprehensive coverage, extensive research, and actionable market insights to identify opportunities in existing and potential markets and assess their competitive positions within changing market scenarios.
Contact
Technavio Research
Jesse Maida
Media & Marketing Executive
US: +1 844 364 1100
UK: +44 203 893 3200
Email: media@technavio.com
Website: www.technavio.com/


SOURCE Technavio
© 2024 Benzinga.com. Benzinga does not provide investment advice. All rights reserved.
Trade confidently with insights and alerts from analyst ratings, free reports and breaking news that affects the stocks you care about.

