


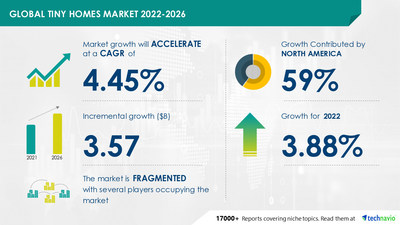
NEW YORK, Sept. 2, 2022 /PRNewswire/ -- The global tiny homes market size is forecasted to grow by USD 3.57 billion, accelerating at a CAGR of 4.45% between 2021 and 2026. Technavio segments the market by product (mobile tiny homes and stationary tiny homes) and geography (North America, Europe, APAC, South America, and the Middle East and Africa). The report provides a comprehensive analysis of recent developments, new product launches, major revenue-generating segments, and market behavior across geographies.

- Market estimates and forecast 2022-2026
- Key drivers, trends, and challenges impacting market growth
- Segment-wise, region-wise, and country-wide analysis
- Analysis of market share by vendors
- Key product launches and regulatory climate
- Post-COVID-19 impact on the market landscape
Get a comprehensive report summary describing the market size and forecast along with research methodology. The FREE sample report is available in PDF format
Technavio categorizes the global tiny homes market as a part of the homebuilding market within the overall global household durables industry. The global homebuilding market consists of companies engaged in the construction of single-family homes and multi-family homes and home remodeling and renovation.
The market is primarily driven by the affordability by the mass section of the population. Tiny homes cost a fraction of the cost of traditional homes and can be designed based on customers' requirements. The average price of a tiny home ranges from USD 10,000 to USD 30,000. On the other hand, constructing a conventional is expensive, which compels consumers to opt for tiny homes. These factors are driving the market growth.
The full report provides information on other drivers, trends, and challenges that are impacting the growth of the market. Request a FREE Sample PDF Report
The mobile tiny homes segment is expected to generate maximum revenue in the tiny homes market during the forecast period. The demand for mobile tiny homes is expected to grow significantly in the next five years, with the rise in the cost of conventional homes. The growth of tourism is also expected to increase the revenue of the mobile tiny homes segment during the forecast period.
North America is expected to dominate the tiny homes market with a 59% share during the forecast period. Factors such as the rise in housing prices and consumer interest in investing in pre-built or custom-built homes are driving the growth of the regional market. Market growth in this region will be faster than the growth of the market in other regions. The US and Canada are the key countries for the tiny homes market in North America.
The market is fragmented, and the vendors are deploying growth strategies such as pricing and marketing strategies to retain their existing market shares and seize new market opportunities to compete in the market. The market has numerous large, small, and medium-sized manufacturers. Most of the large and established players have extensive sales and distribution networks globally, whereas most small players are concentrated in the regional markets. Vendors compete based on parameters such as price, quality, technology, brand identity, and distribution.
- American Tiny House
- Aussie Tiny Houses
- BAAHOUSE and BAASTUDIO PTY LTD.
- Berkshire Hathaway Inc.
- Cavco Industries Inc.
- Designer ECO Tiny Homes
- Handcrafted Movement
- Heirloom Inc.
- HONOMOBO
- Humble Hand Craft
- ICON Technology Inc.
- La Tiny House
- Meka Inc.
- Mini Mansions Tiny Home Builders LLC
- Molecule Tiny Homes
- Mustard Seed Tiny Homes LLC
- New Frontier Tiny Homes
- Oregon Cottage Co.
- Skyline Champion Corp.
- Tiny Eco Homes UK Ltd.
- Tiny Home Builders
- Tiny SMART House Inc.
- Tumbleweed Tiny House Co.
Didn't find what you are looking for? Our analysts can help you customize this report based on your business requirements. The industry experts at Technavio will work directly with you to understand your needs and provide you with customized data in a short time. Speak to our Analyst Now
House Wraps Market by Type and Geography - Forecast and Analysis 2022-2026
Kitchen Sinks Market Growth, Size, Trends, Analysis Report by Type, Application, Region, and Segment Forecast 2022-2026
Tiny Homes Market Scope | |
Report Coverage | Details |
Page number | 120 |
Base year | 2021 |
Forecast period | 2022-2026 |
Growth momentum & CAGR | Accelerate at a CAGR of 4.45% |
Market growth 2022-2026 | USD 3.57 billion |
Market structure | Fragmented |
YoY growth (%) | 3.88 |
Regional analysis | North America, Europe, APAC, South America, and Middle East and Africa |
Performing market contribution | North America at 59% |
Key consumer countries | US, Canada, UK, Germany, and France |
Competitive landscape | Leading companies, Competitive strategies, Consumer engagement scope |
Key companies profiled | American Tiny House, Aussie Tiny Houses, BAAHOUSE and BAASTUDIO PTY LTD., Berkshire Hathaway Inc., Cavco Industries Inc., Designer ECO Tiny Homes, Handcrafted Movement, Heirloom Inc., HONOMOBO, Humble Hand Craft, ICON Technology Inc., La Tiny House, Meka Inc., Mini Mansions Tiny Home Builders LLC, Molecule Tiny Homes, Mustard Seed Tiny Homes LLC, New Frontier Tiny Homes, Oregon Cottage Co., Skyline Champion Corp., Tiny Eco Homes UK Ltd., Tiny Home Builders, Tiny SMART House Inc., and Tumbleweed Tiny House Co. |
Market dynamics | Parent market analysis, market growth inducers and obstacles, fast-growing and slow-growing segment analysis, COVID-19 impact and recovery analysis and future consumer dynamics, and market condition analysis for the forecast period. |
Customization purview | If our report has not included the data that you are looking for, you can reach out to our analysts and get segments customized. |
- 1.1 Market overview
- Exhibit 01: Executive Summary – Chart on Market Overview
- Exhibit 02: Executive Summary – Data Table on Market Overview
- Exhibit 03: Executive Summary – Chart on Global Market Characteristics
- Exhibit 04: Executive Summary – Chart on Market by Geography
- Exhibit 05: Executive Summary – Chart on Market Segmentation by Product
- Exhibit 06: Executive Summary – Chart on Incremental Growth
- Exhibit 07: Executive Summary – Data Table on Incremental Growth
- Exhibit 08: Executive Summary – Chart on Vendor Market Positioning
- 2.1 Market ecosystem
- Exhibit 09: Parent market
- Exhibit 10: Market Characteristics
- 3.1 Market definition
- Exhibit 11: Offerings of vendors included in the market definition
- 3.2 Market segment analysis
- Exhibit 12: Market segments
- 3.3 Market size 2021
- 3.4 Market outlook: Forecast for 2021-2026
- Exhibit 13: Chart on Global - Market size and forecast 2021-2026 ($ million)
- Exhibit 14: Data Table on Global - Market size and forecast 2021-2026 ($ million)
- Exhibit 15: Chart on Global Market: Year-over-year growth 2021-2026 (%)
- Exhibit 16: Data Table on Global Market: Year-over-year growth 2021-2026 (%)
- 4.1 Five forces summary
- Exhibit 17: Five forces analysis - Comparison between 2021 and 2026
- 4.2 Bargaining power of buyers
- Exhibit 18: Bargaining power of buyers – Impact of key factors in 2021 and 2026
- 4.3 Bargaining power of suppliers
- Exhibit 19: Bargaining power of suppliers – Impact of key factors in 2021 and 2026
- 4.4 Threat of new entrants
- Exhibit 20: Threat of new entrants – Impact of key factors in 2021 and 2026
- 4.5 Threat of substitutes
- Exhibit 21: Threat of substitutes – Impact of key factors in 2021 and 2026
- 4.6 Threat of rivalry
- Exhibit 22: Threat of rivalry – Impact of key factors in 2021 and 2026
- 4.7 Market condition
- Exhibit 23: Chart on Market condition - Five forces 2021 and 2026
- 5.1 Market segments
- Exhibit 24: Chart on Product - Market share 2021-2026 (%)
- Exhibit 25: Data Table on Product - Market share 2021-2026 (%)
- 5.2 Comparison by Product
- Exhibit 26: Chart on Comparison by Product
- Exhibit 27: Data Table on Comparison by Product
- 5.3 Mobile tiny homes - Market size and forecast 2021-2026
- Exhibit 28: Chart on Mobile tiny homes - Market size and forecast 2021-2026 ($ million)
- Exhibit 29: Data Table on Mobile tiny homes - Market size and forecast 2021-2026 ($ million)
- Exhibit 30: Chart on Mobile tiny homes - Year-over-year growth 2021-2026 (%)
- Exhibit 31: Data Table on Mobile tiny homes - Year-over-year growth 2021-2026 (%)
- 5.4 Stationary tiny homes - Market size and forecast 2021-2026
- Exhibit 32: Chart on Stationary tiny homes - Market size and forecast 2021-2026 ($ million)
- Exhibit 33: Data Table on Stationary tiny homes - Market size and forecast 2021-2026 ($ million)
- Exhibit 34: Chart on Stationary tiny homes - Year-over-year growth 2021-2026 (%)
- Exhibit 35: Data Table on Stationary tiny homes - Year-over-year growth 2021-2026 (%)
- 5.5 Market opportunity by Product
- Exhibit 36: Market opportunity by Product ($ million)
- 6.1 Customer landscape overview
- Exhibit 37: Analysis of price sensitivity, lifecycle, customer purchase basket, adoption rates, and purchase criteria
- 7.1 Geographic segmentation
- Exhibit 38: Chart on Market share by geography 2021-2026 (%)
- Exhibit 39: Data Table on Market share by geography 2021-2026 (%)
- 7.2 Geographic comparison
- Exhibit 40: Chart on Geographic comparison
- Exhibit 41: Data Table on Geographic comparison
- 7.3 North America - Market size and forecast 2021-2026
- Exhibit 42: Chart on North America - Market size and forecast 2021-2026 ($ million)
- Exhibit 43: Data Table on North America - Market size and forecast 2021-2026 ($ million)
- Exhibit 44: Chart on North America - Year-over-year growth 2021-2026 (%)
- Exhibit 45: Data Table on North America - Year-over-year growth 2021-2026 (%)
- 7.4 Europe - Market size and forecast 2021-2026
- Exhibit 46: Chart on Europe - Market size and forecast 2021-2026 ($ million)
- Exhibit 47: Data Table on Europe - Market size and forecast 2021-2026 ($ million)
- Exhibit 48: Chart on Europe - Year-over-year growth 2021-2026 (%)
- Exhibit 49: Data Table on Europe - Year-over-year growth 2021-2026 (%)
- 7.5 APAC - Market size and forecast 2021-2026
- Exhibit 50: Chart on APAC - Market size and forecast 2021-2026 ($ million)
- Exhibit 51: Data Table on APAC - Market size and forecast 2021-2026 ($ million)
- Exhibit 52: Chart on APAC - Year-over-year growth 2021-2026 (%)
- Exhibit 53: Data Table on APAC - Year-over-year growth 2021-2026 (%)
- 7.6 South America - Market size and forecast 2021-2026
- Exhibit 54: Chart on South America - Market size and forecast 2021-2026 ($ million)
- Exhibit 55: Data Table on South America - Market size and forecast 2021-2026 ($ million)
- Exhibit 56: Chart on South America - Year-over-year growth 2021-2026 (%)
- Exhibit 57: Data Table on South America - Year-over-year growth 2021-2026 (%)
- 7.7 Middle East and Africa - Market size and forecast 2021-2026
- Exhibit 58: Chart on Middle East and Africa - Market size and forecast 2021-2026 ($ million)
- Exhibit 59: Data Table on Middle East and Africa - Market size and forecast 2021-2026 ($ million)
- Exhibit 60: Chart on Middle East and Africa - Year-over-year growth 2021-2026 (%)
- Exhibit 61: Data Table on Middle East and Africa - Year-over-year growth 2021-2026 (%)
- 7.8 US - Market size and forecast 2021-2026
- Exhibit 62: Chart on US - Market size and forecast 2021-2026 ($ million)
- Exhibit 63: Data Table on US - Market size and forecast 2021-2026 ($ million)
- Exhibit 64: Chart on US - Year-over-year growth 2021-2026 (%)
- Exhibit 65: Data Table on US - Year-over-year growth 2021-2026 (%)
- 7.9 Canada - Market size and forecast 2021-2026
- Exhibit 66: Chart on Canada - Market size and forecast 2021-2026 ($ million)
- Exhibit 67: Data Table on Canada - Market size and forecast 2021-2026 ($ million)
- Exhibit 68: Chart on Canada - Year-over-year growth 2021-2026 (%)
- Exhibit 69: Data Table on Canada - Year-over-year growth 2021-2026 (%)
- 7.10 UK - Market size and forecast 2021-2026
- Exhibit 70: Chart on UK - Market size and forecast 2021-2026 ($ million)
- Exhibit 71: Data Table on UK - Market size and forecast 2021-2026 ($ million)
- Exhibit 72: Chart on UK - Year-over-year growth 2021-2026 (%)
- Exhibit 73: Data Table on UK - Year-over-year growth 2021-2026 (%)
- 7.11 Germany - Market size and forecast 2021-2026
- Exhibit 74: Chart on Germany - Market size and forecast 2021-2026 ($ million)
- Exhibit 75: Data Table on Germany - Market size and forecast 2021-2026 ($ million)
- Exhibit 76: Chart on Germany - Year-over-year growth 2021-2026 (%)
- Exhibit 77: Data Table on Germany - Year-over-year growth 2021-2026 (%)
- 7.12 France - Market size and forecast 2021-2026
- Exhibit 78: Chart on France - Market size and forecast 2021-2026 ($ million)
- Exhibit 79: Data Table on France - Market size and forecast 2021-2026 ($ million)
- Exhibit 80: Chart on France - Year-over-year growth 2021-2026 (%)
- Exhibit 81: Data Table on France - Year-over-year growth 2021-2026 (%)
- 7.13 Market opportunity by geography
- Exhibit 82: Market opportunity by geography ($ million)
- 8.1 Market drivers
- 8.2 Market challenges
- 8.3 Impact of drivers and challenges
- Exhibit 83: Impact of drivers and challenges in 2021 and 2026
- 8.4 Market trends
- 9.1 Overview
- 9.2 Vendor landscape
- Exhibit 84: Overview on Criticality of inputs and Factors of differentiation
- 9.3 Landscape disruption
- Exhibit 85: Overview on factors of disruption
- 9.4 Industry risks
- Exhibit 86: Impact of key risks on business
- 10.1 Vendors covered
- Exhibit 87: Vendors covered
- 10.2 Market positioning of vendors
- Exhibit 88: Matrix on vendor position and classification
- 10.3 Berkshire Hathaway Inc.
- Exhibit 89: Berkshire Hathaway Inc. - Overview
- Exhibit 90: Berkshire Hathaway Inc. - Business segments
- Exhibit 91: Berkshire Hathaway Inc. - Key offerings
- Exhibit 92: Berkshire Hathaway Inc. - Segment focus
- 10.4 Cavco Industries Inc.
- Exhibit 93: Cavco Industries Inc. - Overview
- Exhibit 94: Cavco Industries Inc. - Business segments
- Exhibit 95: Cavco Industries Inc. - Key offerings
- Exhibit 96: Cavco Industries Inc. - Segment focus
- 10.5 Handcrafted Movement
- Exhibit 97: Handcrafted Movement - Overview
- Exhibit 98: Handcrafted Movement - Product / Service
- Exhibit 99: Handcrafted Movement - Key offerings
- 10.6 Heirloom Inc.
- Exhibit 100: Heirloom Inc. - Overview
- Exhibit 101: Heirloom Inc. - Product / Service
- Exhibit 102: Heirloom Inc. - Key offerings
- 10.7 Humble Hand Craft
- Exhibit 103: Humble Hand Craft - Overview
- Exhibit 104: Humble Hand Craft - Product / Service
- Exhibit 105: Humble Hand Craft - Key offerings
- 10.8 Oregon Cottage Co.
- Exhibit 106: Oregon Cottage Co. - Overview
- Exhibit 107: Oregon Cottage Co. - Product / Service
- Exhibit 108: Oregon Cottage Co. - Key offerings
- 10.9 Skyline Champion Corp.
- Exhibit 109: Skyline Champion Corp. - Overview
- Exhibit 110: Skyline Champion Corp. - Business segments
- Exhibit 111: Skyline Champion Corp. - Key offerings
- Exhibit 112: Skyline Champion Corp. - Segment focus
- 10.10 Tiny Home Builders
- Exhibit 113: Tiny Home Builders - Overview
- Exhibit 114: Tiny Home Builders - Product / Service
- Exhibit 115: Tiny Home Builders - Key offerings
- 10.11 Tiny SMART House Inc.
- Exhibit 116: Tiny SMART House Inc. - Overview
- Exhibit 117: Tiny SMART House Inc. - Product / Service
- Exhibit 118: Tiny SMART House Inc. - Key offerings
- 10.12 Tumbleweed Tiny House Co.
- Exhibit 119: Tumbleweed Tiny House Co. - Overview
- Exhibit 120: Tumbleweed Tiny House Co. - Product / Service
- Exhibit 121: Tumbleweed Tiny House Co. - Key offerings
- 11.1 Scope of the report
- 11.2 Inclusions and exclusions checklist
- Exhibit 122: Inclusions checklist
- Exhibit 123: Exclusions checklist
- 11.3 Currency conversion rates for US$
- Exhibit 124: Currency conversion rates for US$
- 11.4 Research methodology
- Exhibit 125: Research methodology
- Exhibit 126: Validation techniques employed for market sizing
- Exhibit 127: Information sources
- 11.5 List of abbreviations
- Exhibit 128: List of abbreviations
Technavio is a leading global technology research and advisory company. Their research and analysis focus on emerging market trends and provide actionable insights to help businesses identify market opportunities and develop effective strategies to optimize their market positions. With over 500 specialized analysts, Technavio's report library consists of more than 17,000 reports and counting, covering 800 technologies, spanning across 50 countries. Their client base consists of enterprises of all sizes, including more than 100 Fortune 500 companies. This growing client base relies on Technavio's comprehensive coverage, extensive research, and actionable market insights to identify opportunities in existing and potential markets and assess their competitive positions within changing market scenarios.
Technavio Research
Jesse Maida
Media & Marketing Executive
US: +1 844 364 1100
UK: +44 203 893 3200
Email: media@technavio.com
Website: www.technavio.com/


SOURCE Technavio
© 2024 Benzinga.com. Benzinga does not provide investment advice. All rights reserved.
Trade confidently with insights and alerts from analyst ratings, free reports and breaking news that affects the stocks you care about.

