


NEW YORK, Aug. 30, 2022 /PRNewswire/ -- The "Payday Loans Market by Type (Storefront payday loans and Online payday loans) and Geography (North America, Europe, APAC, South America, Middle East and Africa, US, China, UK, Japan, and Germany) - Forecast and Analysis 2022-2026" report has been added to Technavio's offering. With ISO 9001:2015 certification, Technavio is proudly partnering with more than 100 Fortune 500 companies for over 16 years.

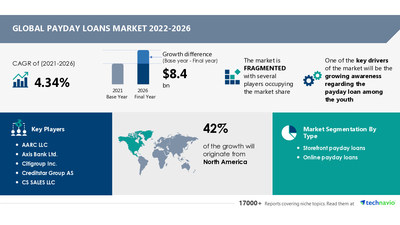
The potential growth difference for the payday loans market between 2021 and 2026 is USD 8.4 bn. To get the exact yearly growth variance and the Y-O-Y growth rate, Request a FREE PDF Sample Report
- Market Driver: The growing awareness regarding the payday loan among the youth is driving the growth of the market. Approximately, one-third of people aged 25 to 34 have a college loan, which is the largest source of debt for Generation Z. Due to the debt, individuals have to seek payday loans, which is fueling the growth of the fintech industry. In addition, the growing cost of living globally has led to significant pressure on college students to repay their debts. Thus, many young people are preferring online payday loans, which will fuel the growth of the market in focus during the forecast period.
- Market Challenge: Payday loans are considered predatory, which is hampering the growth of the market. Payday loans target individuals that have low incomes and poor credit. These individuals are also targeted by several other vendors and financial institutions. However, payday lenders have a negative reputation for chasing unpaid loans aggressively. Thus, their reputation may challenge the payday loans market growth during the forecast period.
Technavio offers key drivers, trends, and challenges that will impact the future of the market. View our FREE PDF Sample Report right now!
The payday loans market report is segmented by type (storefront payday loans and online payday loans) and geography (North America, Europe, APAC, South America, and the Middle East and Africa). North America will be the leading region with 42% of the market's growth during the forecast period. The US is the key country for the payday loans market in North America.
Learn about the contribution of each segment summarized in concise infographics and thorough descriptions. View a FREE PDF Sample Report
The global payday loans market is fragmented due to the presence of numerous regional and global players. Vendors compete in terms of differentiated product offerings and business expansions. Some major players have a vast geographical presence and market outreach. To survive and succeed in such a competitive environment, vendors need to distinguish their offerings through clear and unique value propositions.
- AARC LLC
- Axis Bank Ltd.
- Citigroup Inc.
- Creditstar Group AS
- CS SALES LLC
- DJS UK Ltd.
- Enova International Inc.
- FloatMe Corp.
- GAIN Credit Inc.
- GC DataTech Ltd.
- Kotak Mahindra Bank Ltd.
- KrazyBee Services Pvt. Ltd.
- Maxed Up Media Ltd.
- Payday America Inc.
- Payday Loans Ltd.
- PDL Finance Ltd.
- Speedy Cash
- Upward Finance Ltd.
- Western Circle Ltd.
- Whizdm Innovations Pvt. Ltd.
Want your report customized? Speak to an analyst and personalize your report according to your needs.
Unsecured Business Loans Market Growth, Size, Trends, Analysis Report by Type, Application, Region and Segment Forecast 2022-2026
Micro Lending Market by Source and Geography - Forecast and Analysis 2022-2026
Payday Loans Market Scope | |
Report Coverage | Details |
Page number | 120 |
Base year | 2021 |
Forecast period | 2022-2026 |
Growth momentum & CAGR | Accelerate at a CAGR of 4.34% |
Market growth 2022-2026 | USD 8.4 billion |
Market structure | Fragmented |
YoY growth (%) | 3.58 |
Regional analysis | North America, Europe, APAC, South America, Middle East and Africa, US, China, UK, Japan, and Germany |
Performing market contribution | North America at 42% |
Key consumer countries | US, China, Japan, UK, and Germany |
Competitive landscape | Leading companies, competitive strategies, consumer engagement scope |
Companies profiled | AARC LLC, Axis Bank Ltd., Citigroup Inc., Creditstar Group AS, CS SALES LLC, DJS UK Ltd., Enova International Inc., FloatMe Corp., GAIN Credit Inc., GC DataTech Ltd., Kotak Mahindra Bank Ltd., KrazyBee Services Pvt. Ltd., Maxed Up Media Ltd., Payday America Inc., Payday Loans Ltd., PDL Finance Ltd., Speedy Cash, Upward Finance Ltd., Western Circle Ltd., and Whizdm Innovations Pvt. Ltd. |
Market Dynamics | Parent market analysis, market growth inducers and obstacles, fast-growing and slow-growing segment analysis, COVID-19 impact and future consumer dynamics, and market condition analysis for the forecast period. |
Customization purview | If our report has not included the data that you are looking for, you can reach out to our analysts and get segments customized. |
Browse Consumer Discretionary Market Reports
1 Executive Summary
- 1.1 Market overview
- Exhibit 01: Executive Summary – Chart on Market Overview
- Exhibit 02: Executive Summary – Data Table on Market Overview
- Exhibit 03: Executive Summary – Chart on Global Market Characteristics
- Exhibit 04: Executive Summary – Chart on Market by Geography
- Exhibit 05: Executive Summary – Chart on Market Segmentation by Type
- Exhibit 06: Executive Summary – Chart on Incremental Growth
- Exhibit 07: Executive Summary – Data Table on Incremental Growth
- Exhibit 08: Executive Summary – Chart on Vendor Market Positioning
2 Market Landscape
- 2.1 Market ecosystem
- Exhibit 09: Parent market
- Exhibit 10: Market Characteristics
3 Market Sizing
- 3.1 Market definition
- Exhibit 11: Offerings of vendors included in the market definition
- 3.2 Market segment analysis
- Exhibit 12: Market segments
- 3.3 Market size 2021
- 3.4 Market outlook: Forecast for 2021-2026
- Exhibit 13: Chart on Global - Market size and forecast 2021-2026 ($ billion)
- Exhibit 14: Data Table on Global - Market size and forecast 2021-2026 ($ billion)
- Exhibit 15: Chart on Global Market: Year-over-year growth 2021-2026 (%)
- Exhibit 16: Data Table on Global Market: Year-over-year growth 2021-2026 (%)
4 Five Forces Analysis
- 4.1 Five forces summary
- Exhibit 17: Five forces analysis - Comparison between 2021 and 2026
- 4.2 Bargaining power of buyers
- Exhibit 18: Chart on Bargaining power of buyers – Impact of key factors 2021 and 2026
- 4.3 Bargaining power of suppliers
- Exhibit 19: Bargaining power of suppliers – Impact of key factors in 2021 and 2026
- 4.4 Threat of new entrants
- Exhibit 20: Threat of new entrants – Impact of key factors in 2021 and 2026
- 4.5 Threat of substitutes
- Exhibit 21: Threat of substitutes – Impact of key factors in 2021 and 2026
- 4.6 Threat of rivalry
- Exhibit 22: Threat of rivalry – Impact of key factors in 2021 and 2026
- 4.7 Market condition
- Exhibit 23: Chart on Market condition - Five forces 2021 and 2026
5 Market Segmentation by Type
- 5.1 Market segments
- Exhibit 24: Chart on Type - Market share 2021-2026 (%)
- Exhibit 25: Data Table on Type - Market share 2021-2026 (%)
- 5.2 Comparison by Type
- Exhibit 26: Chart on Comparison by Type
- Exhibit 27: Data Table on Comparison by Type
- 5.3 Storefront payday loans - Market size and forecast 2021-2026
- Exhibit 28: Chart on Storefront payday loans - Market size and forecast 2021-2026 ($ billion)
- Exhibit 29: Data Table on Storefront payday loans - Market size and forecast 2021-2026 ($ billion)
- Exhibit 30: Chart on Storefront payday loans - Year-over-year growth 2021-2026 (%)
- Exhibit 31: Data Table on Storefront payday loans - Year-over-year growth 2021-2026 (%)
- 5.4 Online payday loans - Market size and forecast 2021-2026
- Exhibit 32: Chart on Online payday loans - Market size and forecast 2021-2026 ($ billion)
- Exhibit 33: Data Table on Online payday loans - Market size and forecast 2021-2026 ($ billion)
- Exhibit 34: Chart on Online payday loans - Year-over-year growth 2021-2026 (%)
- Exhibit 35: Data Table on Online payday loans - Year-over-year growth 2021-2026 (%)
- 5.5 Market opportunity by Type
- Exhibit 36: Market opportunity by Type ($ billion)
6 Customer Landscape
- 6.1 Customer landscape overview
- Exhibit 37: Analysis of price sensitivity, lifecycle, customer purchase basket, adoption rates, and purchase criteria
7 Geographic Landscape
- 7.1 Geographic segmentation
- Exhibit 38: Chart on Market share by geography 2021-2026 (%)
- Exhibit 39: Data Table on Market share by geography 2021-2026 (%)
- 7.2 Geographic comparison
- Exhibit 40: Chart on Geographic comparison
- Exhibit 41: Data Table on Geographic comparison
- 7.3 North America - Market size and forecast 2021-2026
- Exhibit 42: Chart on North America - Market size and forecast 2021-2026 ($ billion)
- Exhibit 43: Data Table on North America - Market size and forecast 2021-2026 ($ billion)
- Exhibit 44: Chart on North America - Year-over-year growth 2021-2026 (%)
- Exhibit 45: Data Table on North America - Year-over-year growth 2021-2026 (%)
- 7.4 Europe - Market size and forecast 2021-2026
- Exhibit 46: Chart on Europe - Market size and forecast 2021-2026 ($ billion)
- Exhibit 47: Data Table on Europe - Market size and forecast 2021-2026 ($ billion)
- Exhibit 48: Chart on Europe - Year-over-year growth 2021-2026 (%)
- Exhibit 49: Data Table on Europe - Year-over-year growth 2021-2026 (%)
- 7.5 APAC - Market size and forecast 2021-2026
- Exhibit 50: Chart on APAC - Market size and forecast 2021-2026 ($ billion)
- Exhibit 51: Data Table on APAC - Market size and forecast 2021-2026 ($ billion)
- Exhibit 52: Chart on APAC - Year-over-year growth 2021-2026 (%)
- Exhibit 53: Data Table on APAC - Year-over-year growth 2021-2026 (%)
- 7.6 South America - Market size and forecast 2021-2026
- Exhibit 54: Chart on South America - Market size and forecast 2021-2026 ($ billion)
- Exhibit 55: Data Table on South America - Market size and forecast 2021-2026 ($ billion)
- Exhibit 56: Chart on South America - Year-over-year growth 2021-2026 (%)
- Exhibit 57: Data Table on South America - Year-over-year growth 2021-2026 (%)
- 7.7 Middle East and Africa - Market size and forecast 2021-2026
- Exhibit 58: Chart on Middle East and Africa - Market size and forecast 2021-2026 ($ billion)
- Exhibit 59: Data Table on Middle East and Africa - Market size and forecast 2021-2026 ($ billion)
- Exhibit 60: Chart on Middle East and Africa - Year-over-year growth 2021-2026 (%)
- Exhibit 61: Data Table on Middle East and Africa - Year-over-year growth 2021-2026 (%)
- 7.8 US - Market size and forecast 2021-2026
- Exhibit 62: Chart on US - Market size and forecast 2021-2026 ($ billion)
- Exhibit 63: Data Table on US - Market size and forecast 2021-2026 ($ billion)
- Exhibit 64: Chart on US - Year-over-year growth 2021-2026 (%)
- Exhibit 65: Data Table on US - Year-over-year growth 2021-2026 (%)
- 7.9 China - Market size and forecast 2021-2026
- Exhibit 66: Chart on China - Market size and forecast 2021-2026 ($ billion)
- Exhibit 67: Data Table on China - Market size and forecast 2021-2026 ($ billion)
- Exhibit 68: Chart on China - Year-over-year growth 2021-2026 (%)
- Exhibit 69: Data Table on China - Year-over-year growth 2021-2026 (%)
- 7.10 UK - Market size and forecast 2021-2026
- Exhibit 70: Chart on UK - Market size and forecast 2021-2026 ($ billion)
- Exhibit 71: Data Table on UK - Market size and forecast 2021-2026 ($ billion)
- Exhibit 72: Chart on UK - Year-over-year growth 2021-2026 (%)
- Exhibit 73: Data Table on UK - Year-over-year growth 2021-2026 (%)
- 7.11 Japan - Market size and forecast 2021-2026
- Exhibit 74: Chart on Japan - Market size and forecast 2021-2026 ($ billion)
- Exhibit 75: Data Table on Japan - Market size and forecast 2021-2026 ($ billion)
- Exhibit 76: Chart on Japan - Year-over-year growth 2021-2026 (%)
- Exhibit 77: Data Table on Japan - Year-over-year growth 2021-2026 (%)
- 7.12 Germany - Market size and forecast 2021-2026
- Exhibit 78: Chart on Germany - Market size and forecast 2021-2026 ($ billion)
- Exhibit 79: Data Table on Germany - Market size and forecast 2021-2026 ($ billion)
- Exhibit 80: Chart on Germany - Year-over-year growth 2021-2026 (%)
- Exhibit 81: Data Table on Germany - Year-over-year growth 2021-2026 (%)
- 7.13 Market opportunity by geography
- Exhibit 82: Market opportunity by geography ($ billion)
8 Drivers, Challenges, and Trends
- 8.1 Market drivers
- 8.2 Market challenges
- 8.3 Impact of drivers and challenges
- Exhibit 83: Impact of drivers and challenges in 2021 and 2026
- 8.4 Market trends
9 Vendor Landscape
- 9.1 Overview
- 9.2 Vendor landscape
- Exhibit 84: Overview on Criticality of inputs and Factors of differentiation
- 9.3 Landscape disruption
- Exhibit 85: Overview on factors of disruption
- 9.4 Industry risks
- Exhibit 86: Impact of key risks on business
10 Vendor Analysis
- 10.1 Vendors covered
- Exhibit 87: Vendors covered
- 10.2 Market positioning of vendors
- Exhibit 88: Matrix on vendor position and classification
- 10.3 Creditstar Group AS
- Exhibit 89: Creditstar Group AS - Overview
- Exhibit 90: Creditstar Group AS - Product / Service
- Exhibit 91: Creditstar Group AS - Key offerings
- 10.4 CS SALES LLC
- Exhibit 92: CS SALES LLC - Overview
- Exhibit 93: CS SALES LLC - Product / Service
- Exhibit 94: CS SALES LLC - Key offerings
- 10.5 Enova International Inc.
- Exhibit 95: Enova International Inc. - Overview
- Exhibit 96: Enova International Inc. - Product / Service
- Exhibit 97: Enova International Inc. - Key offerings
- 10.6 GAIN Credit Inc.
- Exhibit 98: GAIN Credit Inc. - Overview
- Exhibit 99: GAIN Credit Inc. - Product / Service
- Exhibit 100: GAIN Credit Inc. - Key offerings
- 10.7 GC DataTech Ltd.
- Exhibit 101: GC DataTech Ltd. - Overview
- Exhibit 102: GC DataTech Ltd. - Product / Service
- Exhibit 103: GC DataTech Ltd. - Key offerings
- 10.8 Kotak Mahindra Bank Ltd.
- Exhibit 104: Kotak Mahindra Bank Ltd. - Overview
- Exhibit 105: Kotak Mahindra Bank Ltd. - Business segments
- Exhibit 106: Kotak Mahindra Bank Ltd. - Key offerings
- Exhibit 107: Kotak Mahindra Bank Ltd. - Segment focus
- 10.9 PDL Finance Ltd.
- Exhibit 108: PDL Finance Ltd. - Overview
- Exhibit 109: PDL Finance Ltd. - Product / Service
- Exhibit 110: PDL Finance Ltd. - Key offerings
- 10.10 Speedy Cash
- Exhibit 111: Speedy Cash - Overview
- Exhibit 112: Speedy Cash - Product / Service
- Exhibit 113: Speedy Cash - Key offerings
- 10.11 Upward Finance Ltd.
- Exhibit 114: Upward Finance Ltd. - Overview
- Exhibit 115: Upward Finance Ltd. - Product / Service
- Exhibit 116: Upward Finance Ltd. - Key offerings
- 10.12 Western Circle Ltd.
- Exhibit 117: Western Circle Ltd. - Overview
- Exhibit 118: Western Circle Ltd. - Product / Service
- Exhibit 119: Western Circle Ltd. - Key offerings
11 Appendix
- 11.1 Scope of the report
- 11.2 Inclusions and exclusions checklist
- Exhibit 120: Inclusions checklist
- Exhibit 121: Exclusions checklist
- 11.3 Currency conversion rates for US$
- Exhibit 122: Currency conversion rates for US$
- 11.4 Research methodology
- Exhibit 123: Research methodology
- Exhibit 124: Validation techniques employed for market sizing
- Exhibit 125: Information sources
- 11.5 List of abbreviations
- Exhibit 126: List of abbreviations
Technavio is a leading global technology research and advisory company. Their research and analysis focus on emerging market trends and provide actionable insights to help businesses identify market opportunities and develop effective strategies to optimize their market positions.
With over 500 specialized analysts, Technavio's report library consists of more than 17,000 reports and counting, covering 800 technologies, spanning across 50 countries. Their client base consists of enterprises of all sizes, including more than 100 Fortune 500 companies. This growing client base relies on Technavio's comprehensive coverage, extensive research, and actionable market insights to identify opportunities in existing and potential markets and assess their competitive positions within changing market scenarios.
Contact
Technavio Research
Jesse Maida
Media & Marketing Executive
US: +1 844 364 1100
UK: +44 203 893 3200
Email:media@technavio.com
Website: www.technavio.com/


SOURCE Technavio
© 2024 Benzinga.com. Benzinga does not provide investment advice. All rights reserved.
Trade confidently with insights and alerts from analyst ratings, free reports and breaking news that affects the stocks you care about.

