


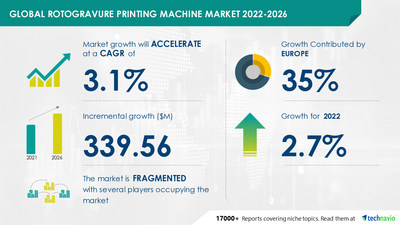
NEW YORK, Aug. 30, 2022 /PRNewswire/ -- The Rotogravure Printing Machine Market is expected to grow by USD 339.56 million at a CAGR of 3.1% during the forecast period of 2021-2026. Technavio report is compiled on research from a mix of primary interviews and secondary research, along with analytical tools that have been used to build the forecast and predictive models. The report will comprise of detailed analysis of emerging market trends, regional outlook, competitive landscape, and comprehensive analysis of different market segments helping you to plan your business strategies.

Technavio rotogravure printing machine market report has been prepared by focusing on both qualitative & quantitative aspects which cover- market trends, market drivers, Five forces analysis, challenges, key factors, Market size and forecast, Market segmentation, Geographical insights, and Competitive Landscape. Grab your Free Sample Report on the Rotogravure Printing Machine Market Right Away!
- Bobst Group SA
- Comexi Group Industries SAU
- DCM ATN SAS
- Fuji Kikai Kogyo Co. Ltd.
- Hsing Wei Machine Industry Co. Ltd.
- HYPLAS Machinery Co. Ltd.
- J M Heaford Ltd.
- Jiangyin Huitong Packaging Machinery Co. Ltd.
- Jiangyin Lida Printing and Packaging Machinery
- KKA Gmbh
- Pelican Rotoflex Pvt. Ltd.
- QUEENS Machinery Co. Ltd.
The expanding demand in the e-commerce industry is one of the major reasons propelling the growth of the worldwide rotogravure printing machine market. The emergence of e-commerce has boosted the demand for rotogravure printing on goods of all sizes and shapes. Due to ease, a lot of people are converting from traditional to internet purchasing. To ensure safe delivery, online retailers use corrugated boxes and other packaging based on the kind of goods being shipped. Buy Sample Report.
- By Type
- Automatic rotogravure printing machine
- Manual rotogravure printing machine
- By Geography
- Europe
- North America
- APAC
- The Middle East and Africa
- South America
Europe will account for 35% of market growth. The two biggest markets in Europe for rotogravure printing equipment are Germany and the UK. The market in this region will grow more quickly than the markets in North and South America. Its adoption by emerging small-scale manufacturers has increased due to the rising demand for rotogravure printing machines from the packaging manufacturing industries and the presence of key vendors, which will facilitate the growth of the rotogravure printing machine market in Europe course of the forecast period. Download Free Sample Report.
Related Reports:
Security Printing Market Growth, Size, Trends, Analysis Report by Type, Application, Region, and Segment Forecast 2022-2026: The security printing market share is expected to increase to USD 5.45 billion from 2021 to 2026, and the market's growth momentum will accelerate at a CAGR of 4.5%.
Publishing Market by Platform and Geography - Forecast and Analysis 2022-2026: The publishing market share is projected to increase to USD 19.2 billion in 2026 at a CAGR of 1.22%.
Flexographic Printing Machine Market by Application and Geography - Forecast and Analysis 2022-2026: According to Technavio's analyst, the flexographic printing machine market size is expected to be valued at USD 502.93 million by 2026 with a progressing CAGR of 6.14%.
Rotogravure Printing Machine Market Scope | |
Report Coverage | Details |
Page number | 120 |
Base year | 2021 |
Forecast period | 2022-2026 |
Growth momentum & CAGR | Accelerate at a CAGR of 3.1% |
Market growth 2022-2026 | $ 339.56 million |
Market structure | Fragmented |
YoY growth (%) | 2.7 |
Regional analysis | Europe, North America, APAC, Middle East and Africa, and South America |
Performing market contribution | Europe at 35% |
Key consumer countries | US, China, Japan, Germany, and UK |
Competitive landscape | Leading companies, Competitive strategies, Consumer engagement scope |
Key companies profiled | Bobst Group SA, Comexi Group Industries SAU, DCM ATN SAS, Fuji Kikai Kogyo Co. Ltd., Hsing Wei Machine Industry Co. Ltd., HYPLAS Machinery Co. Ltd., J M Heaford Ltd., Jiangyin Huitong Packaging Machinery Co. Ltd., Jiangyin Lida Printing and Packaging Machinery, KKA Gmbh, Pelican Rotoflex Pvt. Ltd., QUEENS Machinery Co. Ltd., ROTATEK Printing Machinery SLU, Shaanxi Beiren Printing Machinery, Shibaura Machine Co. Ltd, Star Flex International, Uteco Converting Spa, Weijin Machinery Industry Co. Ltd., and Windmoller and Holscher KG |
Market dynamics | Parent market analysis, Market growth inducers and obstacles, Fast-growing and slow-growing segment analysis, COVID 19 impact and recovery analysis and future consumer dynamics, and Market condition analysis for the forecast period. |
Customization purview | If our report has not included the data that you are looking for, you can reach out to our analysts and get segments customized. |
Table of Content:
1 Executive Summary
- 1.1 Market overview
- Exhibit 01: Executive Summary – Chart on Market Overview
- Exhibit 02: Executive Summary – Data Table on Market Overview
- Exhibit 03: Executive Summary – Chart on Global Market Characteristics
- Exhibit 04: Executive Summary – Chart on Market by Geography
- Exhibit 05: Executive Summary – Chart on Market Segmentation by Type
- Exhibit 06: Executive Summary – Chart on Incremental Growth
- Exhibit 07: Executive Summary – Data Table on Incremental Growth
- Exhibit 08: Executive Summary – Chart on Vendor Market Positioning
2 Market Landscape
- 2.1 Market ecosystem
- Exhibit 09: Parent market
- Exhibit 10: Market Characteristics
3 Market Sizing
- 3.1 Market definition
- Exhibit 11: Offerings of vendors included in the market definition
- 3.2 Market segment analysis
- Exhibit 12: Market segments
- 3.3 Market size 2021
- 3.4 Market outlook: Forecast for 2021-2026
- Exhibit 13: Chart on Global - Market size and forecast 2021-2026 ($ million)
- Exhibit 14: Data Table on Global - Market size and forecast 2021-2026 ($ million)
- Exhibit 15: Chart on Global Market: Year-over-year growth 2021-2026 (%)
- Exhibit 16: Data Table on Global Market: Year-over-year growth 2021-2026 (%)
4 Five Forces Analysis
- 4.1 Five forces summary
- Exhibit 17: Five forces analysis - Comparison between 2021 and 2026
- 4.2 Bargaining power of buyers
- Exhibit 18: Chart on Bargaining power of buyers – Impact of key factors 2021 and 2026
- 4.3 Bargaining power of suppliers
- Exhibit 19: Bargaining power of suppliers – Impact of key factors in 2021 and 2026
- 4.4 Threat of new entrants
- Exhibit 20: Threat of new entrants – Impact of key factors in 2021 and 2026
- 4.5 Threat of substitutes
- Exhibit 21: Threat of substitutes – Impact of key factors in 2021 and 2026
- 4.6 Threat of rivalry
- Exhibit 22: Threat of rivalry – Impact of key factors in 2021 and 2026
- 4.7 Market condition
- Exhibit 23: Chart on Market condition - Five forces 2021 and 2026
5 Market Segmentation by Type
- 5.1 Market segments
- Exhibit 24: Chart on Type - Market share 2021-2026 (%)
- Exhibit 25: Data Table on Type - Market share 2021-2026 (%)
- 5.2 Comparison by Type
- Exhibit 26: Chart on Comparison by Type
- Exhibit 27: Data Table on Comparison by Type
- 5.3 Automatic rotogravure printing machine - Market size and forecast 2021-2026
- Exhibit 28: Chart on Automatic rotogravure printing machine - Market size and forecast 2021-2026 ($ million)
- Exhibit 29: Data Table on Automatic rotogravure printing machine - Market size and forecast 2021-2026 ($ million)
- Exhibit 30: Chart on Automatic rotogravure printing machine - Year-over-year growth 2021-2026 (%)
- Exhibit 31: Data Table on Automatic rotogravure printing machine - Year-over-year growth 2021-2026 (%)
- 5.4 Manual rotogravure printing machine - Market size and forecast 2021-2026
- Exhibit 32: Chart on Manual rotogravure printing machine - Market size and forecast 2021-2026 ($ million)
- Exhibit 33: Data Table on Manual rotogravure printing machine - Market size and forecast 2021-2026 ($ million)
- Exhibit 34: Chart on Manual rotogravure printing machine - Year-over-year growth 2021-2026 (%)
- Exhibit 35: Data Table on Manual rotogravure printing machine - Year-over-year growth 2021-2026 (%)
- 5.5 Market opportunity by Type
- Exhibit 36: Market opportunity by Type ($ million)
6 Customer Landscape
- 6.1 Customer landscape overview
- Exhibit 37: Analysis of price sensitivity, lifecycle, customer purchase basket, adoption rates, and purchase criteria
7 Geographic Landscape
- 7.1 Geographic segmentation
- Exhibit 38: Chart on Market share by geography 2021-2026 (%)
- Exhibit 39: Data Table on Market share by geography 2021-2026 (%)
- 7.2 Geographic comparison
- Exhibit 40: Chart on Geographic comparison
- Exhibit 41: Data Table on Geographic comparison
- 7.3 Europe - Market size and forecast 2021-2026
- Exhibit 42: Chart on Europe - Market size and forecast 2021-2026 ($ million)
- Exhibit 43: Data Table on Europe - Market size and forecast 2021-2026 ($ million)
- Exhibit 44: Chart on Europe - Year-over-year growth 2021-2026 (%)
- Exhibit 45: Data Table on Europe - Year-over-year growth 2021-2026 (%)
- 7.4 North America - Market size and forecast 2021-2026
- Exhibit 46: Chart on North America - Market size and forecast 2021-2026 ($ million)
- Exhibit 47: Data Table on North America - Market size and forecast 2021-2026 ($ million)
- Exhibit 48: Chart on North America - Year-over-year growth 2021-2026 (%)
- Exhibit 49: Data Table on North America - Year-over-year growth 2021-2026 (%)
- 7.5 APAC - Market size and forecast 2021-2026
- Exhibit 50: Chart on APAC - Market size and forecast 2021-2026 ($ million)
- Exhibit 51: Data Table on APAC - Market size and forecast 2021-2026 ($ million)
- Exhibit 52: Chart on APAC - Year-over-year growth 2021-2026 (%)
- Exhibit 53: Data Table on APAC - Year-over-year growth 2021-2026 (%)
- 7.6 Middle East and Africa - Market size and forecast 2021-2026
- Exhibit 54: Chart on Middle East and Africa - Market size and forecast 2021-2026 ($ million)
- Exhibit 55: Data Table on Middle East and Africa - Market size and forecast 2021-2026 ($ million)
- Exhibit 56: Chart on Middle East and Africa - Year-over-year growth 2021-2026 (%)
- Exhibit 57: Data Table on Middle East and Africa - Year-over-year growth 2021-2026 (%)
- 7.7 South America - Market size and forecast 2021-2026
- Exhibit 58: Chart on South America - Market size and forecast 2021-2026 ($ million)
- Exhibit 59: Data Table on South America - Market size and forecast 2021-2026 ($ million)
- Exhibit 60: Chart on South America - Year-over-year growth 2021-2026 (%)
- Exhibit 61: Data Table on South America - Year-over-year growth 2021-2026 (%)
- 7.8 US - Market size and forecast 2021-2026
- Exhibit 62: Chart on US - Market size and forecast 2021-2026 ($ million)
- Exhibit 63: Data Table on US - Market size and forecast 2021-2026 ($ million)
- Exhibit 64: Chart on US - Year-over-year growth 2021-2026 (%)
- Exhibit 65: Data Table on US - Year-over-year growth 2021-2026 (%)
- 7.9 China - Market size and forecast 2021-2026
- Exhibit 66: Chart on China - Market size and forecast 2021-2026 ($ million)
- Exhibit 67: Data Table on China - Market size and forecast 2021-2026 ($ million)
- Exhibit 68: Chart on China - Year-over-year growth 2021-2026 (%)
- Exhibit 69: Data Table on China - Year-over-year growth 2021-2026 (%)
- 7.10 Germany - Market size and forecast 2021-2026
- Exhibit 70: Chart on Germany - Market size and forecast 2021-2026 ($ million)
- Exhibit 71: Data Table on Germany - Market size and forecast 2021-2026 ($ million)
- Exhibit 72: Chart on Germany - Year-over-year growth 2021-2026 (%)
- Exhibit 73: Data Table on Germany - Year-over-year growth 2021-2026 (%)
- 7.11 UK - Market size and forecast 2021-2026
- Exhibit 74: Chart on UK - Market size and forecast 2021-2026 ($ million)
- Exhibit 75: Data Table on UK - Market size and forecast 2021-2026 ($ million)
- Exhibit 76: Chart on UK - Year-over-year growth 2021-2026 (%)
- Exhibit 77: Data Table on UK - Year-over-year growth 2021-2026 (%)
- 7.12 Japan - Market size and forecast 2021-2026
- Exhibit 78: Chart on Japan - Market size and forecast 2021-2026 ($ million)
- Exhibit 79: Data Table on Japan - Market size and forecast 2021-2026 ($ million)
- Exhibit 80: Chart on Japan - Year-over-year growth 2021-2026 (%)
- Exhibit 81: Data Table on Japan - Year-over-year growth 2021-2026 (%)
- 7.13 Market opportunity by geography
- Exhibit 82: Market opportunity by geography ($ million)
8 Drivers, Challenges, and Trends
- 8.1 Market drivers
- 8.2 Market challenges
- 8.3 Impact of drivers and challenges
- Exhibit 83: Impact of drivers and challenges in 2021 and 2026
- 8.4 Market trends
9 Vendor Landscape
- 9.1 Overview
- 9.2 Vendor landscape
- Exhibit 84: Overview on Criticality of inputs and Factors of differentiation
- 9.3 Landscape disruption
- Exhibit 85: Overview on factors of disruption
- 9.4 Industry risks
- Exhibit 86: Impact of key risks on business
10 Vendor Analysis
- 10.1 Vendors covered
- Exhibit 87: Vendors covered
- 10.2 Market positioning of vendors
- Exhibit 88: Matrix on vendor position and classification
- 10.3 Bobst Group SA
- Exhibit 89: Bobst Group SA - Overview
- Exhibit 90: Bobst Group SA - Business segments
- Exhibit 91: Bobst Group SA - Key news
- Exhibit 92: Bobst Group SA - Key offerings
- Exhibit 93: Bobst Group SA - Segment focus
- 10.4 Hsing Wei Machine Industry Co. Ltd.
- Exhibit 94: Hsing Wei Machine Industry Co. Ltd. - Overview
- Exhibit 95: Hsing Wei Machine Industry Co. Ltd. - Product / Service
- Exhibit 96: Hsing Wei Machine Industry Co. Ltd. - Key offerings
- 10.5 J M Heaford Ltd.
- Exhibit 97: J M Heaford Ltd. - Overview
- Exhibit 98: J M Heaford Ltd. - Product / Service
- Exhibit 99: J M Heaford Ltd. - Key offerings
- 10.6 KKA Gmbh
- Exhibit 100: KKA Gmbh - Overview
- Exhibit 101: KKA Gmbh - Product / Service
- Exhibit 102: KKA Gmbh - Key offerings
- 10.7 Pelican Rotoflex Pvt. Ltd.
- Exhibit 103: Pelican Rotoflex Pvt. Ltd. - Overview
- Exhibit 104: Pelican Rotoflex Pvt. Ltd. - Product / Service
- Exhibit 105: Pelican Rotoflex Pvt. Ltd. - Key offerings
- 10.8 QUEENS Machinery Co. Ltd.
- Exhibit 106: QUEENS Machinery Co. Ltd. - Overview
- Exhibit 107: QUEENS Machinery Co. Ltd. - Product / Service
- Exhibit 108: QUEENS Machinery Co. Ltd. - Key offerings
- 10.9 ROTATEK Printing Machinery SLU
- Exhibit 109: ROTATEK Printing Machinery SLU - Overview
- Exhibit 110: ROTATEK Printing Machinery SLU - Product / Service
- Exhibit 111: ROTATEK Printing Machinery SLU - Key offerings
- 10.10 Shaanxi Beiren Printing Machinery
- Exhibit 112: Shaanxi Beiren Printing Machinery - Overview
- Exhibit 113: Shaanxi Beiren Printing Machinery - Product / Service
- Exhibit 114: Shaanxi Beiren Printing Machinery - Key offerings
- 10.11 Uteco Converting Spa
- Exhibit 115: Uteco Converting Spa - Overview
- Exhibit 116: Uteco Converting Spa - Product / Service
- Exhibit 117: Uteco Converting Spa - Key offerings
- 10.12 Windmoller and Holscher KG
- Exhibit 118: Windmoller and Holscher KG - Overview
- Exhibit 119: Windmoller and Holscher KG - Product / Service
- Exhibit 120: Windmoller and Holscher KG - Key offerings
11 Appendix
- 11.1 Scope of the report
- 11.2 Inclusions and exclusions checklist
- Exhibit 121: Inclusions checklist
- Exhibit 122: Exclusions checklist
- 11.3 Currency conversion rates for US$
- Exhibit 123: Currency conversion rates for US$
- 11.4 Research methodology
- Exhibit 124: Research methodology
- Exhibit 125: Validation techniques employed for market sizing
- Exhibit 126: Information sources
- 11.5 List of abbreviations
- Exhibit 127: List of abbreviations
- in manufacturing industry: Market dynamics in some major processes and discrete industries are changing drastically, and manufacturers are gradually feeling the brunt of excessive demand fluctuations. The fluctuating prices of oil and gas and metals in the global market and the shortage of a skilled workforce worldwide have directly affected the profitability of manufacturing companies. A sudden and unexpected shift in market dynamics can drastically impact manufacturing processes and investments in capital goods.
- slowdown in the automotive industry: High motorization rates in North America and Europe, the increase in tariffs on imported vehicles in the US and China, and the global economic slowdown are likely to reduce vehicle sales in the coming years. Anticipating a decline in vehicle sales, several vehicle manufacturers are halting their vehicle production. For instance, in March 2019, Ford announced the shutdown of its three vehicle-manufacturing sites in Russia. Similarly, in August 2019, Mahindra and Mahindra Ltd. stopped vehicle production at its manufacturing units in India for 8-14 days. During the same month, Maruti Suzuki announced that it had cut its vehicle production for the sixth consecutive month in 2019. In August 2019, Honda announced a halt in car production at its Argentina-based manufacturing plants. Such a slowdown in the automotive industry is expected to hamper the growth of the market during the forecast period.
Technavio is a leading global technology research and advisory company. Their research and analysis focus on emerging market trends and provides actionable insights to help businesses identify market opportunities and develop effective strategies to optimize their market positions. With over 500 specialized analysts, Technavio's report library consists of more than 17,000 reports and counting, covering 800 technologies, spanning across 50 countries. Their client base consists of enterprises of all sizes, including more than 100 Fortune 500 companies. This growing client base relies on Technavio's comprehensive coverage, extensive research, and actionable market insights to identify opportunities in existing and potential markets and assess their competitive positions within changing market scenarios.
Contact Us:
Technavio Research
Jesse Maida
Media & Marketing Executive
US: +1 844 364 1100
UK: +44 203 893 3200
Email: media@technavio.com
Website: www.technavio.com/


SOURCE Technavio
© 2024 Benzinga.com. Benzinga does not provide investment advice. All rights reserved.
Trade confidently with insights and alerts from analyst ratings, free reports and breaking news that affects the stocks you care about.

