


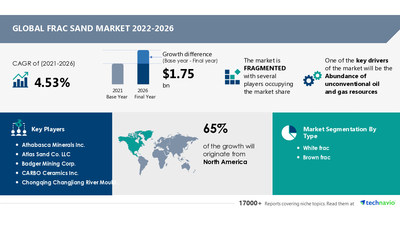
NEW YORK, Aug. 29, 2022 /PRNewswire/ -- The latest market analysis report titled Frac Sand Market by Type and Geography - Forecast and Analysis 2022-2026 has been added to Technavio's catalog. The report predicts the market to witness an accelerating growth momentum at a CAGR of 4.53%. Technavio categorizes the global frac sand market as a part of the global specialty chemicals market. Our report provides extensive information on the value chain analysis for the frac sand market, which vendors can leverage to gain a competitive advantage during the forecast period. The data available in our value chain analysis segment can help vendors drive costs and enhance customer services during the forecast period. The abundance of unconventional oil and gas resources is one of the key factors driving the frac sand market size growth. In addition, the growing petroleum refining is one of the key frac sand market trends supporting the market growth. However, the increasing dependency on renewable energy sources is one of the factors impeding the frac sand market size growth.

For more insights on the scope, market dynamics, and value chain analysis, Read a FREE Sample Report
- The frac sand market is fragmented and the vendors are deploying organic and inorganic growth strategies to compete in the market. This statistical study of the frac sand market encompasses successful business strategies deployed by the key vendors.
- To make the most of the opportunities and recover from the post-pandemic impact, market vendors should focus more on the growth prospects in the fast-growing segments, while maintaining their positions in the slow-growing segments.
- The frac sand market forecast report offers in-depth insights into key vendor profiles. The profiles include information on the production, sustainability, and prospects of the leading companies.
- Backed with competitive intelligence and benchmarking, our research reports on the Frac Sand Market are designed to provide entry support, customer profile, and M&As as well as go-to-market strategy support.
We provide a detailed analysis of around 25 vendors operating in the Frac Sand Market, including some of the vendors such as vendors:
- Athabasca Minerals Inc.
- Atlas Sand Co. LLC
- Badger Mining Corp.
- CARBO Ceramics Inc.
- Chongqing Changjiang River Moulding Material Group Co. Ltd.
- Covia Holdings LLC
- Diversity Technologies Corp.
- ECP Management LP
- Emerge Energy Services LP
- Hi Crush Inc.
- Permian Frac Sand LLC
- Preferred Proppants LLC
- Sibelco Group
- Sierra Frac Sand LLC
- SmartSand Inc.
- Source Energy Services Ltd.
- US Silica Holdings Inc.
- Victory Nickel Inc.
- Vista Proppants and Logistics
Access extensive vendor profiles with market-specific product offerings and strategic insights in this PDF Sample
- Revenue-generating Type Segment Analysis
- White Frac: The frac sand market share growth in the white frac segment will be significant during the forecast period. White frac sand is used to enhance the hydrocarbon recovery rates during the extraction of oil and natural gas through hydraulic fracturing. With major oil and natural gas extraction projects being carried out worldwide, the demand for white frac sand is increasing globally during the forecast period. Therefore, the growing demand for oil and natural gas globally, especially in North America, will drive the consumption of white frac sand during the forecast period.
- Brown Frac
- Regional Opportunities
- North America: 65% of the market's growth will originate from North America during the forecast period. The US and Canada are the key markets for the frac sand market in North America. Market growth in this region will be faster than the growth of the market in Europe. The large-scale adoption of hydraulic fracturing in the extraction of oil and gas from shale is garnering greater investments in unconventional production, which will propel the frac sand market growth in North America over the forecast period.
- Europe
- APAC
- Middle East And Africa
- South America
Grab your Report Sample PDF Copy for segment-wise Insights and Regional Contribution!
Technavio presents a detailed picture of the market by the way of study, synthesis, and summation of data from multiple sources. Our frac sand market report covers the following areas:
- CAGR of the market during the forecast period 2022-2026
- Detailed information on factors that will assist frac sand market growth during the next five years
- Estimation of the frac sand market size and its contribution to the parent market
- Predictions on upcoming trends and changes in consumer behavior
- The growth of the frac sand market
- Analysis of the market's competitive landscape and detailed information on vendors
- Comprehensive details of factors that will challenge the growth of frac sand market vendors
Proppants Market in North America by Type and Geography - Forecast and Analysis 2022-2026
Geofoams Market by Material and Geography - Forecast and Analysis 2022-2026
Frac Sand Market Scope | |
Report Coverage | Details |
Page number | 120 |
Base year | 2021 |
Forecast period | 2022-2026 |
Growth momentum & CAGR | Accelerate at a CAGR of 4.53% |
Market growth 2022-2026 | $ 1.75 billion |
Market structure | Fragmented |
YoY growth (%) | 4.05 |
Regional analysis | North America, Europe, APAC, Middle East and Africa, and South America |
Performing market contribution | North America at 65% |
Key consumer countries | US, Canada, Mexico, United Arab Emirates, China, and Australia |
Competitive landscape | Leading companies, competitive strategies, consumer engagement scope |
Companies profiled | Athabasca Minerals Inc., Atlas Sand Co. LLC, Badger Mining Corp., CARBO Ceramics Inc., Chongqing Changjiang River Moulding Material Group Co. Ltd., Covia Holdings LLC, Diversity Technologies Corp., ECP Management LP, Emerge Energy Services LP, Hi Crush Inc., Permian Frac Sand LLC, Preferred Proppants LLC, Sibelco Group, Sierra Frac Sand LLC, SmartSand Inc., Source Energy Services Ltd., US Silica Holdings Inc., Victory Nickel Inc., and Vista Proppants and Logistics |
Market Dynamics | Parent market analysis, Market growth inducers and obstacles, Fast-growing and slow-growing segment analysis, COVID 19 impact and future consumer dynamics, and market condition analysis for the forecast period. |
Customization purview | If our report has not included the data that you are looking for, you can reach out to our analysts and get segments customized. |
1 Executive Summary
- 1.1 Market overview
- Exhibit 01: Executive Summary – Chart on Market Overview
- Exhibit 02: Executive Summary – Data Table on Market Overview
- Exhibit 03: Executive Summary – Chart on Global Market Characteristics
- Exhibit 04: Executive Summary – Chart on Market by Geography
- Exhibit 05: Executive Summary – Chart on Market Segmentation by Type
- Exhibit 06: Executive Summary – Chart on Incremental Growth
- Exhibit 07: Executive Summary – Data Table on Incremental Growth
- Exhibit 08: Executive Summary – Chart on Vendor Market Positioning
2 Market Landscape
- 2.1 Market ecosystem
- Exhibit 09: Parent market
- Exhibit 10: Market Characteristics
3 Market Sizing
- 3.1 Market definition
- Exhibit 11: Offerings of vendors included in the market definition
- 3.2 Market segment analysis
- Exhibit 12: Market segments
- 3.3 Market size 2021
- 3.4 Market outlook: Forecast for 2021-2026
- Exhibit 13: Chart on Global - Market size and forecast 2021-2026 ($ million)
- Exhibit 14: Data Table on Global - Market size and forecast 2021-2026 ($ million)
- Exhibit 15: Chart on Global Market: Year-over-year growth 2021-2026 (%)
- Exhibit 16: Data Table on Global Market: Year-over-year growth 2021-2026 (%)
4 Five Forces Analysis
- 4.1 Five forces summary
- Exhibit 17: Five forces analysis - Comparison between 2021 and 2026
- 4.2 Bargaining power of buyers
- Exhibit 18: Chart on Bargaining power of buyers – Impact of key factors 2021 and 2026
- 4.3 Bargaining power of suppliers
- Exhibit 19: Bargaining power of suppliers – Impact of key factors in 2021 and 2026
- 4.4 Threat of new entrants
- Exhibit 20: Threat of new entrants – Impact of key factors in 2021 and 2026
- 4.5 Threat of substitutes
- Exhibit 21: Threat of substitutes – Impact of key factors in 2021 and 2026
- 4.6 Threat of rivalry
- Exhibit 22: Threat of rivalry – Impact of key factors in 2021 and 2026
- 4.7 Market condition
- Exhibit 23: Chart on Market condition - Five forces 2021 and 2026
5 Market Segmentation by Type
- 5.1 Market segments
- Exhibit 24: Chart on Type - Market share 2021-2026 (%)
- Exhibit 25: Data Table on Type - Market share 2021-2026 (%)
- 5.2 Comparison by Type
- Exhibit 26: Chart on Comparison by Type
- Exhibit 27: Data Table on Comparison by Type
- 5.3 White frac - Market size and forecast 2021-2026
- Exhibit 28: Chart on White frac - Market size and forecast 2021-2026 ($ million)
- Exhibit 29: Data Table on White frac - Market size and forecast 2021-2026 ($ million)
- Exhibit 30: Chart on White frac - Year-over-year growth 2021-2026 (%)
- Exhibit 31: Data Table on White frac - Year-over-year growth 2021-2026 (%)
- 5.4 Brown frac - Market size and forecast 2021-2026
- Exhibit 32: Chart on Brown frac - Market size and forecast 2021-2026 ($ million)
- Exhibit 33: Data Table on Brown frac - Market size and forecast 2021-2026 ($ million)
- Exhibit 34: Chart on Brown frac - Year-over-year growth 2021-2026 (%)
- Exhibit 35: Data Table on Brown frac - Year-over-year growth 2021-2026 (%)
- 5.5 Market opportunity by Type
- Exhibit 36: Market opportunity by Type ($ million)
6 Customer Landscape
- 6.1 Customer landscape overview
- Exhibit 37: Analysis of price sensitivity, lifecycle, customer purchase basket, adoption rates, and purchase criteria
7 Geographic Landscape
- 7.1 Geographic segmentation
- Exhibit 38: Chart on Market share by geography 2021-2026 (%)
- Exhibit 39: Data Table on Market share by geography 2021-2026 (%)
- 7.2 Geographic comparison
- Exhibit 40: Chart on Geographic comparison
- Exhibit 41: Data Table on Geographic comparison
- 7.3 North America - Market size and forecast 2021-2026
- Exhibit 42: Chart on North America - Market size and forecast 2021-2026 ($ million)
- Exhibit 43: Data Table on North America - Market size and forecast 2021-2026 ($ million)
- Exhibit 44: Chart on North America - Year-over-year growth 2021-2026 (%)
- Exhibit 45: Data Table on North America - Year-over-year growth 2021-2026 (%)
- 7.4 Europe - Market size and forecast 2021-2026
- Exhibit 46: Chart on Europe - Market size and forecast 2021-2026 ($ million)
- Exhibit 47: Data Table on Europe - Market size and forecast 2021-2026 ($ million)
- Exhibit 48: Chart on Europe - Year-over-year growth 2021-2026 (%)
- Exhibit 49: Data Table on Europe - Year-over-year growth 2021-2026 (%)
- 7.5 APAC - Market size and forecast 2021-2026
- Exhibit 50: Chart on APAC - Market size and forecast 2021-2026 ($ million)
- Exhibit 51: Data Table on APAC - Market size and forecast 2021-2026 ($ million)
- Exhibit 52: Chart on APAC - Year-over-year growth 2021-2026 (%)
- Exhibit 53: Data Table on APAC - Year-over-year growth 2021-2026 (%)
- 7.6 Middle East and Africa - Market size and forecast 2021-2026
- Exhibit 54: Chart on Middle East and Africa - Market size and forecast 2021-2026 ($ million)
- Exhibit 55: Data Table on Middle East and Africa - Market size and forecast 2021-2026 ($ million)
- Exhibit 56: Chart on Middle East and Africa - Year-over-year growth 2021-2026 (%)
- Exhibit 57: Data Table on Middle East and Africa - Year-over-year growth 2021-2026 (%)
- 7.7 South America - Market size and forecast 2021-2026
- Exhibit 58: Chart on South America - Market size and forecast 2021-2026 ($ million)
- Exhibit 59: Data Table on South America - Market size and forecast 2021-2026 ($ million)
- Exhibit 60: Chart on South America - Year-over-year growth 2021-2026 (%)
- Exhibit 61: Data Table on South America - Year-over-year growth 2021-2026 (%)
- 7.8 US - Market size and forecast 2021-2026
- Exhibit 62: Chart on US - Market size and forecast 2021-2026 ($ million)
- Exhibit 63: Data Table on US - Market size and forecast 2021-2026 ($ million)
- Exhibit 64: Chart on US - Year-over-year growth 2021-2026 (%)
- Exhibit 65: Data Table on US - Year-over-year growth 2021-2026 (%)
- 7.9 Canada - Market size and forecast 2021-2026
- Exhibit 66: Chart on Canada - Market size and forecast 2021-2026 ($ million)
- Exhibit 67: Data Table on Canada - Market size and forecast 2021-2026 ($ million)
- Exhibit 68: Chart on Canada - Year-over-year growth 2021-2026 (%)
- Exhibit 69: Data Table on Canada - Year-over-year growth 2021-2026 (%)
- 7.10 Mexico - Market size and forecast 2021-2026
- Exhibit 70: Chart on Mexico - Market size and forecast 2021-2026 ($ million)
- Exhibit 71: Data Table on Mexico - Market size and forecast 2021-2026 ($ million)
- Exhibit 72: Chart on Mexico - Year-over-year growth 2021-2026 (%)
- Exhibit 73: Data Table on Mexico - Year-over-year growth 2021-2026 (%)
- 7.11 Market opportunity by geography
- Exhibit 74: Market opportunity by geography ($ million)
8 Drivers, Challenges, and Trends
- 8.1 Market drivers
- 8.2 Market challenges
- 8.3 Impact of drivers and challenges
- Exhibit 75: Impact of drivers and challenges in 2021 and 2026
- 8.4 Market trends
9 Vendor Landscape
- 9.1 Overview
- 9.2 Vendor landscape
- Exhibit 76: Overview on Criticality of inputs and Factors of differentiation
- 9.3 Landscape disruption
- Exhibit 77: Overview on factors of disruption
- 9.4 Industry risks
- Exhibit 78: Impact of key risks on business
10 Vendor Analysis
- 10.1 Vendors covered
- Exhibit 79: Vendors covered
- 10.2 Market positioning of vendors
- Exhibit 80: Matrix on vendor position and classification
- 10.3 Badger Mining Corp.
- Exhibit 81: Badger Mining Corp. - Overview
- Exhibit 82: Badger Mining Corp. - Product / Service
- Exhibit 83: Badger Mining Corp. - Key offerings
- 10.4 CARBO Ceramics Inc.
- Exhibit 84: CARBO Ceramics Inc. - Overview
- Exhibit 85: CARBO Ceramics Inc. - Business segments
- Exhibit 86: CARBO Ceramics Inc. - Key offerings
- Exhibit 87: CARBO Ceramics Inc. - Segment focus
- 10.5 Covia Holdings LLC
- Exhibit 88: Covia Holdings LLC - Overview
- Exhibit 89: Covia Holdings LLC - Product / Service
- Exhibit 90: Covia Holdings LLC - Key offerings
- 10.6 Emerge Energy Services LP
- Exhibit 91: Emerge Energy Services LP - Overview
- Exhibit 92: Emerge Energy Services LP - Product / Service
- Exhibit 93: Emerge Energy Services LP - Key offerings
- 10.7 Hi Crush Inc.
- Exhibit 94: Hi Crush Inc. - Overview
- Exhibit 95: Hi Crush Inc. - Product / Service
- Exhibit 96: Hi Crush Inc. - Key offerings
- 10.8 Sibelco Group
- Exhibit 97: Sibelco Group - Overview
- Exhibit 98: Sibelco Group - Product / Service
- Exhibit 99: Sibelco Group - Key offerings
- 10.9 Sierra Frac Sand LLC
- Exhibit 100: Sierra Frac Sand LLC - Overview
- Exhibit 101: Sierra Frac Sand LLC - Product / Service
- Exhibit 102: Sierra Frac Sand LLC - Key offerings
- 10.10 SmartSand Inc.
- Exhibit 103: SmartSand Inc. - Overview
- Exhibit 104: SmartSand Inc. - Product / Service
- Exhibit 105: SmartSand Inc. - Key offerings
- 10.11 Source Energy Services Ltd.
- Exhibit 106: Source Energy Services Ltd. - Overview
- Exhibit 107: Source Energy Services Ltd. - Product / Service
- Exhibit 108: Source Energy Services Ltd. - Key offerings
- 10.12 US Silica Holdings Inc.
- Exhibit 109: US Silica Holdings Inc. - Overview
- Exhibit 110: US Silica Holdings Inc. - Business segments
- Exhibit 111: US Silica Holdings Inc. - Key offerings
- Exhibit 112: US Silica Holdings Inc. - Segment focus
11 Appendix
- 11.1 Scope of the report
- 11.2 Inclusions and exclusions checklist
- Exhibit 113: Inclusions checklist
- Exhibit 114: Exclusions checklist
- 11.3 Currency conversion rates for US$
- Exhibit 115: Currency conversion rates for US$
- 11.4 Research methodology
- Exhibit 116: Research methodology
- Exhibit 117: Validation techniques employed for market sizing
- Exhibit 118: Information sources
- 11.5 List of abbreviations
- Exhibit 119: List of abbreviations
Technavio is a leading global technology research and advisory company. Their research and analysis focus on emerging market trends and provide actionable insights to help businesses identify market opportunities and develop effective strategies to optimize their market positions. With over 500 specialized analysts, Technavio's report library consists of more than 17,000 reports and counting, covering 800 technologies, spanning 50 countries. Their client base consists of enterprises of all sizes, including more than 100 Fortune 500 companies. This growing client base relies on Technavio's comprehensive coverage, extensive research, and actionable market insights to identify opportunities in existing and potential markets and assess their competitive positions within changing market scenarios.
Contact
Technavio Research
Jesse Maida
Media & Marketing Executive
US: +1 844 364 1100
UK: +44 203 893 3200
Email: media@technavio.com
Website: www.technavio.com/


SOURCE Technavio
© 2024 Benzinga.com. Benzinga does not provide investment advice. All rights reserved.
Trade confidently with insights and alerts from analyst ratings, free reports and breaking news that affects the stocks you care about.

