


NEW YORK, Aug. 25, 2022 /PRNewswire/ -- Property management software helps property managers and real estate agents in managing their property-related operations such as rent collection, reminders for rent payments, vacancy updates, property advertisement and marketing, lease and contract documentation, application tracking, accounting, property maintenance, and workload creation and tracking.

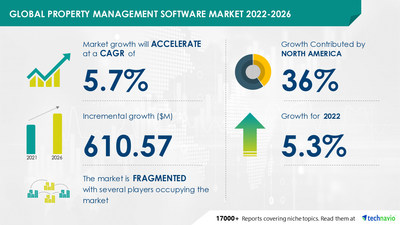
Technavio estimates that the property management software market size is expected to grow by USD 610.57 million from 2021 to 2026. The growth momentum of the market will accelerate at a CAGR of 5.7% during the forecast period.
Get a comprehensive report summary describing the market size and forecast along with research methodology. The FREE sample report is available in PDF format
Porter's Five Forces Analysis
- Threat of New Entrants
The global property management software market is characterized by moderate capital investment. This leads to several opportunities for new entrants to enter the market and capitalize on the increasing demand for property management software. However, the established players have a strong geographical presence and a loyal customer base. Therefore, it can become difficult for new entrants to enter the market and gain market share. Thus, the threat of new entrants was moderate in 2021 and is expected to remain the same during the forecast period.
The Report offers information on all Porter's Five Forces. Buy Now to gain insights that will help you improve your business.
Vendor Landscape
The property management software market is fragmented, and the vendors are deploying growth strategies such as product innovation to compete in the market. The market includes some international players and several US-based industry participants. Large vendors are acquiring small vendors to expand their product portfolios and boost their market shares. The competitive market environment is expected to intensify with an increase in cloud-based solution extensions, technological innovations, and M&A. To remain competitive in the market, vendors have to develop new technologies. Some of the key vendors operating in the market include AppFolio Inc., Console Australia Pty Ltd., CoreLogic Inc., Entrata Inc., and Fortive Corp.
The report provides a full list of key vendors, their strategies, and the latest developments. Request a FREE PDF Sample Now
Market Segmentation
The property management software market has been segmented by deployment into cloud-based and on-premises. Among these, the cloud-based segment will account for the highest market growth. Many SMEs and large organizations are shifting to cloud-based property management solutions owing to their advantages such as inherent ease of use, cost-effectiveness, agility, and innovations in cloud security.
By geography, the market has been segmented into North America, Europe, APAC, South America, and the Middle East and Africa. North America will have the highest market growth during the forecast period. The growth of this region is attributed to factors such as increasing investment in smart city infrastructure, growing investment in the retail sector, and rising urbanization rate.
Learn about the contribution of each segment summarized in concise infographics and thorough descriptions. View a FREE PDF Sample Report
Key Drivers and Trends
The increasing awareness of property management software and its benefits will drive the growth of the global property management software market during the forecast period. Property management software simplifies data management by adding the master data and then updating the same. Any complaints can be resolved quickly, with a fast and seamless assigning of workload to avoid delays. Property management software helps in documenting lease management by default. It can create rent reminders, provide payment updates, offer online payment options, and track responses to display advertisements.
The use of AI, ML, voice commands, and VR is a trend in the market. Voice technology can make searches easier, and bills can be paid through voice commands. VR enables property managers to provide prospective tenants with a tour of the house. Similarly, 3D imaging and 360-degree imaging services provide visualization of properties for sale. Thus, the rise in the integration of new technologies with property management software will support the market growth during the forecast period.
Many other trends are also shaping the future of the market. View a FREE PDF Sample Report to learn about these trends
Similar Reports
Real Estate Software Market by Deployment, and Geography - Forecast and Analysis 2022-2026
Consumer Virtual Reality Market by Component and Geography - Forecast and Analysis 2022-2026
Property Management Software Market Scope | |
Report Coverage | Details |
Page number | 120 |
Base year | 2021 |
Forecast period | 2022-2026 |
Growth momentum & CAGR | Accelerate at a CAGR of 5.7% |
Market growth 2022-2026 | USD 610.57 million |
Market structure | Fragmented |
YoY growth (%) | 5.3 |
Regional analysis | North America, Europe, APAC, South America, and Middle East and Africa |
Performing market contribution | North America at 36% |
Key consumer countries | US, Canada, China, UK, and Germany |
Competitive landscape | Leading companies, Competitive strategies, Consumer engagement scope |
Key companies profiled | AppFolio Inc., Console Australia Pty Ltd., CoreLogic Inc., Entrata Inc., Fortive Corp., Hemlane Inc., London Computer Systems, MRI Software LLC, Nemetschek SE, Oracle Corp., Property Boulevard Inc., Property Matrix, Property Vista Software Inc., Quicken Inc., RealPage Inc., Rentec Direct, ResMan LLC, TenantCloud LLC, TOPS Software LLC, and Yardi Systems Inc. |
Market dynamics | Parent market analysis, market growth inducers and obstacles, fast-growing and slow-growing segment analysis, COVID-19 impact and recovery analysis and future consumer dynamics, and market condition analysis for the forecast period. |
Customization purview | If our report has not included the data that you are looking for, you can reach out to our analysts and get segments customized. |
Browse Information Technology Market Reports
Table of Contents
1 Executive Summary
- 1.1 Market overview
- Exhibit 01: Executive Summary – Chart on Market Overview
- Exhibit 02: Executive Summary – Data Table on Market Overview
- Exhibit 03: Executive Summary – Chart on Global Market Characteristics
- Exhibit 04: Executive Summary – Chart on Market by Geography
- Exhibit 05: Executive Summary – Chart on Market Segmentation by Deployment
- Exhibit 06: Executive Summary – Chart on Incremental Growth
- Exhibit 07: Executive Summary – Data Table on Incremental Growth
- Exhibit 08: Executive Summary – Chart on Vendor Market Positioning
2 Market Landscape
- 2.1 Market ecosystem
- Exhibit 09: Parent market
- Exhibit 10: Market Characteristics
3 Market Sizing
- 3.1 Market definition
- Exhibit 11: Offerings of vendors included in the market definition
- 3.2 Market segment analysis
- Exhibit 12: Market segments
- 3.3 Market size 2021
- 3.4 Market outlook: Forecast for 2021-2026
- Exhibit 13: Chart on Global - Market size and forecast 2021-2026 ($ million)
- Exhibit 14: Data Table on Global - Market size and forecast 2021-2026 ($ million)
- Exhibit 15: Chart on Global Market: Year-over-year growth 2021-2026 (%)
- Exhibit 16: Data Table on Global Market: Year-over-year growth 2021-2026 (%)
4 Five Forces Analysis
- 4.1 Five forces summary
- Exhibit 17: Five forces analysis - Comparison between 2021 and 2026
- 4.2 Bargaining power of buyers
- Exhibit 18: Chart on Bargaining power of buyers – Impact of key factors 2021 and 2026
- 4.3 Bargaining power of suppliers
- Exhibit 19: Bargaining power of suppliers – Impact of key factors in 2021 and 2026
- 4.4 Threat of new entrants
- Exhibit 20: Threat of new entrants – Impact of key factors in 2021 and 2026
- 4.5 Threat of substitutes
- Exhibit 21: Threat of substitutes – Impact of key factors in 2021 and 2026
- 4.6 Threat of rivalry
- Exhibit 22: Threat of rivalry – Impact of key factors in 2021 and 2026
- 4.7 Market condition
- Exhibit 23: Chart on Market condition - Five forces 2021 and 2026
5 Market Segmentation by Deployment
- 5.1 Market segments
- Exhibit 24: Chart on Deployment - Market share 2021-2026 (%)
- Exhibit 25: Data Table on Deployment - Market share 2021-2026 (%)
- 5.2 Comparison by Deployment
- Exhibit 26: Chart on Comparison by Deployment
- Exhibit 27: Data Table on Comparison by Deployment
- 5.3 Cloud-based - Market size and forecast 2021-2026
- Exhibit 28: Chart on Cloud-based - Market size and forecast 2021-2026 ($ million)
- Exhibit 29: Data Table on Cloud-based - Market size and forecast 2021-2026 ($ million)
- Exhibit 30: Chart on Cloud-based - Year-over-year growth 2021-2026 (%)
- Exhibit 31: Data Table on Cloud-based - Year-over-year growth 2021-2026 (%)
- 5.4 On-premises - Market size and forecast 2021-2026
- Exhibit 32: Chart on On-premises - Market size and forecast 2021-2026 ($ million)
- Exhibit 33: Data Table on On-premises - Market size and forecast 2021-2026 ($ million)
- Exhibit 34: Chart on On-premises - Year-over-year growth 2021-2026 (%)
- Exhibit 35: Data Table on On-premises - Year-over-year growth 2021-2026 (%)
- 5.5 Market opportunity by Deployment
- Exhibit 36: Market opportunity by Deployment ($ million)
6 Customer Landscape
- 6.1 Customer landscape overview
- Exhibit 37: Analysis of price sensitivity, lifecycle, customer purchase basket, adoption rates, and purchase criteria
7 Geographic Landscape
- 7.1 Geographic segmentation
- Exhibit 38: Chart on Market share by geography 2021-2026 (%)
- Exhibit 39: Data Table on Market share by geography 2021-2026 (%)
- 7.2 Geographic comparison
- Exhibit 40: Chart on Geographic comparison
- Exhibit 41: Data Table on Geographic comparison
- 7.3 North America - Market size and forecast 2021-2026
- Exhibit 42: Chart on North America - Market size and forecast 2021-2026 ($ million)
- Exhibit 43: Data Table on North America - Market size and forecast 2021-2026 ($ million)
- Exhibit 44: Chart on North America - Year-over-year growth 2021-2026 (%)
- Exhibit 45: Data Table on North America - Year-over-year growth 2021-2026 (%)
- 7.4 Europe - Market size and forecast 2021-2026
- Exhibit 46: Chart on Europe - Market size and forecast 2021-2026 ($ million)
- Exhibit 47: Data Table on Europe - Market size and forecast 2021-2026 ($ million)
- Exhibit 48: Chart on Europe - Year-over-year growth 2021-2026 (%)
- Exhibit 49: Data Table on Europe - Year-over-year growth 2021-2026 (%)
- 7.5 APAC - Market size and forecast 2021-2026
- Exhibit 50: Chart on APAC - Market size and forecast 2021-2026 ($ million)
- Exhibit 51: Data Table on APAC - Market size and forecast 2021-2026 ($ million)
- Exhibit 52: Chart on APAC - Year-over-year growth 2021-2026 (%)
- Exhibit 53: Data Table on APAC - Year-over-year growth 2021-2026 (%)
- 7.6 South America - Market size and forecast 2021-2026
- Exhibit 54: Chart on South America - Market size and forecast 2021-2026 ($ million)
- Exhibit 55: Data Table on South America - Market size and forecast 2021-2026 ($ million)
- Exhibit 56: Chart on South America - Year-over-year growth 2021-2026 (%)
- Exhibit 57: Data Table on South America - Year-over-year growth 2021-2026 (%)
- 7.7 Middle East and Africa - Market size and forecast 2021-2026
- Exhibit 58: Chart on Middle East and Africa - Market size and forecast 2021-2026 ($ million)
- Exhibit 59: Data Table on Middle East and Africa - Market size and forecast 2021-2026 ($ million)
- Exhibit 60: Chart on Middle East and Africa - Year-over-year growth 2021-2026 (%)
- Exhibit 61: Data Table on Middle East and Africa - Year-over-year growth 2021-2026 (%)
- 7.8 US - Market size and forecast 2021-2026
- Exhibit 62: Chart on US - Market size and forecast 2021-2026 ($ million)
- Exhibit 63: Data Table on US - Market size and forecast 2021-2026 ($ million)
- Exhibit 64: Chart on US - Year-over-year growth 2021-2026 (%)
- Exhibit 65: Data Table on US - Year-over-year growth 2021-2026 (%)
- 7.9 China - Market size and forecast 2021-2026
- Exhibit 66: Chart on China - Market size and forecast 2021-2026 ($ million)
- Exhibit 67: Data Table on China - Market size and forecast 2021-2026 ($ million)
- Exhibit 68: Chart on China - Year-over-year growth 2021-2026 (%)
- Exhibit 69: Data Table on China - Year-over-year growth 2021-2026 (%)
- 7.10 UK - Market size and forecast 2021-2026
- Exhibit 70: Chart on UK - Market size and forecast 2021-2026 ($ million)
- Exhibit 71: Data Table on UK - Market size and forecast 2021-2026 ($ million)
- Exhibit 72: Chart on UK - Year-over-year growth 2021-2026 (%)
- Exhibit 73: Data Table on UK - Year-over-year growth 2021-2026 (%)
- 7.11 Germany - Market size and forecast 2021-2026
- Exhibit 74: Chart on Germany - Market size and forecast 2021-2026 ($ million)
- Exhibit 75: Data Table on Germany - Market size and forecast 2021-2026 ($ million)
- Exhibit 76: Chart on Germany - Year-over-year growth 2021-2026 (%)
- Exhibit 77: Data Table on Germany - Year-over-year growth 2021-2026 (%)
- 7.12 Canada - Market size and forecast 2021-2026
- Exhibit 78: Chart on Canada - Market size and forecast 2021-2026 ($ million)
- Exhibit 79: Data Table on Canada - Market size and forecast 2021-2026 ($ million)
- Exhibit 80: Chart on Canada - Year-over-year growth 2021-2026 (%)
- Exhibit 81: Data Table on Canada - Year-over-year growth 2021-2026 (%)
- 7.13 Market opportunity by geography
- Exhibit 82: Market opportunity by geography ($ million)
8 Drivers, Challenges, and Trends
- 8.1 Market drivers
- 8.2 Market challenges
- 8.3 Impact of drivers and challenges
- Exhibit 83: Impact of drivers and challenges in 2021 and 2026
- 8.4 Market trends
9 Vendor Landscape
- 9.1 Overview
- 9.2 Vendor landscape
- Exhibit 84: Overview on Criticality of inputs and Factors of differentiation
- 9.3 Landscape disruption
- Exhibit 85: Overview on factors of disruption
- 9.4 Industry risks
- Exhibit 86: Impact of key risks on business
10 Vendor Analysis
- 10.1 Vendors covered
- Exhibit 87: Vendors covered
- 10.2 Market positioning of vendors
- Exhibit 88: Matrix on vendor position and classification
- 10.3 AppFolio Inc.
- Exhibit 89: AppFolio Inc. - Overview
- Exhibit 90: AppFolio Inc. - Product / Service
- Exhibit 91: AppFolio Inc. - Key offerings
- 10.4 Console Australia Pty Ltd.
- Exhibit 92: Console Australia Pty Ltd. - Overview
- Exhibit 93: Console Australia Pty Ltd. - Product / Service
- Exhibit 94: Console Australia Pty Ltd. - Key offerings
- 10.5 Entrata Inc.
- Exhibit 95: Entrata Inc. - Overview
- Exhibit 96: Entrata Inc. - Product / Service
- Exhibit 97: Entrata Inc. - Key offerings
- 10.6 London Computer Systems
- Exhibit 98: London Computer Systems - Overview
- Exhibit 99: London Computer Systems - Product / Service
- Exhibit 100: London Computer Systems - Key offerings
- 10.7 MRI Software LLC
- Exhibit 101: MRI Software LLC - Overview
- Exhibit 102: MRI Software LLC - Product / Service
- Exhibit 103: MRI Software LLC - Key offerings
- 10.8 Quicken Inc.
- Exhibit 104: Quicken Inc. - Overview
- Exhibit 105: Quicken Inc. - Product / Service
- Exhibit 106: Quicken Inc. - Key offerings
- 10.9 RealPage Inc.
- Exhibit 107: RealPage Inc. - Overview
- Exhibit 108: RealPage Inc. - Product / Service
- Exhibit 109: RealPage Inc. - Key offerings
- 10.10 Rentec Direct
- Exhibit 110: Rentec Direct - Overview
- Exhibit 111: Rentec Direct - Product / Service
- Exhibit 112: Rentec Direct - Key offerings
- 10.11 ResMan LLC
- Exhibit 113: ResMan LLC - Overview
- Exhibit 114: ResMan LLC - Product / Service
- Exhibit 115: ResMan LLC - Key offerings
- 10.12 Yardi Systems Inc.
- Exhibit 116: Yardi Systems Inc. - Overview
- Exhibit 117: Yardi Systems Inc. - Product / Service
- Exhibit 118: Yardi Systems Inc. - Key offerings
11 Appendix
- 11.1 Scope of the report
- 11.2 Inclusions and exclusions checklist
- Exhibit 119: Inclusions checklist
- Exhibit 120: Exclusions checklist
- 11.3 Currency conversion rates for US$
- Exhibit 121: Currency conversion rates for US$
- 11.4 Research methodology
- Exhibit 122: Research methodology
- Exhibit 123: Validation techniques employed for market sizing
- Exhibit 124: Information sources
- 11.5 List of abbreviations
- Exhibit 125: List of abbreviations
Technavio is a leading global technology research and advisory company. Their research and analysis focus on emerging market trends and provide actionable insights to help businesses identify market opportunities and develop effective strategies to optimize their market positions. With over 500 specialized analysts, Technavio's report library consists of more than 17,000 reports and counting, covering 800 technologies, spanning across 50 countries. Their client base consists of enterprises of all sizes, including more than 100 Fortune 500 companies. This growing client base relies on Technavio's comprehensive coverage, extensive research, and actionable market insights to identify opportunities in existing and potential markets and assess their competitive positions within changing market scenarios.
Contact
Technavio Research
Jesse Maida
Media & Marketing Executive
US: +1 844 364 1100
UK: +44 203 893 3200
Email: media@technavio.com
Website: www.technavio.com/


SOURCE Technavio
© 2024 Benzinga.com. Benzinga does not provide investment advice. All rights reserved.
Trade confidently with insights and alerts from analyst ratings, free reports and breaking news that affects the stocks you care about.

