


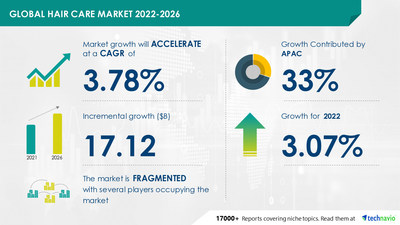
NEW YORK, Aug. 8, 2022 /PRNewswire/ -- The hair care market size is expected to grow by USD 17.12 billion, progressing at a CAGR of 3.78% from 2021 to 2026 as per the latest market report by Technavio. The growing adoption of home salon services is a hair care market trend that is expected to have a positive impact in the coming years. Personalized home salon service is an emerging trend in regions such as North America, Europe, and APAC. Over the last decade, the number of app-based salon service providers that offer at-home grooming services has grown significantly. Mobile apps enable consumers to order salon services and meet makeup artists at the given address. The home salon services have witnessed an expansion and high demand due to their low service charges and convenience of makeup and grooming services at home. Therefore, such personalized home salon services are expected to propel the growth of the market in focus, on terms of consumption.

To know about other market trends - Grab a FREE Sample Report in MINUTES
Hair Care Market Report: Market Dynamics
- Drivers - The innovation and portfolio extension leading to product premiumization, influence through social media and blogging & increase in demand for male grooming products are the major factors propelling the market growth.
- Challenges - The factors such as adverse health effects of chemical or synthetic components used in hair care products, growing penetration of DIY hair care solutions & competition from local and unorganized players will hamper the market growth.
- To know more about the market dynamics - Click Now!
Hair Care Market Report: Segmentation Analysis
The hair care market report is segmented by product (shampoo, hair color, conditioner, and others), distribution channel (offline and online), and geography (Europe, APAC, North America, South America, and Middle East and Africa)
Product Landscape
- The hair care market share growth in the shampoo segment will be significant for revenue generation.
- This market has attained maturity in developed countries such as the US, Japan, the UK, and Germany. However, Brazil, China, and India are the three major target markets for shampoo marketers
- The use of shampoo has been growing in the market, owing to the launch of innovative products that cater specifically to the requirements of customers in the region.
Geography Landscape
- 33% of the market's growth will originate from APAC during the forecast period.
- China and Japan are the key markets for hair care in APAC. Market growth in this region will be faster than the growth of the market in the European and North American regions.
- The rising disposable income and household final consumption expenditure per capita among the consumers will facilitate the hair care market growth in APAC over the forecast period.
To know more about the contribution of each segment along with the distribution channel landscape - Request a FREE Sample Now!
Hair Care Market Report: Vendor Analysis
The hair care market is fragmented and the vendors are deploying growth strategies such as continuous R&D to compete in the market.
- American Crew
- Amway Corp.
- CavinKare Pvt. Ltd.
- Chatters Ltd. Partnership
- Colgate-Palmolive Co.
- Coty Inc.
- Emami Ltd.
- Godrej and Boyce Manufacturing Co. Ltd.
- Hanz de Fuko LLC
- Henkel AG and Co.KGaA
- Hindustan Unilever Ltd.
- Jack Black L.L.C.
- John Paul Mitchell Systems
- Johnson and Johnson
- Kao Corp.
- LOreal SA
- NATULIQUE Ltd.
- Natura and CO Holding S.A.
- Shiseido Co. Ltd
- The Procter and Gamble Co.
- Truefitt and Hill
- Aveda Corp
- To know about the vendor offerings - Grab an Exclusive FREE Sample Report!
What our reports offer:
- Market share assessments for the regional and country-level segments
- Strategic recommendations for the new entrants
- Covers market data for 2020, 2021, and 2025
- Market trends (drivers, opportunities, threats, challenges, investment opportunities, and recommendations)
- Strategic recommendations in key business segments based on the market estimations
- Competitive landscaping mapping the key common trends
- Company profiling with detailed strategies, financials, and recent developments
- Supply chain trends mapping the latest technological advancements
The competitive scenario provided in the Hair Care Market report analyzes, evaluates, and positions companies based on various performance indicators. Some of the factors considered for this analysis include the financial performance of companies over the past few years, growth strategies, product innovations, new product launches, investments, growth in market share, etc.Don't wait, Make a strategic approach & boost your business goals with our Hair Care Market Forecast Report - Buy Now!
Related Reports:
- The haircare market share in Africa is expected to increase to USD 994.06 million from 2021 to 2026, and the market's growth momentum will accelerate at a CAGR of 6.35%.
- The hair color market share is expected to reach an estimated USD 18.09 billion by 2026 at an accelerating CAGR of 8.21%.
Hair Care Market Scope | |
Report Coverage | Details |
Page number | 120 |
Base year | 2021 |
Forecast period | 2022-2026 |
Growth momentum & CAGR | Accelerate at a CAGR of 3.78% |
Market growth 2022-2026 | USD 17.12 billion |
Market structure | Fragmented |
YoY growth (%) | 3.07 |
Regional analysis | Europe, APAC, North America, South America, the Middle East, and Africa |
Performing market contribution | APAC at 33% |
Key consumer countries | US, China, Japan, Germany, and the UK |
Competitive landscape | Leading companies, competitive strategies, consumer engagement scope |
Companies profiled | American crew, Amway Corp., CavinKare Pvt. Ltd., Chatters Ltd. Partnership, Colgate-Palmolive Co., Coty Inc., Emami Ltd., Godrej and Boyce Manufacturing Co. Ltd., Hanz de Fuko LLC, Henkel AG and Co.KGaA, Hindustan Unilever Ltd., Jack Black L.L.C., John Paul Mitchell Systems, Johnson and Johnson, Kao Corp., LOreal SA, NATULIQUE Ltd., Natura and CO Holding S.A., Shiseido Co. Ltd, The Procter and Gamble Co., Truefitt and Hill, and Aveda Corp |
Market Dynamics | Parent market analysis, Market growth inducers and obstacles, Fast-growing and slow-growing segment analysis, COVID 19 impact and future consumer dynamics, market condition analysis for the forecast period, |
Customization purview | If our report has not included the data that you are looking for, you can reach out to our analysts and get segments customized. |
Browse for Technavio "Consumer Staples Market" Research Reports
Table of Content
1 Executive Summary
- 1.1 Market Overview
- Exhibit 01: Executive Summary – Chart on Market Overview
- Exhibit 02: Executive Summary – Data Table on Market Overview
- Exhibit 03: Executive Summary – Chart on Global Market Characteristics
- Exhibit 04: Executive Summary – Chart on Market by Geography
- Exhibit 05: Executive Summary – Chart on Market Segmentation by Product
- Exhibit 06: Executive Summary – Chart on Market Segmentation by Distribution Channel
- Exhibit 07: Executive Summary – Chart on Incremental Growth
- Exhibit 08: Executive Summary – Data Table on Incremental Growth
- Exhibit 09: Executive Summary – Chart on Vendor Market Positioning
2 Market Landscape
- 2.1 Market ecosystem
- Exhibit 10: Parent market
- Exhibit 11: Market Characteristics
3 Market Sizing
- 3.1 Market Definition
- Exhibit 12: Offerings of vendors included in the market definition
- 3.2 Market segment analysis
- Exhibit 13: Market segments
- 3.3 Market size 2021
- 3.4 Market outlook: Forecast for 2021-2026
- Exhibit 14: Chart on Global - Market size and forecast 2021-2026 ($ million)
- Exhibit 15: Data Table on Global - Market size and forecast 2021-2026 ($ million)
- Exhibit 16: Chart on Global Market: Year-over-year growth 2021-2026 (%)
- Exhibit 17: Data Table on Global Market: Year-over-year growth 2021-2026 (%)
4 Five Forces Analysis
- 4.1 Five forces summary
- Exhibit 18: Five forces analysis - Comparison between 2021 and 2026
- 4.2 Bargaining power of buyers
- Exhibit 19: Chart on Bargaining power of buyers – Impact of key factors 2021 and 2026
- 4.3 Bargaining power of suppliers
- Exhibit 20: Bargaining power of suppliers – Impact of key factors in 2021 and 2026
- 4.4 Threat of new entrants
- Exhibit 21: Threat of new entrants – Impact of key factors in 2021 and 2026
- 4.5 Threat of substitutes
- Exhibit 22: Threat of substitutes – Impact of key factors in 2021 and 2026
- 4.6 Threat of rivalry
- Exhibit 23: Threat of rivalry – Impact of key factors in 2021 and 2026
- 4.7 Market condition
- Exhibit 24: Chart on Market condition - Five forces 2021 and 2026
5 Market Segmentation by Product
- 5.1 Market segments
- Exhibit 25: Chart on Product - Market share 2021-2026 (%)
- Exhibit 26: Data Table on Product - Market share 2021-2026 (%)
- 5.2 Comparison by Product
- Exhibit 27: Chart on Comparison by Product
- Exhibit 28: Data Table on Comparison by Product
- 5.3 Shampoo - Market size and forecast 2021-2026
- Exhibit 29: Chart on Shampoo - Market size and forecast 2021-2026 ($ million)
- Exhibit 30: Data Table on Shampoo - Market size and forecast 2021-2026 ($ million)
- Exhibit 31: Chart on Shampoo - Year-over-year growth 2021-2026 (%)
- Exhibit 32: Data Table on Shampoo - Year-over-year growth 2021-2026 (%)
- 5.4 Hair color - Market size and forecast 2021-2026
- Exhibit 33: Chart on Hair color - Market size and forecast 2021-2026 ($ million)
- Exhibit 34: Data Table on Hair color - Market size and forecast 2021-2026 ($ million)
- Exhibit 35: Chart on Hair color - Year-over-year growth 2021-2026 (%)
- Exhibit 36: Data Table on Hair color - Year-over-year growth 2021-2026 (%)
- 5.5 Conditioner - Market size and forecast 2021-2026
- Exhibit 37: Chart on Conditioner - Market size and forecast 2021-2026 ($ million)
- Exhibit 38: Data Table on Conditioner - Market size and forecast 2021-2026 ($ million)
- Exhibit 39: Chart on Conditioner - Year-over-year growth 2021-2026 (%)
- Exhibit 40: Data Table on Conditioner - Year-over-year growth 2021-2026 (%)
- 5.6 Others - Market size and forecast 2021-2026
- Exhibit 41: Chart on Others - Market size and forecast 2021-2026 ($ million)
- Exhibit 42: Data Table on Others - Market size and forecast 2021-2026 ($ million)
- Exhibit 43: Chart on Others - Year-over-year growth 2021-2026 (%)
- Exhibit 44: Data Table on Others - Year-over-year growth 2021-2026 (%)
- 5.7 Market opportunity by Product
- Exhibit 45: Market opportunity by Product ($ million)
6 Market Segmentation by Distribution Channel
- 6.1 Market segments
- Exhibit 46: Chart on Distribution Channel - Market share 2021-2026 (%)
- Exhibit 47: Data Table on Distribution Channel - Market share 2021-2026 (%)
- 6.2 Comparison by Distribution Channel
- Exhibit 48: Chart on Comparison by Distribution Channel
- Exhibit 49: Data Table on Comparison by Distribution Channel
- 6.3 Offline - Market size and forecast 2021-2026
- Exhibit 50: Chart on Offline - Market size and forecast 2021-2026 ($ million)
- Exhibit 51: Data Table on Offline - Market size and forecast 2021-2026 ($ million)
- Exhibit 52: Chart on Offline - Year-over-year growth 2021-2026 (%)
- Exhibit 53: Data Table on Offline - Year-over-year growth 2021-2026 (%)
- 6.4 Online - Market size and forecast 2021-2026
- Exhibit 54: Chart on Online - Market size and forecast 2021-2026 ($ million)
- Exhibit 55: Data Table on Online - Market size and forecast 2021-2026 ($ million)
- Exhibit 56: Chart on Online - Year-over-year growth 2021-2026 (%)
- Exhibit 57: Data Table on Online - Year-over-year growth 2021-2026 (%)
- 6.5 Market opportunity by Distribution Channel
- Exhibit 58: Market opportunity by Distribution Channel ($ million)
7 Customer Landscape
- 7.1 Customer landscape overview
- Exhibit 59: Analysis of price sensitivity, lifecycle, customer purchase basket, adoption rates, and purchase criteria
8 Geographic Landscape
- 8.1 Geographic segmentation
- Exhibit 60: Chart on Market share by geography 2021-2026 (%)
- Exhibit 61: Data Table on Market share by geography 2021-2026 (%)
- 8.2 Geographic comparison
- Exhibit 62: Chart on Geographic comparison
- Exhibit 63: Data Table on Geographic comparison
- 8.3 Europe - Market size and forecast 2021-2026
- Exhibit 64: Chart on Europe - Market size and forecast 2021-2026 ($ million)
- Exhibit 65: Data Table on Europe - Market size and forecast 2021-2026 ($ million)
- Exhibit 66: Chart on Europe - Year-over-year growth 2021-2026 (%)
- Exhibit 67: Data Table on Europe - Year-over-year growth 2021-2026 (%)
- 8.4 APAC - Market size and forecast 2021-2026
- Exhibit 68: Chart on APAC - Market size and forecast 2021-2026 ($ million)
- Exhibit 69: Data Table on APAC - Market size and forecast 2021-2026 ($ million)
- Exhibit 70: Chart on APAC - Year-over-year growth 2021-2026 (%)
- Exhibit 71: Data Table on APAC - Year-over-year growth 2021-2026 (%)
- 8.5 North America - Market size and forecast 2021-2026
- Exhibit 72: Chart on North America - Market size and forecast 2021-2026 ($ million)
- Exhibit 73: Data Table on North America - Market size and forecast 2021-2026 ($ million)
- Exhibit 74: Chart on North America - Year-over-year growth 2021-2026 (%)
- Exhibit 75: Data Table on North America - Year-over-year growth 2021-2026 (%)
- 8.6 South America - Market size and forecast 2021-2026
- Exhibit 76: Chart on South America - Market size and forecast 2021-2026 ($ million)
- Exhibit 77: Data Table on South America - Market size and forecast 2021-2026 ($ million)
- Exhibit 78: Chart on South America - Year-over-year growth 2021-2026 (%)
- Exhibit 79: Data Table on South America - Year-over-year growth 2021-2026 (%)
- 8.7 Middle East and Africa - Market size and forecast 2021-2026
- Exhibit 80: Chart on the Middle East and Africa - Market size and forecast 2021-2026 ($ million)
- Exhibit 81: Data Table on the Middle East and Africa - Market size and forecast 2021-2026 ($ million)
- Exhibit 82: Chart on the Middle East and Africa - Year-over-year growth 2021-2026 (%)
- Exhibit 83: Data Table on the Middle East and Africa - Year-over-year growth 2021-2026 (%)
- 8.8 US - Market size and forecast 2021-2026
- Exhibit 84: Chart on the US - Market size and forecast 2021-2026 ($ million)
- Exhibit 85: Data Table on the US - Market size and forecast 2021-2026 ($ million)
- Exhibit 86: Chart on the US - Year-over-year growth 2021-2026 (%)
- Exhibit 87: Data Table on the US - Year-over-year growth 2021-2026 (%)
- 8.9 China - Market size and forecast 2021-2026
- Exhibit 88: Chart on China - Market size and forecast 2021-2026 ($ million)
- Exhibit 89: Data Table on China - Market size and forecast 2021-2026 ($ million)
- Exhibit 90: Chart on China - Year-over-year growth 2021-2026 (%)
- Exhibit 91: Data Table on China - Year-over-year growth 2021-2026 (%)
- 8.10 Japan - Market size and forecast 2021-2026
- Exhibit 92: Chart on Japan - Market size and forecast 2021-2026 ($ million)
- Exhibit 93: Data Table on Japan - Market size and forecast 2021-2026 ($ million)
- Exhibit 94: Chart on Japan - Year-over-year growth 2021-2026 (%)
- Exhibit 95: Data Table on Japan - Year-over-year growth 2021-2026 (%)
- 8.11 Germany - Market size and forecast 2021-2026
- Exhibit 96: Chart on Germany - Market size and forecast 2021-2026 ($ million)
- Exhibit 97: Data Table on Germany - Market size and forecast 2021-2026 ($ million)
- Exhibit 98: Chart on Germany - Year-over-year growth 2021-2026 (%)
- Exhibit 99: Data Table on Germany - Year-over-year growth 2021-2026 (%)
- 8.12 UK - Market size and forecast 2021-2026
- Exhibit 100: Chart on UK - Market size and forecast 2021-2026 ($ million)
- Exhibit 101: Data Table on UK - Market size and forecast 2021-2026 ($ million)
- Exhibit 102: Chart on UK - Year-over-year growth 2021-2026 (%)
- Exhibit 103: Data Table on UK - Year-over-year growth 2021-2026 (%)
- 8.13 Market opportunity by geography
- Exhibit 104: Market opportunity by geography ($ million)
9 Drivers, Challenges, and Trends
- 9.1 Market drivers
- 9.2 Market challenges
- 9.3 Impact of drivers and challenges
- Exhibit 105: Impact of drivers and challenges in 2021 and 2026
- 9.4 Market trends
10 Vendor Landscape
- 10.1 Overview
- 10.2 Vendor landscape
- Exhibit 106: Overview on Criticality of inputs and Factors of differentiation
- 10.3 Landscape disruption
- Exhibit 107: Overview on factors of disruption
- 10.4 Industry risks
- Exhibit 108: Impact of key risks on business
11 Vendor Analysis
- 11.1 Vendors covered
- Exhibit 109: Vendors covered
- 11.2 Market positioning of vendors
- Exhibit 110: Matrix on vendor position and classification
- 11.3 American crew
- Exhibit 111: American crew - Overview
- Exhibit 112: American crew - Product / Service
- Exhibit 113: American crew - Key offerings
- 11.4 Amway Corp.
- Exhibit 114: Amway Corp. - Overview
- Exhibit 115: Amway Corp. - Product / Service
- Exhibit 116: Amway Corp. - Key news
- Exhibit 117: Amway Corp. - Key offerings
- 11.5 Colgate-Palmolive Co.
- Exhibit 118: Colgate-Palmolive Co. - Overview
- Exhibit 119: Colgate-Palmolive Co. - Business segments
- Exhibit 120: Colgate-Palmolive Co. - Key news
- Exhibit 121: Colgate-Palmolive Co. - Key offerings
- Exhibit 122: Colgate-Palmolive Co. - Segment focus
- 11.6 Godrej and Boyce Manufacturing Co. Ltd.
- Exhibit 123: Godrej and Boyce Manufacturing Co. Ltd. - Overview
- Exhibit 124: Godrej and Boyce Manufacturing Co. Ltd. - Business segments
- Exhibit 125: Godrej and Boyce Manufacturing Co. Ltd. - Key offerings
- Exhibit 126: Godrej and Boyce Manufacturing Co. Ltd. - Segment focus
- 11.7 Hanz de Fuko LLC
- Exhibit 127: Hanz de Fuko LLC - Overview
- Exhibit 128: Hanz de Fuko LLC - Product / Service
- Exhibit 129: Hanz de Fuko LLC - Key offerings
- 11.8 Hindustan Unilever Ltd.
- Exhibit 130: Hindustan Unilever Ltd. - Overview
- Exhibit 131: Hindustan Unilever Ltd. - Product / Service
- Exhibit 132: Hindustan Unilever Ltd. - Key offerings
- 11.9 Jack Black L.L.C.
- Exhibit 133: Jack Black L.L.C. - Overview
- Exhibit 134: Jack Black L.L.C. - Product / Service
- Exhibit 135: Jack Black L.L.C. - Key offerings
- 11.10 Johnson and Johnson
- Exhibit 136: Johnson and Johnson - Overview
- Exhibit 137: Johnson and Johnson - Business segments
- Exhibit 138: Johnson and Johnson - Key news
- Exhibit 139: Johnson and Johnson - Key offerings
- Exhibit 140: Johnson and Johnson - Segment focus
- 11.11 LOreal SA
- Exhibit 141: LOreal SA - Overview
- Exhibit 142: LOreal SA - Business segments
- Exhibit 143: LOreal SA - Key news
- Exhibit 144: LOreal SA - Key offerings
- Exhibit 145: LOreal SA - Segment focus
- 11.12 The Procter and Gamble Co.
- Exhibit 146: The Procter and Gamble Co. - Overview
- Exhibit 147: The Procter and Gamble Co. - Business segments
- Exhibit 148: The Procter and Gamble Co. - Key news
- Exhibit 149: The Procter and Gamble Co. - Key offerings
- Exhibit 150: The Procter and Gamble Co. - Segment focus
12 Appendix
- 12.1 Scope of the report
- 12.2 Inclusions and exclusions checklist
- Exhibit 151: Inclusions checklist
- Exhibit 152: Exclusions checklist
- 12.3 Currency conversion rates for US$
- Exhibit 153: Currency conversion rates for US$
- 12.4 Research methodology
- Exhibit 154: Research methodology
- Exhibit 155: Validation techniques employed for market sizing
- Exhibit 156: Information sources
- 12.5 List of abbreviations
- Exhibit 157: List of abbreviations
About Us
Technavio is a leading global technology research and advisory company. Their research and analysis focus on emerging market trends and provide actionable insights to help businesses identify market opportunities and develop effective strategies to optimize their market positions. With over 500 specialized analysts, Technavio's report library consists of more than 17,000 reports and counting, covering 800 technologies, spanning 50 countries. Their client base consists of enterprises of all sizes, including more than 100 Fortune 500 companies. This growing client base relies on Technavio's comprehensive coverage, extensive research, and actionable market insights to identify opportunities in existing and potential markets and assess their competitive positions within changing market scenarios.
Contact
Technavio Research
Jesse Maida
Media & Marketing Executive
US: +1 844 364 1100
UK: +44 203 893 3200
Email: media@technavio.com
Website: www.technavio.com/


SOURCE Technavio
© 2024 Benzinga.com. Benzinga does not provide investment advice. All rights reserved.
Trade confidently with insights and alerts from analyst ratings, free reports and breaking news that affects the stocks you care about.

