


NEW YORK, Aug. 4, 2022 /PRNewswire/ -- The "Solar Power Market in Brazil by End-user, Application, and Geography - Forecast and Analysis 2022-2026" report has been added to Technavio's offering. According to the report, the market will observe an incremental growth of 89.57 TWh between 2021 and 2026. However, the growth momentum is expected to decelerate at a CAGR of 47.24% during the forecast period. The report provides a comprehensive analysis of recent developments, new product launches, major revenue-generating segments, and market behavior across geographies. Download Sample PDF Report Here

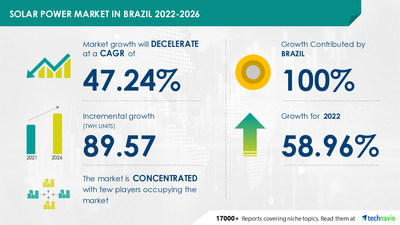
The market is concentrated due to the presence of few vendors operating in the competitive landscape. Vendors are adopting various organic and inorganic growth strategies such as new product launches and engaging in M&A activities to increase their market shares. For instance, in September 2021, Canadian Solar Inc. announced the long-term operations and maintenance agreements with two solar PV plus battery storage projects in the US. Similarly, in January 2021, JinkoSolar Holding Co. Ltd. announced the agreement with ALDO Solar, the leading distributor of solar power equipment.
Technavio identifies Abengoa SA, BrightSource Energy Inc., Canadian Solar Inc., ENGIE SA, First Solar Inc., JinkoSolar Holding Co. Ltd., Scatec ASA, Tata Power Co. Ltd., Waaree Energies Ltd., and Yingli Green Energy Holding Co. Ltd. as some of the major market participants.
The market is primarily driven by the presence of sunny climatic conditions in Brazil. Brazil is located in a latitude zone where the incidence of solar radiation is maximum than the rest of the globe. This has significantly boosted the solar power sector in the country over the years. In addition, trends such as the increasing usage of renewable electricity will have a positive impact on the growth of the market. However, the slow growth in photovoltaic systems, high construction and maintenance of solar power plants, and the inclination toward hydropower plants will hamper the growth opportunities of market players.
To make the most of the opportunities, market vendors should focus more on the growth prospects in the fast-growing segments, while maintaining their positions in the slow-growing segments. View Sample Report Here
The solar power market in Brazil is segmented as below:
- End-user
- Utility
- Rooftop
The utility segment held the largest share of the market in 2021. The market growth in the segment will be significant during the forecast period.
- Application
- Grid-connected
- Off-grid
By application, the grid-connected segment will account for maximum revenue generation in the market. Technavio presents a detailed picture of the market by the way of study, synthesis, and summation of data from multiple sources. Our solar power market in Brazil report covers the following areas:
Solar Power Market in Brazil 2022-2026: Vendor Analysis
We provide a detailed analysis of around 25 vendors operating in the solar power market in Brazil. Backed with competitive intelligence and benchmarking, our research report on the solar power market in Brazil in designed to provide entry support, customer profile, and M&As as well as go-to-market strategy support.
Solar Power Market in Brazil 2022-2026: Key Highlights
- CAGR of the market during the forecast period 2022-2026
- Detailed information on factors that will assist solar power market growth in Brazil during the next five years
- Estimation of the solar power market size in Brazil and its contribution to the parent market
- Predictions on upcoming trends and changes in consumer behavior
- The growth of the solar power market in Brazil
- Analysis of the market's competitive landscape and detailed information on vendors
- Comprehensive details of factors that will challenge the growth of solar power market vendors in Brazil
Related Reports:
- Solar Shingles Market by Type and Geography - Forecast and Analysis 2022-2026
- Solar Home Systems Market by Type and Geography - Forecast and Analysis 2022-2026
Solar Power Market in Brazil: Scope | |
Report Coverage | Details |
Page number | 120 |
Base year | 2021 |
Forecast period | 2022-2026 |
Growth momentum & CAGR | Decelerate at a CAGR of 47.24% |
Market growth 2022-2026 | 89.57 TWh units |
Market structure | Concentrated |
YoY growth (%) | 58.96 |
Regional analysis | Brazil |
Performing market contribution | Brazil at 100% |
Key consumer countries | Brazil |
Competitive landscape | Leading companies, competitive strategies, consumer engagement scope |
Companies profiled | Abengoa SA, BrightSource Energy Inc., Canadian Solar Inc., ENGIE SA, First Solar Inc., JinkoSolar Holding Co. Ltd., Scatec ASA, Tata Power Co. Ltd., Waaree Energies Ltd., and Yingli Green Energy Holding Co. Ltd. |
Market Dynamics | Parent market analysis, Market growth inducers and obstacles, Fast-growing and slow-growing segment analysis, COVID 19 impact and future consumer dynamics, and market condition analysis for the forecast period. |
Customization purview | If our report has not included the data that you are looking for, you can reach out to our analysts and get segments customized. |
Table Of Contents :
1. Executive Summary
1.1 Market Overview
Exhibit 01: Key Finding 1
Exhibit 02: Key Finding 2
Exhibit 03: Key Finding 5
Exhibit 04: Key Finding 6
Exhibit 05: Key Finding 7
2. Market Landscape
2.1 Market ecosystem
2.1.1 Parent Market
Exhibit 06: Parent market
Exhibit 07: Market characteristics
2.2 Value chain analysis
Exhibit 08: Value chain analysis : Renewable Electricity
2.2.1 Inputs
2.2.2 Electricity generation
2.2.3 Electricity transmission
2.2.4 Electricity distribution
2.2.5 End-users
2.2.6 Innovations
3. Market Sizing
3.1 Market definition
Exhibit 09: Offerings of vendors included in the market definition
3.2 Market segment analysis
Exhibit 10: Market segments
3.3 Market size 2021
3.4 Market outlook: Forecast for 2021 - 2026
3.4.1 Estimating growth rates for emerging and high-growth markets
3.4.2 Estimating growth rates for mature markets
Exhibit 11: Global - Market size and forecast 2021 - 2026 (TWh)
Exhibit 12: Global market: Year-over-year growth 2021 - 2026 (%)
4. Five Forces Analysis
4.1 Five Forces Summary
Exhibit 13: Five forces analysis 2021 & 2026
4.2 Bargaining power of buyers
Exhibit 14: Bargaining power of buyers
4.3 Bargaining power of suppliers
Exhibit 15: Bargaining power of suppliers
4.4 Threat of new entrants
Exhibit 16: Threat of new entrants
4.5 Threat of substitutes
Exhibit 17: Threat of substitutes
4.6 Threat of rivalry
Exhibit 18: Threat of rivalry
4.7 Market condition
Exhibit 19: Market condition - Five forces 2021
5. Market Segmentation by Application
5.1 Market segments
The segments covered in this chapter are:
- Grid-connected
- Off-grid
Exhibit 20: Application - Market share 2021-2026 (%)
5.2 Comparison by Application
Exhibit 21: Comparison by Application
5.3 Grid-connected - Market size and forecast 2021-2026
Exhibit 22: Grid-connected - Market size and forecast 2021-2026 (TWh)
Exhibit 23: Grid-connected - Year-over-year growth 2021-2026 (%)
5.4 Off-grid - Market size and forecast 2021-2026
Exhibit 24: Off-grid - Market size and forecast 2021-2026 (TWh)
Exhibit 25: Off-grid - Year-over-year growth 2021-2026 (%)
5.5 Market opportunity by Application
Exhibit 26: Market opportunity by Application
6. Market Segmentation by End-user
6.1 Market segments
The segments covered in this chapter are:
- Utility
- Rooftop
Exhibit 27: End-user - Market share 2021-2026 (%)
6.2 Comparison by End-user
Exhibit 28: Comparison by End-user
6.3 Utility - Market size and forecast 2021-2026
Exhibit 29: Utility - Market size and forecast 2021-2026 (TWh)
Exhibit 30: Utility - Year-over-year growth 2021-2026 (%)
6.4 Rooftop - Market size and forecast 2021-2026
Exhibit 31: Rooftop - Market size and forecast 2021-2026 (TWh)
Exhibit 32: Rooftop - Year-over-year growth 2021-2026 (%)
6.5 Market opportunity by End-user
Exhibit 33: Market opportunity by End-user
7. Customer landscape
Technavio's customer landscape matrix comparing Drivers or price sensitivity, Adoption lifecycle, importance in customer price basket, Adoption rate and Key purchase criteria
7.1 Overview
Exhibit 34: Customer landscape
8. Drivers, Challenges, and Trends
8.1 Market drivers
8.1.1 Sunny climatic conditions
8.1.2 Provides ecological balance
8.1.3 Uplifting factor for the economy
8.2 Market challenges
8.2.1 Slow growth in photovoltaic system
8.2.2 High cost of construction and maintenance
8.2.3 Inclination towards hydropower plants.
Exhibit 35: Impact of drivers and challenges
8.3 Market trends
8.3.1 Increasing renewable electricity usage
8.3.2 A large portion of household, agricultural, and industrial users can fulfill their own energy requirements
8.3.3 Increasing electricity demand
9. Vendor Landscape
9.1 Overview
Exhibit 36: Vendor landscape
9.2 Landscape disruption
Exhibit 37: Landscape disruption
Exhibit 38: Industry risks
9.3 Competitive Landscape
10. Vendor Analysis
10.1 Vendors covered
Exhibit 39: Vendors covered
10.2 Market positioning of vendors
Exhibit 40: Market positioning of vendors
10.3 Abengoa SA
Exhibit 41: Abengoa SA - Overview
Exhibit 42: Abengoa SA - Product and service
Exhibit 43: Abengoa SA - Key offerings
10.4 BrightSource Energy Inc.
Exhibit 44: BrightSource Energy Inc. - Overview
Exhibit 45: BrightSource Energy Inc. - Product and service
Exhibit 46: BrightSource Energy Inc. - Key offerings
10.5 Canadian Solar Inc.
Exhibit 47: Canadian Solar Inc. - Overview
Exhibit 48: Canadian Solar Inc. - Business segments
Exhibit 49: Canadian Solar Inc. - Key news
Exhibit 50: Canadian Solar Inc. - Key offerings
Exhibit 51: Canadian Solar Inc. - Segment focus
10.6 ENGIE SA
Exhibit 52: ENGIE SA - Overview
Exhibit 53: ENGIE SA - Business segments
Exhibit 54: ENGIE SA - Key offerings
Exhibit 55: ENGIE SA - Segment focus
10.7 First Solar Inc.
Exhibit 56: First Solar Inc. - Overview
Exhibit 57: First Solar Inc. - Business segments
Exhibit 58: First Solar Inc. - Key offerings
Exhibit 59: First Solar Inc. - Segment focus
10.8 JinkoSolar Holding Co. Ltd.
Exhibit 60: JinkoSolar Holding Co. Ltd. - Overview
Exhibit 61: JinkoSolar Holding Co. Ltd. - Business segments
Exhibit 62: JinkoSolar Holding Co. Ltd. - Key news
Exhibit 63: JinkoSolar Holding Co. Ltd. - Key offerings
Exhibit 64: JinkoSolar Holding Co. Ltd. - Segment focus
10.9 Scatec ASA
Exhibit 65: Scatec ASA - Overview
Exhibit 66: Scatec ASA - Business segments
Exhibit 67: Scatec ASA - Key news
Exhibit 68: Scatec ASA - Key offerings
Exhibit 69: Scatec ASA - Segment focus
10.10 Tata Power Co. Ltd.
Exhibit 70: Tata Power Co. Ltd. - Overview
Exhibit 71: Tata Power Co. Ltd. - Business segments
Exhibit 72: Tata Power Co. Ltd. - Key offerings
Exhibit 73: Tata Power Co. Ltd. - Segment focus
10.11 Waaree Energies Ltd.
Exhibit 74: Waaree Energies Ltd. - Overview
Exhibit 75: Waaree Energies Ltd. - Business segments
Exhibit 76: Waaree Energies Ltd. - Key offerings
Exhibit 77: Waaree Energies Ltd. - Segment focus
10.12 Yingli Green Energy Holding Co. Ltd.
Exhibit 78: Yingli Green Energy Holding Co. Ltd. - Overview
Exhibit 79: Yingli Green Energy Holding Co. Ltd. - Business segments
Exhibit 80: Yingli Green Energy Holding Co. Ltd. - Key offerings
Exhibit 81: Yingli Green Energy Holding Co. Ltd. - Segment focus
11. Appendix
11.1 Scope of the report
11.1.1 Market definition
11.1.2 Objectives
11.1.3 Notes and caveats
11.2 Currency conversion rates for US$
Exhibit 82: Currency conversion rates for US$
11.3 Research Methodology
Exhibit 83: Research Methodology
Exhibit 84: Validation techniques employed for market sizing
Exhibit 85: Information sources
11.4 List of abbreviations
Exhibit 86: List of abbreviations
About Us
Technavio is a leading global technology research and advisory company. Their research and analysis focus on emerging market trends and provides actionable insights to help businesses identify market opportunities and develop effective strategies to optimize their market positions. With over 500 specialized analysts, Technavio's report library consists of more than 17,000 reports and counting, covering 800 technologies, spanning across 50 countries. Their client base consists of enterprises of all sizes, including more than 100 Fortune 500 companies. This growing client base relies on Technavio's comprehensive coverage, extensive research, and actionable market insights to identify opportunities in existing and potential markets and assess their competitive positions within changing market scenarios.
Contact
Technavio Research
Jesse Maida
Media & Marketing Executive
US: +1 844 364 1100
UK: +44 203 893 3200
Email: media@technavio.com
Website: www.technavio.com/


SOURCE Technavio
© 2024 Benzinga.com. Benzinga does not provide investment advice. All rights reserved.
Trade confidently with insights and alerts from analyst ratings, free reports and breaking news that affects the stocks you care about.

