


Growing demand for feed enzymes will be one of the key trends in the algae-based animal feed and ingredients market during 2022-2026
NEW YORK, Aug. 2, 2022 /PRNewswire/ -- The global algae-based animal feed and ingredients market is a part of the global packaged foods and meats market. Apart from the market in focus, Technavio's market analysis reports also provide in-depth coverage of the external factors influencing the parent market growth potential in the coming years.

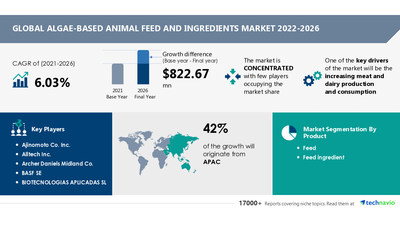
In this report, Technavio defines 2021 as the base year and 2022-2026 as the forecast period. The size of the global algae-based animal feed and ingredients market is anticipated to grow by USD 822.67 million from 2021 to 2026. However, the growth momentum of the market will accelerate at a CAGR of 6.03% during the forecast period. Our report describes in detail the various factors that are responsible for the market growth and the growth momentum.
Find key market insights by Technavio to help your organization foster innovation and make effective decisions. View our Exclusive Sample Report
What are the Some of the Topics Covered in this Report?
- Overview of the Market
- Market Sizing
- Five Forces Analysis
- Market Segmentation
- Factors Impacting Market Growth
- Vendor Analysis
What are the Various Segments Covered in this Report?
Segmentation | Segments |
Product | Feed and feed ingredient |
Application | Poultry, swine, ruminant, and aquaculture |
Distribution channel | Offline and online |
Geography | APAC, North America, Europe, Middle East and Africa, and South America |
What are the Factors Driving the Growth of the Algae-based Animal Feed and Ingredients Market?
The growth of the algae-based animal feed and ingredients market will be driven by the increasing meat and dairy production and consumption. Livestock rearing and the consumption of animal products are key to the economic and nutritional well-being of people. In addition, economic growth has fueled the production and consumption of meat, which, in turn, has improved the sales of algae-based animal feed and ingredients. Over the past few decades, dairy consumption has been increasing. The US and Western Europe account for the highest share of the global dairy market.
What are the Trends Supporting the Growth of the Algae-based Animal Feed and Ingredients Market?
The growing demand for feed enzymes is a key trend that will support the growth of the algae-based animal feed and ingredients market. Feed enzymes help in better feed conversion by livestock, improve the rate of biochemical reactions and feed quality, and contribute to animal welfare. They are added to stock feed meant for pigs, poultry, cattle, and aqua to enhance their production efficiency. In addition, consumers are focusing on adopting animal feed enzymes due to the increasing cost of natural feed products. Thus, an increasing shift towards animal feed enzymes will propel the growth of the algae-based animal feed and ingredients market during the forecast period.
Technavio helps businesses keep up with the key trends in the market. Download an Exclusive Sample Report
Which are the Major Vendors Operating in the Algae-based Animal Feed and Ingredients Market?
According to Technavio, the major vendors operating in the algae-based animal feed and ingredients market include Ajinomoto Co. Inc., Alltech Inc., Archer Daniels Midland Co., BASF SE, BIOTECNOLOGIAS APLICADAS SL, Cargill Inc., Cellana Inc., Centafarm SRL, Chr Hansen Holding AS, Corbion NV, Cyanotech Corp., Duplaco BV, DuPont de Nemours Inc., Evonik Industries AG, Global Nutrition International, Kemin Industries Inc., Koninklijke DSM NV, Novozymes AS, Nutreco NV, and TEGASA, among others.
Is the Market Fragmented or Concentrated?
The algae-based animal feed and ingredients market is concentrated, and the vendors are deploying growth strategies such as price, quality, innovation, reputation, and distribution to compete in the market. The market is highly consolidated because there are few small and large vendors.
Does Technavio Provide Any Subscription Offers?
Technavio provides two subscription offers, a Basic Plan billed annually at USD 5000 and a Team Plan billed annually at USD 8500. Choose any offer that is the most suitable for you and make use of the vast repository of reports offered by Technavio to improve your business!
Related Reports
Animal Feed Market by Animal Type and Geography - Forecast and Analysis 2022-2026
Non-GMO Animal Feed Market by Product and Geography - Forecast and Analysis 2022-2026
Algae-based Animal Feed and Ingredients Market Scope | |
Report Coverage | Details |
Page number | 120 |
Base year | 2021 |
Forecast period | 2022-2026 |
Growth momentum & CAGR | Accelerate at a CAGR of 6.03% |
Market growth 2022-2026 | USD 822.67 million |
Market structure | Concentrated |
YoY growth (%) | 5.46 |
Regional analysis | APAC, North America, Europe, South America, and Middle East and Africa |
Performing market contribution | APAC at 42% |
Key consumer countries | US, China, Japan, Germany, and UK |
Competitive landscape | Leading companies, Competitive strategies, Consumer engagement scope |
Key companies profiled | Ajinomoto Co. Inc., Alltech Inc., Archer Daniels Midland Co., BASF SE, BIOTECNOLOGIAS APLICADAS SL, Cargill Inc., Cellana Inc., Centafarm SRL, Chr Hansen Holding AS, Corbion NV, Cyanotech Corp., Duplaco BV, DuPont de Nemours Inc., Evonik Industries AG, Global Nutrition International, Kemin Industries Inc., Koninklijke DSM NV, Novozymes AS, Nutreco NV, and TEGASA |
Market dynamics | Parent market analysis, Market growth inducers and obstacles, Fast-growing and slow-growing segment analysis, COVID 19 impact and recovery analysis and future consumer dynamics, and Market condition analysis for the forecast period. |
Customization purview | If our report has not included the data that you are looking for, you can reach out to our analysts and get segments customized. |
Table of Contents
1 Executive Summary
- 1.1 Market overview
- Exhibit 01: Executive Summary – Chart on Market Overview
- Exhibit 02: Executive Summary – Data Table on Market Overview
- Exhibit 03: Executive Summary – Chart on Global Market Characteristics
- Exhibit 04: Executive Summary – Chart on Market by Geography
- Exhibit 05: Executive Summary – Chart on Market Segmentation by Product
- Exhibit 06: Executive Summary – Chart on Market Segmentation by Application
- Exhibit 07: Executive Summary – Chart on Market Segmentation by Distribution Channel
- Exhibit 08: Executive Summary – Chart on Incremental Growth
- Exhibit 09: Executive Summary – Data Table on Incremental Growth
- Exhibit 10: Executive Summary – Chart on Vendor Market Positioning
2 Market Landscape
- 2.1 Market ecosystem
- Exhibit 11: Parent market
- Exhibit 12: Market Characteristics
3 Market Sizing
- 3.1 Market definition
- Exhibit 13: Offerings of vendors included in the market definition
- 3.2 Market segment analysis
- Exhibit 14: Market segments
- 3.3 Market size 2021
- 3.4 Market outlook: Forecast for 2021-2026
- Exhibit 15: Chart on Global - Market size and forecast 2021-2026 ($ million)
- Exhibit 16: Data Table on Global - Market size and forecast 2021-2026 ($ million)
- Exhibit 17: Chart on Global Market: Year-over-year growth 2021-2026 (%)
- Exhibit 18: Data Table on Global Market: Year-over-year growth 2021-2026 (%)
4 Five Forces Analysis
- 4.1 Five forces summary
- Exhibit 19: Five forces analysis - Comparison between 2021 and 2026
- 4.2 Bargaining power of buyers
- Exhibit 20: Chart on Bargaining power of buyers – Impact of key factors 2021 and 2026
- 4.3 Bargaining power of suppliers
- Exhibit 21: Bargaining power of suppliers – Impact of key factors in 2021 and 2026
- 4.4 Threat of new entrants
- Exhibit 22: Threat of new entrants – Impact of key factors in 2021 and 2026
- 4.5 Threat of substitutes
- Exhibit 23: Threat of substitutes – Impact of key factors in 2021 and 2026
- 4.6 Threat of rivalry
- Exhibit 24: Threat of rivalry – Impact of key factors in 2021 and 2026
- 4.7 Market condition
- Exhibit 25: Chart on Market condition - Five forces 2021 and 2026
5 Market Segmentation by Product
- 5.1 Market segments
- Exhibit 26: Chart on Product - Market share 2021-2026 (%)
- Exhibit 27: Data Table on Product - Market share 2021-2026 (%)
- 5.2 Comparison by Product
- Exhibit 28: Chart on Comparison by Product
- Exhibit 29: Data Table on Comparison by Product
- 5.3 Feed - Market size and forecast 2021-2026
- Exhibit 30: Chart on Feed - Market size and forecast 2021-2026 ($ million)
- Exhibit 31: Data Table on Feed - Market size and forecast 2021-2026 ($ million)
- Exhibit 32: Chart on Feed - Year-over-year growth 2021-2026 (%)
- Exhibit 33: Data Table on Feed - Year-over-year growth 2021-2026 (%)
- 5.4 Feed ingredient - Market size and forecast 2021-2026
- Exhibit 34: Chart on Feed ingredient - Market size and forecast 2021-2026 ($ million)
- Exhibit 35: Data Table on Feed ingredient - Market size and forecast 2021-2026 ($ million)
- Exhibit 36: Chart on Feed ingredient - Year-over-year growth 2021-2026 (%)
- Exhibit 37: Data Table on Feed ingredient - Year-over-year growth 2021-2026 (%)
- 5.5 Market opportunity by Product
- Exhibit 38: Market opportunity by Product ($ million)
6 Market Segmentation by Application
- 6.1 Market segments
- Exhibit 39: Chart on Application - Market share 2021-2026 (%)
- Exhibit 40: Data Table on Application - Market share 2021-2026 (%)
- 6.2 Comparison by Application
- Exhibit 41: Chart on Comparison by Application
- Exhibit 42: Data Table on Comparison by Application
- 6.3 Poultry - Market size and forecast 2021-2026
- Exhibit 43: Chart on Poultry - Market size and forecast 2021-2026 ($ million)
- Exhibit 44: Data Table on Poultry - Market size and forecast 2021-2026 ($ million)
- Exhibit 45: Chart on Poultry - Year-over-year growth 2021-2026 (%)
- Exhibit 46: Data Table on Poultry - Year-over-year growth 2021-2026 (%)
- 6.4 Swine - Market size and forecast 2021-2026
- Exhibit 47: Chart on Swine - Market size and forecast 2021-2026 ($ million)
- Exhibit 48: Data Table on Swine - Market size and forecast 2021-2026 ($ million)
- Exhibit 49: Chart on Swine - Year-over-year growth 2021-2026 (%)
- Exhibit 50: Data Table on Swine - Year-over-year growth 2021-2026 (%)
- 6.5 Ruminant - Market size and forecast 2021-2026
- Exhibit 51: Chart on Ruminant - Market size and forecast 2021-2026 ($ million)
- Exhibit 52: Data Table on Ruminant - Market size and forecast 2021-2026 ($ million)
- Exhibit 53: Chart on Ruminant - Year-over-year growth 2021-2026 (%)
- Exhibit 54: Data Table on Ruminant - Year-over-year growth 2021-2026 (%)
- 6.6 Aquaculture - Market size and forecast 2021-2026
- Exhibit 55: Chart on Aquaculture - Market size and forecast 2021-2026 ($ million)
- Exhibit 56: Data Table on Aquaculture - Market size and forecast 2021-2026 ($ million)
- Exhibit 57: Chart on Aquaculture - Year-over-year growth 2021-2026 (%)
- Exhibit 58: Data Table on Aquaculture - Year-over-year growth 2021-2026 (%)
- 6.7 Market opportunity by Application
- Exhibit 59: Market opportunity by Application ($ million)
7 Market Segmentation by Distribution Channel
- 7.1 Market segments
- Exhibit 60: Chart on Distribution Channel - Market share 2021-2026 (%)
- Exhibit 61: Data Table on Distribution Channel - Market share 2021-2026 (%)
- 7.2 Comparison by Distribution Channel
- Exhibit 62: Chart on Comparison by Distribution Channel
- Exhibit 63: Data Table on Comparison by Distribution Channel
- 7.3 Offline - Market size and forecast 2021-2026
- Exhibit 64: Chart on Offline - Market size and forecast 2021-2026 ($ million)
- Exhibit 65: Data Table on Offline - Market size and forecast 2021-2026 ($ million)
- Exhibit 66: Chart on Offline - Year-over-year growth 2021-2026 (%)
- Exhibit 67: Data Table on Offline - Year-over-year growth 2021-2026 (%)
- 7.4 Online - Market size and forecast 2021-2026
- Exhibit 68: Chart on Online - Market size and forecast 2021-2026 ($ million)
- Exhibit 69: Data Table on Online - Market size and forecast 2021-2026 ($ million)
- Exhibit 70: Chart on Online - Year-over-year growth 2021-2026 (%)
- Exhibit 71: Data Table on Online - Year-over-year growth 2021-2026 (%)
- 7.5 Market opportunity by Distribution Channel
- Exhibit 72: Market opportunity by Distribution Channel ($ million)
8 Customer Landscape
- 8.1 Customer landscape overview
- Exhibit 73: Analysis of price sensitivity, lifecycle, customer purchase basket, adoption rates, and purchase criteria
9 Geographic Landscape
- 9.1 Geographic segmentation
- Exhibit 74: Chart on Market share by geography 2021-2026 (%)
- Exhibit 75: Data Table on Market share by geography 2021-2026 (%)
- 9.2 Geographic comparison
- Exhibit 76: Chart on Geographic comparison
- Exhibit 77: Data Table on Geographic comparison
- 9.3 APAC - Market size and forecast 2021-2026
- Exhibit 78: Chart on APAC - Market size and forecast 2021-2026 ($ million)
- Exhibit 79: Data Table on APAC - Market size and forecast 2021-2026 ($ million)
- Exhibit 80: Chart on APAC - Year-over-year growth 2021-2026 (%)
- Exhibit 81: Data Table on APAC - Year-over-year growth 2021-2026 (%)
- 9.4 North America - Market size and forecast 2021-2026
- Exhibit 82: Chart on North America - Market size and forecast 2021-2026 ($ million)
- Exhibit 83: Data Table on North America - Market size and forecast 2021-2026 ($ million)
- Exhibit 84: Chart on North America - Year-over-year growth 2021-2026 (%)
- Exhibit 85: Data Table on North America - Year-over-year growth 2021-2026 (%)
- 9.5 Europe - Market size and forecast 2021-2026
- Exhibit 86: Chart on Europe - Market size and forecast 2021-2026 ($ million)
- Exhibit 87: Data Table on Europe - Market size and forecast 2021-2026 ($ million)
- Exhibit 88: Chart on Europe - Year-over-year growth 2021-2026 (%)
- Exhibit 89: Data Table on Europe - Year-over-year growth 2021-2026 (%)
- 9.6 South America - Market size and forecast 2021-2026
- Exhibit 90: Chart on South America - Market size and forecast 2021-2026 ($ million)
- Exhibit 91: Data Table on South America - Market size and forecast 2021-2026 ($ million)
- Exhibit 92: Chart on South America - Year-over-year growth 2021-2026 (%)
- Exhibit 93: Data Table on South America - Year-over-year growth 2021-2026 (%)
- 9.7 Middle East and Africa - Market size and forecast 2021-2026
- Exhibit 94: Chart on Middle East and Africa - Market size and forecast 2021-2026 ($ million)
- Exhibit 95: Data Table on Middle East and Africa - Market size and forecast 2021-2026 ($ million)
- Exhibit 96: Chart on Middle East and Africa - Year-over-year growth 2021-2026 (%)
- Exhibit 97: Data Table on Middle East and Africa - Year-over-year growth 2021-2026 (%)
- 9.8 US - Market size and forecast 2021-2026
- Exhibit 98: Chart on US - Market size and forecast 2021-2026 ($ million)
- Exhibit 99: Data Table on US - Market size and forecast 2021-2026 ($ million)
- Exhibit 100: Chart on US - Year-over-year growth 2021-2026 (%)
- Exhibit 101: Data Table on US - Year-over-year growth 2021-2026 (%)
- 9.9 China - Market size and forecast 2021-2026
- Exhibit 102: Chart on China - Market size and forecast 2021-2026 ($ million)
- Exhibit 103: Data Table on China - Market size and forecast 2021-2026 ($ million)
- Exhibit 104: Chart on China - Year-over-year growth 2021-2026 (%)
- Exhibit 105: Data Table on China - Year-over-year growth 2021-2026 (%)
- 9.10 Germany - Market size and forecast 2021-2026
- Exhibit 106: Chart on Germany - Market size and forecast 2021-2026 ($ million)
- Exhibit 107: Data Table on Germany - Market size and forecast 2021-2026 ($ million)
- Exhibit 108: Chart on Germany - Year-over-year growth 2021-2026 (%)
- Exhibit 109: Data Table on Germany - Year-over-year growth 2021-2026 (%)
- 9.11 Japan - Market size and forecast 2021-2026
- Exhibit 110: Chart on Japan - Market size and forecast 2021-2026 ($ million)
- Exhibit 111: Data Table on Japan - Market size and forecast 2021-2026 ($ million)
- Exhibit 112: Chart on Japan - Year-over-year growth 2021-2026 (%)
- Exhibit 113: Data Table on Japan - Year-over-year growth 2021-2026 (%)
- 9.12 UK - Market size and forecast 2021-2026
- Exhibit 114: Chart on UK - Market size and forecast 2021-2026 ($ million)
- Exhibit 115: Data Table on UK - Market size and forecast 2021-2026 ($ million)
- Exhibit 116: Chart on UK - Year-over-year growth 2021-2026 (%)
- Exhibit 117: Data Table on UK - Year-over-year growth 2021-2026 (%)
- 9.13 Market opportunity by geography
- Exhibit 118: Market opportunity by geography ($ million)
10 Drivers, Challenges, and Trends
- 10.1 Market drivers
- 10.2 Market challenges
- 10.3 Impact of drivers and challenges
- Exhibit 119: Impact of drivers and challenges in 2021 and 2026
- 10.4 Market trends
11 Vendor Landscape
- 11.1 Overview
- 11.2 Vendor landscape
- Exhibit 120: Overview on Criticality of inputs and Factors of differentiation
- 11.3 Landscape disruption
- Exhibit 121: Overview on factors of disruption
- 11.4 Industry risks
- Exhibit 122: Impact of key risks on business
12 Vendor Analysis
- 12.1 Vendors covered
- Exhibit 123: Vendors covered
- 12.2 Market positioning of vendors
- Exhibit 124: Matrix on vendor position and classification
- 12.3 Alltech Inc.
- Exhibit 125: Alltech Inc. - Overview
- Exhibit 126: Alltech Inc. - Product / Service
- Exhibit 127: Alltech Inc. - Key offerings
- 12.4 Archer Daniels Midland Co.
- Exhibit 128: Archer Daniels Midland Co. - Overview
- Exhibit 129: Archer Daniels Midland Co. - Business segments
- Exhibit 130: Archer Daniels Midland Co. - Key offerings
- Exhibit 131: Archer Daniels Midland Co. - Segment focus
- 12.5 BASF SE
- Exhibit 132: BASF SE - Overview
- Exhibit 133: BASF SE - Business segments
- Exhibit 134: BASF SE - Key news
- Exhibit 135: BASF SE - Key offerings
- Exhibit 136: BASF SE - Segment focus
- 12.6 BIOTECNOLOGIAS APLICADAS SL
- Exhibit 137: BIOTECNOLOGIAS APLICADAS SL - Overview
- Exhibit 138: BIOTECNOLOGIAS APLICADAS SL - Product / Service
- Exhibit 139: BIOTECNOLOGIAS APLICADAS SL - Key offerings
- 12.7 Cargill Inc.
- Exhibit 140: Cargill Inc. - Overview
- Exhibit 141: Cargill Inc. - Product / Service
- Exhibit 142: Cargill Inc. - Key news
- Exhibit 143: Cargill Inc. - Key offerings
- 12.8 Cellana Inc.
- Exhibit 144: Cellana Inc. - Overview
- Exhibit 145: Cellana Inc. - Product / Service
- Exhibit 146: Cellana Inc. - Key offerings
- 12.9 Corbion NV
- Exhibit 147: Corbion NV - Overview
- Exhibit 148: Corbion NV - Business segments
- Exhibit 149: Corbion NV - Key news
- Exhibit 150: Corbion NV - Key offerings
- Exhibit 151: Corbion NV - Segment focus
- 12.10 Cyanotech Corp.
- Exhibit 152: Cyanotech Corp. - Overview
- Exhibit 153: Cyanotech Corp. - Product / Service
- Exhibit 154: Cyanotech Corp. - Key offerings
- 12.11 Duplaco BV
- Exhibit 155: Duplaco BV - Overview
- Exhibit 156: Duplaco BV - Product / Service
- Exhibit 157: Duplaco BV - Key offerings
- 12.12 Koninklijke DSM NV
- Exhibit 158: Koninklijke DSM NV - Overview
- Exhibit 159: Koninklijke DSM NV - Business segments
- Exhibit 160: Koninklijke DSM NV - Key news
- Exhibit 161: Koninklijke DSM NV - Key offerings
- Exhibit 162: Koninklijke DSM NV - Segment focus
13 Appendix
- 13.1 Scope of the report
- 13.2 Inclusions and exclusions checklist
- Exhibit 163: Inclusions checklist
- Exhibit 164: Exclusions checklist
- 13.3 Currency conversion rates for US$
- Exhibit 165: Currency conversion rates for US$
- 13.4 Research methodology
- Exhibit 166: Research methodology
- Exhibit 167: Validation techniques employed for market sizing
- Exhibit 168: Information sources
- 13.5 List of abbreviations
- Exhibit 169: List of abbreviations
Technavio is a leading global technology research and advisory company. Their research and analysis focus on emerging market trends and provide actionable insights to help businesses identify market opportunities and develop effective strategies to optimize their market positions. With over 500 specialized analysts, Technavio's report library Their client base consists of enterprises of all sizes, including more than 100 Fortune 500 companies. This growing client base relies on Technavio's comprehensive coverage, extensive research, and actionable market insights to identify opportunities in existing and potential markets and assess their competitive positions within changing market scenarios.
Technavio Research
Jesse Maida
Media & Marketing Executive
US: +1 844 364 1100
UK: +44 203 893 3200
Email:media@technavio.com
Website: www.technavio.com/


SOURCE Technavio
© 2024 Benzinga.com. Benzinga does not provide investment advice. All rights reserved.
Trade confidently with insights and alerts from analyst ratings, free reports and breaking news that affects the stocks you care about.

