


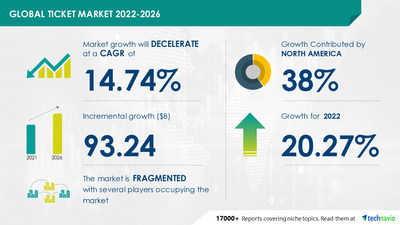
NEW YORK , Aug. 1, 2022 /PRNewswire/ -- The Ticket Market size is expected to grow by USD 93.24 billion between 2021-2026. The market will witness a CAGR of 14.74% during the forecast period. The success of movies due to the increasing use of animation is notably driving the ticket market growth, although factors such as the growing threat of terrorism may impede the market growth.

The ticket industry analysis report extensively covers ticket market segmentation by:
- Source - Primary and secondary
- Type - Sporting events, movies, concerts, and performing arts
- Geography - North America, Europe, APAC, South America, Middle East, and Africa
Read the 120-page report with TOC on "Ticket Market Analysis Report by Type and Geography and the Segment Forecasts,2022-2026". Request market snapshot before purchasing.
The growing competition in the market is compelling vendors to adopt various growth strategies such as ticket industry analysis, promotional activities, and spending on advertisements to improve the visibility of their services. Some vendors are also adopting inorganic growth strategies such as M&As to remain competitive in the market.
The report analyzes the market's competitive landscape and offers information on several market vendors, including:
- 6Connex
- Alliance Tickets
- AMC Entertainment Holdings Inc.
- Anschutz Entertainment Group
- Atom Tickets LLC
- Bigtree Entertainment Pvt. Ltd.
- Cinemark Holdings Inc.
- Cineplex Inc.
- Citizen Ticket Ltd.
- Coast To Coast Tickets LLC
- Comcast Corp.
- CTS Eventim AG and Co. KGaA
- eBay Inc.
Technavio's sample reports contain multiple sections of the report, such as the market size and forecast, drivers, challenges, trends, and more. Download sample report
The primary segment's share of the ticket market will expand significantly. The growing quantity of movies that are released each year is what is fueling the expansion of this market. The expansion of this market is also being driven by the rise in the number of professional events, including sporting events, live music performances, and exhibitions. The demands of primary ticket end users are diverse and intricate. Customers have a wide range of options, which has sparked fierce competition among the suppliers in this market.
- CAGR of the market during the forecast period
- Detailed information on factors that will assist ticket market growth during the next five years
- Estimation of the ticket market size and its contribution to the parent market
- Predictions on upcoming trends and changes in consumer behavior
- The growth of the ticket market
- Analysis of the market's competitive landscape and detailed information on vendors
- Comprehensive details of factors that will challenge the growth of ticket market vendors
Do reach out to our analysts for more customized reports as per your requirements. Speak to our Analyst now!
Hair Styling Equipment Market Growth, Size, Trends, Analysis Report by Type, Application, Region, and Segment Forecast 2022-2026: The hair styling equipment market share is expected to increase to USD 4.30 billion from 2021 to 2026, and the market's growth momentum will accelerate at a CAGR of 5.5%.
Smart Yoga Mat Market by Distribution Channel and Geography - Forecast and Analysis 2022-2026: The smart yoga mat market share is expected to increase to USD 164.18 million from 2021 to 2026, and the market's growth momentum will accelerate at a CAGR of 6.43%.
Ticket Market Scope | |
Report Coverage | Details |
Page number | 120 |
Base year | 2021 |
Forecast period | 2022-2026 |
Growth momentum & CAGR | Decelerate at a CAGR of 14.74% |
Market growth 2022-2026 | $ 93.24 billion |
Market structure | Fragmented |
YoY growth (%) | 20.27 |
Regional analysis | North America, Europe, APAC, South America, Middle East, and Africa |
Performing market contribution | North America at 38% |
Key consumer countries | US, Canada, China, UK, and Germany |
Competitive landscape | Leading companies, Competitive Strategies, Consumer engagement scope |
Key companies profiled | 6Connex, Alliance Tickets, AMC Entertainment Holdings Inc., Anschutz Entertainment Group, Atom Tickets LLC, Bigtree Entertainment Pvt. Ltd., Cinemark Holdings Inc., Cineplex Inc., Citizen Ticket Ltd., Coast To Coast Tickets LLC, Comcast Corp., CTS Eventim AG, and Co. KGaA, eBay Inc., Eventbee Inc., Festicket Ltd., Ideabud Inc., Live Nation Entertainment Inc., One97 Communications Ltd., TickPick LLC, and Viagogo AG |
Market dynamics | Parent market analysis, Market growth inducers and obstacles, Fast-growing and slow-growing segment analysis, COVID 19 impact and recovery analysis and future consumer dynamics, Market condition analysis for the forecast period |
Customization purview | If our report has not included the data that you are looking for, you can reach out to our analysts and get segments customized. |
1 Executive Summary
- 1.1 Market Overview
- Exhibit 01: Executive Summary – Chart on Market Overview
- Exhibit 02: Executive Summary – Data Table on Market Overview
- Exhibit 03: Executive Summary – Chart of Global Market Characteristics
- Exhibit 04: Executive Summary – Chart of Market by Geography
- Exhibit 05: Executive Summary – Chart on Market Segmentation by Source
- Exhibit 06: Executive Summary – Chart on Market Segmentation by Type
- Exhibit 07: Executive Summary – Chart on Incremental Growth
- Exhibit 08: Executive Summary – Data Table on Incremental Growth
- Exhibit 09: Executive Summary – Chart on Vendor Market Positioning
2 Market Landscape
- 2.1 Market ecosystem
- Exhibit 10: Parent market
- Exhibit 11: Market Characteristics
3 Market Sizing
- 3.1 Market Definition
- Exhibit 12: Offerings of vendors included in the market definition
- 3.2 Market segment analysis
- Exhibit 13: Market segments
- 3.3 Market size 2021
- 3.4 Market outlook: Forecast for 2021-2026
- Exhibit 14: Chart on Global - Market size and forecast 2021-2026 ($ billion)
- Exhibit 15: Data Table on Global - Market size and forecast 2021-2026 ($ billion)
- Exhibit 16: Chart on Global Market: Year-over-year growth 2021-2026 (%)
- Exhibit 17: Data Table on Global Market: Year-over-year growth 2021-2026 (%)
4 Five Forces Analysis
- 4.1 Five forces summary
- Exhibit 18: Five forces analysis - Comparison between2021 and 2026
- 4.2 Bargaining power of buyers
- Exhibit 19: Chart on the Bargaining power of buyers – Impact of key factors 2021 and 2026
- 4.3 Bargaining power of suppliers
- Exhibit 20: Bargaining power of suppliers – Impact of key factors in 2021 and 2026
- 4.4 Threat of new entrants
- Exhibit 21: Threat of new entrants – Impact of key factors in 2021 and 2026
- 4.5 Threat of substitutes
- Exhibit 22: Threat of substitutes – Impact of key factors in 2021 and 2026
- 4.6 Threat of rivalry
- Exhibit 23: Threat of rivalry – Impact of key factors in 2021 and 2026
- 4.7 Market condition
- Exhibit 24: Chart of Market condition - Five forces 2021 and 2026
5 Market Segmentation by Source
- 5.1 Market segments
- Exhibit 25: Chart on Source - Market share 2021-2026 (%)
- Exhibit 26: Data Table on Source - Market share 2021-2026 (%)
- 5.2 Comparison by Source
- Exhibit 27: Chart on Comparison by Source
- Exhibit 28: Data Table on Comparison by Source
- 5.3 Primary - Market size and forecast 2021-2026
- Exhibit 29: Chart on Primary - Market size and forecast 2021-2026 ($ billion)
- Exhibit 30: Data Table on Primary - Market size and forecast 2021-2026 ($ billion)
- Exhibit 31: Chart on Primary - Year-over-year growth 2021-2026 (%)
- Exhibit 32: Data Table on Primary - Year-over-year growth 2021-2026 (%)
- 5.4 Secondary - Market size and forecast 2021-2026
- Exhibit 33: Chart on Secondary - Market size and forecast 2021-2026 ($ billion)
- Exhibit 34: Data Table on Secondary - Market size and forecast 2021-2026 ($ billion)
- Exhibit 35: Chart on Secondary - Year-over-year growth 2021-2026 (%)
- Exhibit 36: Data Table on Secondary - Year-over-year growth 2021-2026 (%)
- 5.5 Market opportunity by Source
- Exhibit 37: Market opportunity by Source ($ billion)
6 Market Segmentation by Type
- 6.1 Market segments
- Exhibit 38: Chart on Type - Market share 2021-2026 (%)
- Exhibit 39: Data Table on Type - Market share 2021-2026 (%)
- 6.2 Comparison by Type
- Exhibit 40: Chart on Comparison by Type
- Exhibit 41: Data Table on Comparison by Type
- 6.3 Sporting events - Market size and forecast 2021-2026
- Exhibit 42: Chart on Sporting events - Market size and forecast 2021-2026 ($ billion)
- Exhibit 43: Data Table on Sporting events - Market size and forecast 2021-2026 ($ billion)
- Exhibit 44: Chart on Sporting events - Year-over-year growth 2021-2026 (%)
- Exhibit 45: Data Table on Sporting events - Year-over-year growth 2021-2026 (%)
- 6.4 Movies - Market size and forecast 2021-2026
- Exhibit 46: Chart on Movies - Market size and forecast 2021-2026 ($ billion)
- Exhibit 47: Data Table on Movies - Market size and forecast 2021-2026 ($ billion)
- Exhibit 48: Chart on Movies - Year-over-year growth 2021-2026 (%)
- Exhibit 49: Data Table on Movies - Year-over-year growth 2021-2026 (%)
- 6.5 Concerts - Market size and forecast 2021-2026
- Exhibit 50: Chart on Concerts - Market size and forecast 2021-2026 ($ billion)
- Exhibit 51: Data Table on Concerts - Market size and forecast 2021-2026 ($ billion)
- Exhibit 52: Chart on Concerts - Year-over-year growth 2021-2026 (%)
- Exhibit 53: Data Table on Concerts - Year-over-year growth 2021-2026 (%)
- 6.6 Performing arts - Market size and forecast 2021-2026
- Exhibit 54: Chart on Performing arts - Market size and forecast 2021-2026 ($ billion)
- Exhibit 55: Data Table on Performing arts - Market size and forecast 2021-2026 ($ billion)
- Exhibit 56: Chart on Performing arts - Year-over-year growth 2021-2026 (%)
- Exhibit 57: Data Table on Performing arts - Year-over-year growth 2021-2026 (%)
- 6.7 Market opportunity by Type
- Exhibit 58: Market opportunity by Type ($ billion)
7 Customer Landscape
- 7.1 Customer landscape overview
- Exhibit 59: Analysis of price sensitivity, lifecycle, customer purchase basket, adoption rates, and purchase criteria
8 Geographic Landscape
- 8.1 Geographic segmentation
- Exhibit 60: Chart of Market share by geography 2021-2026 (%)
- Exhibit 61: Data Table on Market share by geography 2021-2026 (%)
- 8.2 Geographic comparison
- Exhibit 62: Chart of Geographic comparison
- Exhibit 63: Data Table on Geographic comparison
- 8.3 North America - Market size and forecast 2021-2026
- Exhibit 64: Chart on North America - Market size and forecast 2021-2026 ($ billion)
- Exhibit 65: Data Table on North America - Market size and forecast 2021-2026 ($ billion)
- Exhibit 66: Chart on North America - Year-over-year growth 2021-2026 (%)
- Exhibit 67: Data Table on North America - Year-over-year growth 2021-2026 (%)
- 8.4 Europe - Market size and forecast 2021-2026
- Exhibit 68: Chart on Europe - Market size and forecast 2021-2026 ($ billion)
- Exhibit 69: Data Table on Europe - Market size and forecast 2021-2026 ($ billion)
- Exhibit 70: Chart on Europe - Year-over-year growth 2021-2026 (%)
- Exhibit 71: Data Table on Europe - Year-over-year growth 2021-2026 (%)
- 8.5 APAC - Market size and forecast 2021-2026
- Exhibit 72: Chart on APAC - Market size and forecast 2021-2026 ($ billion)
- Exhibit 73: Data Table on APAC - Market size and forecast 2021-2026 ($ billion)
- Exhibit 74: Chart on APAC - Year-over-year growth 2021-2026 (%)
- Exhibit 75: Data Table on APAC - Year-over-year growth 2021-2026 (%)
- 8.6 South America - Market size and forecast 2021-2026
- Exhibit 76: Chart on South America - Market size and forecast 2021-2026 ($ billion)
- Exhibit 77: Data Table on South America - Market size and forecast 2021-2026 ($ billion)
- Exhibit 78: Chart on South America - Year-over-year growth 2021-2026 (%)
- Exhibit 79: Data Table on South America - Year-over-year growth 2021-2026 (%)
- 8.7 the Middle East and Africa - Market size and forecast 2021-2026
- Exhibit 80: Chart of Middle East and Africa - Market size and forecast 2021-2026 ($ billion)
- Exhibit 81: Data Table on the Middle East and Africa - Market size and forecast 2021-2026 ($ billion)
- Exhibit 82: Chart on the Middle East and Africa - Year-over-year growth 2021-2026 (%)
- Exhibit 83: Data Table on the Middle East and Africa - Year-over-year growth 2021-2026 (%)
- 8.8 US - Market size and forecast 2021-2026
- Exhibit 84: Chart on the US - Market size and forecast 2021-2026 ($ billion)
- Exhibit 85: Data Table on the US - Market size and forecast 2021-2026 ($ billion)
- Exhibit 86: Chart on the US - Year-over-year growth 2021-2026 (%)
- Exhibit 87: Data Table on the US - Year-over-year growth 2021-2026 (%)
- 8.9 UK - Market size and forecast 2021-2026
- Exhibit 88: Chart on the UK - Market size and forecast 2021-2026 ($ billion)
- Exhibit 89: Data Table on the UK - Market size and forecast 2021-2026 ($ billion)
- Exhibit 90: Chart on the UK - Year-over-year growth 2021-2026 (%)
- Exhibit 91: Data Table on the UK - Year-over-year growth 2021-2026 (%)
- 8.10 China - Market size and forecast 2021-2026
- Exhibit 92: Chart on China - Market size and forecast 2021-2026 ($ billion)
- Exhibit 93: Data Table on China - Market size and forecast 2021-2026 ($ billion)
- Exhibit 94: Chart on China - Year-over-year growth 2021-2026 (%)
- Exhibit 95: Data Table on China - Year-over-year growth 2021-2026 (%)
- 8.11 Germany - Market size and forecast 2021-2026
- Exhibit 96: Chart on Germany - Market size and forecast 2021-2026 ($ billion)
- Exhibit 97: Data Table on Germany - Market size and forecast 2021-2026 ($ billion)
- Exhibit 98: Chart on Germany - Year-over-year growth 2021-2026 (%)
- Exhibit 99: Data Table on Germany - Year-over-year growth 2021-2026 (%)
- 8.12 Canada - Market size and forecast 2021-2026
- Exhibit 100: Chart on Canada - Market size and forecast 2021-2026 ($ billion)
- Exhibit 101: Data Table on Canada - Market size and forecast 2021-2026 ($ billion)
- Exhibit 102: Chart on Canada - Year-over-year growth 2021-2026 (%)
- Exhibit 103: Data Table on Canada - Year-over-year growth 2021-2026 (%)
- 8.13 Market opportunity by geography
- Exhibit 104: Market opportunity by geography ($ billion)
9 Drivers, Challenges, and Trends
- 9.1 Market drivers
- 9.2 Market challenges
- 9.3 Impact of drivers and challenges
- Exhibit 105: Impact of drivers and challenges in 2021 and 2026
- 9.4 Market trends
10 Vendor Landscape
- 10.1 Overview
- 10.2 Vendor landscape
- Exhibit 106: Overview of Criticality of inputs and Factors of differentiation
- 10.3 Landscape disruption
- Exhibit 107: Overview of factors of disruption
- 10.4 Industry risks
- Exhibit 108: Impact of key risks on business
11 Vendor Analysis
- 11.1 Vendors covered
- Exhibit 109: Vendors covered
- 11.2 Market positioning of vendors
- Exhibit 110: Matrix on vendor position and classification
- 11.3 Alliance Tickets
- Exhibit 111: Alliance Tickets - Overview
- Exhibit 112: Alliance Tickets - Product / Service
- Exhibit 113: Alliance Tickets - Key offerings
- 11.4 AMC Entertainment Holdings Inc.
- Exhibit 114: AMC Entertainment Holdings Inc. - Overview
- Exhibit 115: AMC Entertainment Holdings Inc. - Business segments
- Exhibit 116: AMC Entertainment Holdings Inc. - Key offerings
- Exhibit 117: AMC Entertainment Holdings Inc. - Segment focus
- 11.5 Bigtree Entertainment Pvt. Ltd.
- Exhibit 118: Bigtree Entertainment Pvt. Ltd. - Overview
- Exhibit 119: Bigtree Entertainment Pvt. Ltd. - Product / Service
- Exhibit 120: Bigtree Entertainment Pvt. Ltd. - Key offerings
- 11.6 Cinemark Holdings Inc.
- Exhibit 121: Cinemark Holdings Inc. - Overview
- Exhibit 122: Cinemark Holdings Inc. - Business segments
- Exhibit 123: Cinemark Holdings Inc. - Key offerings
- Exhibit 124: Cinemark Holdings Inc. - Segment focus
- 11.7 Cineplex Inc.
- Exhibit 125: Cineplex Inc. - Overview
- Exhibit 126: Cineplex Inc. - Business segments
- Exhibit 127: Cineplex Inc. - Key offerings
- Exhibit 128: Cineplex Inc. - Segment focus
- 11.8 Coast To Coast Tickets LLC
- Exhibit 129: Coast To Coast Tickets LLC - Overview
- Exhibit 130: Coast To Coast Tickets LLC - Product / Service
- Exhibit 131: Coast To Coast Tickets LLC - Key offerings
- 11.9 CTS Eventim AG and Co. KGaA
- Exhibit 132: CTS Eventim AG and Co. KGaA - Overview
- Exhibit 133: CTS Eventim AG and Co. KGaA - Business segments
- Exhibit 134: CTS Eventim AG and Co. KGaA - Key news
- Exhibit 135: CTS Eventim AG and Co. KGaA - Key offerings
- Exhibit 136: CTS Eventim AG and Co. KGaA - Segment focus
- 11.10 eBay Inc.
- Exhibit 137: eBay Inc. - Overview
- Exhibit 138: eBay Inc. - Business segments
- Exhibit 139: eBay Inc. - Key news
- Exhibit 140: eBay Inc. - Key offerings
- Exhibit 141: eBay Inc. - Segment focus
- 11.11 Live Nation Entertainment Inc.
- Exhibit 142: Live Nation Entertainment Inc. - Overview
- Exhibit 143: Live Nation Entertainment Inc. - Business segments
- Exhibit 144: Live Nation Entertainment Inc. - Key offerings
- Exhibit 145: Live Nation Entertainment Inc. - Segment focus
- 11.12 TickPick LLC
- Exhibit 146: TickPick LLC - Overview
- Exhibit 147: TickPick LLC - Product / Service
- Exhibit 148: TickPick LLC - Key offerings
12 Appendix
- 12.1 Scope of the report
- 12.2 Inclusions and exclusions checklist
- Exhibit 149: Inclusions checklist
- Exhibit 150: Exclusions checklist
- 12.3 Currency conversion rates for US$
- Exhibit 151: Currency conversion rates for US$
- 12.4 Research methodology
- Exhibit 152: Research methodology
- Exhibit 153: Validation techniques employed for market sizing
- Exhibit 154: Information sources
- 12.5 List of abbreviations
- Exhibit 155: List of abbreviations
Technavio is a leading global technology research and advisory company. Their research and analysis focus on emerging market trends and provide actionable insights to help businesses identify market opportunities and develop effective strategies to optimize their market positions.
With over 500 specialized analysts, Technavio's report library consists of more than 17,000 reports and counting, covering 800 technologies, spanning 50 countries. Their client base consists of enterprises of all sizes, including more than 100 Fortune 500 companies. This growing client base relies on Technavio's comprehensive coverage, extensive research, and actionable market insights to identify opportunities in existing and potential markets and assess their competitive positions within changing market scenarios.
Contacts
Technavio Research
Jesse Maida
Media & Marketing Executive
US: +1 844 364 1100
UK: +44 203 893 3200
Email: media@technavio.com
Website: www.technavio.com/


SOURCE Technavio
© 2024 Benzinga.com. Benzinga does not provide investment advice. All rights reserved.
Trade confidently with insights and alerts from analyst ratings, free reports and breaking news that affects the stocks you care about.

