


NEW YORK, July 29, 2022 /PRNewswire/ -- The latest market analysis report titled Radio Frequency Filters Market by Application, Technology, and Geography - Forecast and Analysis 2022-2026 has been recently added to Technavio's catalog. The analysts at Technavio have categorized the global radio frequency (RF) filters market as a part of the global technology hardware, storage, and peripherals market within the overall global information technology market. The high proliferation of mobile computing devices is one of the key factors likely to influence the market growth positively. In addition, the development of 5G is a key RF filter market trend that is expected to have a positive impact in the coming years. However, the cyclical nature of the semiconductor industry will be a major challenge for the RF filter market during the forecast period.

Key Market Dynamics and their Impact Metrics are available at Technavio. View PDF Sample
RF Filters Market Vendor Landscape
- The market is fragmented, and the degree of fragmentation will decelerate during the forecast period. To make the most of the opportunities, market vendors should focus more on the growth prospects in the fast-growing segments, while maintaining their positions in the slow-growing segments.
- The RF filters market forecast report offers in-depth insights into key vendor profiles. The profiles include information on the production, sustainability, and prospects of the leading companies.
- To survive in this competitive environment, it is vital for vendors to distinguish their product and service offerings through clear and unique value propositions. The vendors in the market are focusing on developing the RF filters for these segments to capitalize on the growth of IoT in RF applications.
- Backed with competitive intelligence and benchmarking, our research reports on the RF Filters Market are designed to provide entry support, customer profile, and M&As as well as go-to-market strategy support.
Some of the key market vendors are:
- Broadcom Inc.: The company offers RF filters that provide small size, low insertion loss, and high rejection.
- Crystek Corp.
- Dover Corp.: The company offers RF filters that are frequency agile, reconfigurable, and tunable.
- Kyocera Corp.: The company offers RF filters such as low Pass and broadband filters for frequencies from 500 kHz to 26 GHz.
- Murata Manufacturing Co. Ltd.: The company offers RF filters designed for difficult bands, modules, and other complex RF front-end requirements, through its subsidiary Resonant.
- NXP Semiconductors NV: The company offers RF filters for cellular infrastructure and consumer and industrial applications.
- Analog Devices Inc.
- Anatech Electronics Inc.
- API Microelectronics Ltd.
- Avnet Inc.
- CTS Corp.
- Qorvo Inc.
- Qualcomm Inc.
- RS Microwave Co. Inc.
- Skyworks Solutions Inc.
- Smiths Group Plc
- STMicroelectronics International NV
- Tai SAW Technology Co. Ltd.
- TAIYO YUDEN CO. LTD.
- TDK Corp.
Want to know about the product offerings and strategic initiatives of the contributing vendors, Request a Sample Now!
RF Filters Market Segmentation Analysis
- Application
- Cellular Devices: The cellular devices application segment held the largest RF filters market share in 2021. The segment will continue to account for the highest revenue throughout the forecast period. The cumulative growth that LTE network deployments will experience through the years will consequently influence the type of cellular phone shipped during the forecast period. Some telecom companies are also increasingly focusing on launching the 5G network. Such product launches in the cellular devices segment can increase the demand for RF filters, which, in turn, will drive the growth of the market during the forecast period.
- GPS Devices
- Tablets
- Others
- Technology
- SAW
- BAW
- Geography
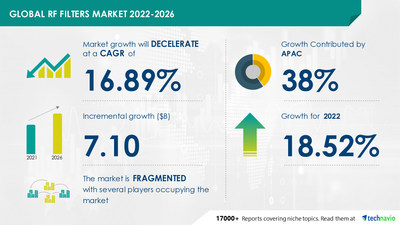
- APAC: 38% of the market's growth will originate from APAC during the forecast period. Taiwan, South Korea, and China are the key markets for RF filters in APAC. Market growth in this region will be faster than the growth of the market in other regions. The high concentration of consumer electronics manufacturers will facilitate the RF filter market growth in APAC over the forecast period.
- Europe
- North America
- Middle East And Africa
- South America
Get Segment-based Insights and Regional Contributions as you Download Sample Report
RF Filters Market Scope
Technavio presents a detailed picture of the market by the way of study, synthesis, and summation of data from multiple sources. Our RF filters market report covers the following areas:
RF Filters FAQs
- Which is the latest market trend taking the market by the storm?
- What are some of the most influential market drivers, restraints, and opportunities (DROs)?
- What are the historical and projected revenue values and CAGR percentage?
- Which strategic initiatives will influence competitive scenarios and define the market growth potential?
- Which regions & segments will garner massive revenue and emerge as market leaders in upcoming years?
- Who are the top market share contributors and their latest organizational restructuring plans?
Related Reports:
Bulk Acoustic Wave Sensors Market by End-user and Geography - Forecast and Analysis 2022-2026
RF Filters Market Scope | |
Report Coverage | Details |
Page number | 120 |
Base year | 2021 |
Forecast period | 2022-2026 |
Growth momentum & CAGR | Decelerate at a CAGR of 16.89% |
Market growth 2022-2026 | $ 7.10 billion |
Market structure | Fragmented |
YoY growth (%) | 18.52 |
Regional analysis | APAC, Europe, North America, Middle East and Africa, and South America |
Performing market contribution | APAC at 38% |
Key consumer countries | US, China, Taiwan, South Korea, and Germany |
Competitive landscape | Leading companies, competitive strategies, consumer engagement scope |
Companies profiled | Analog Devices Inc., Anatech Electronics Inc., API Microelectronics Ltd., Avnet Inc., Broadcom Inc., Crystek Corp., CTS Corp., Dover Corp., Kyocera Corp., Murata Manufacturing Co. Ltd., NXP Semiconductors NV, Qorvo Inc., Qualcomm Inc., RS Microwave Co. Inc., Skyworks Solutions Inc., Smiths Group Plc, STMicroelectronics International NV, Tai SAW Technology Co. Ltd., TAIYO YUDEN CO. LTD., and TDK Corp. |
Market Dynamics | Parent market analysis, Market growth inducers and obstacles, Fast-growing and slow-growing segment analysis, COVID 19 impact and future consumer dynamics, market condition analysis for the forecast period, |
Customization purview | If our report has not included the data that you are looking for, you can reach out to our analysts and get segments customized. |
Table Of Contents :
1 Executive Summary
- 1.1 Market overview
- Exhibit 01: Executive Summary – Chart on Market Overview
- Exhibit 02: Executive Summary – Data Table on Market Overview
- Exhibit 03: Executive Summary – Chart on Global Market Characteristics
- Exhibit 04: Executive Summary – Chart on Market by Geography
- Exhibit 05: Executive Summary – Chart on Market Segmentation by Application
- Exhibit 06: Executive Summary – Chart on Market Segmentation by Technology
- Exhibit 07: Executive Summary – Chart on Incremental Growth
- Exhibit 08: Executive Summary – Data Table on Incremental Growth
- Exhibit 09: Executive Summary – Chart on Vendor Market Positioning
2 Market Landscape
- 2.1 Market ecosystem
- Exhibit 10: Parent market
- Exhibit 11: Market Characteristics
3 Market Sizing
- 3.1 Market definition
- Exhibit 12: Offerings of vendors included in the market definition
- 3.2 Market segment analysis
- Exhibit 13: Market segments
- 3.3 Market size 2021
- 3.4 Market outlook: Forecast for 2021-2026
- Exhibit 14: Chart on Global - Market size and forecast 2021-2026 ($ million)
- Exhibit 15: Data Table on Global - Market size and forecast 2021-2026 ($ million)
- Exhibit 16: Chart on Global Market: Year-over-year growth 2021-2026 (%)
- Exhibit 17: Data Table on Global Market: Year-over-year growth 2021-2026 (%)
4 Five Forces Analysis
- 4.1 Five forces summary
- Exhibit 18: Five forces analysis - Comparison between 2021 and 2026
- 4.2 Bargaining power of buyers
- Exhibit 19: Chart on Bargaining power of buyers – Impact of key factors 2021 and 2026
- 4.3 Bargaining power of suppliers
- Exhibit 20: Bargaining power of suppliers – Impact of key factors in 2021 and 2026
- 4.4 Threat of new entrants
- Exhibit 21: Threat of new entrants – Impact of key factors in 2021 and 2026
- 4.5 Threat of substitutes
- Exhibit 22: Threat of substitutes – Impact of key factors in 2021 and 2026
- 4.6 Threat of rivalry
- Exhibit 23: Threat of rivalry – Impact of key factors in 2021 and 2026
- 4.7 Market condition
- Exhibit 24: Chart on Market condition - Five forces 2021 and 2026
5 Market Segmentation by Application
- 5.1 Market segments
- Exhibit 25: Chart on Application - Market share 2021-2026 (%)
- Exhibit 26: Data Table on Application - Market share 2021-2026 (%)
- 5.2 Comparison by Application
- Exhibit 27: Chart on Comparison by Application
- Exhibit 28: Data Table on Comparison by Application
- 5.3 Cellular devices - Market size and forecast 2021-2026
- Exhibit 29: Chart on Cellular devices - Market size and forecast 2021-2026 ($ million)
- Exhibit 30: Data Table on Cellular devices - Market size and forecast 2021-2026 ($ million)
- Exhibit 31: Chart on Cellular devices - Year-over-year growth 2021-2026 (%)
- Exhibit 32: Data Table on Cellular devices - Year-over-year growth 2021-2026 (%)
- 5.4 GPS devices - Market size and forecast 2021-2026
- Exhibit 33: Chart on GPS devices - Market size and forecast 2021-2026 ($ million)
- Exhibit 34: Data Table on GPS devices - Market size and forecast 2021-2026 ($ million)
- Exhibit 35: Chart on GPS devices - Year-over-year growth 2021-2026 (%)
- Exhibit 36: Data Table on GPS devices - Year-over-year growth 2021-2026 (%)
- 5.5 Tablets - Market size and forecast 2021-2026
- Exhibit 37: Chart on Tablets - Market size and forecast 2021-2026 ($ million)
- Exhibit 38: Data Table on Tablets - Market size and forecast 2021-2026 ($ million)
- Exhibit 39: Chart on Tablets - Year-over-year growth 2021-2026 (%)
- Exhibit 40: Data Table on Tablets - Year-over-year growth 2021-2026 (%)
- 5.6 Others - Market size and forecast 2021-2026
- Exhibit 41: Chart on Others - Market size and forecast 2021-2026 ($ million)
- Exhibit 42: Data Table on Others - Market size and forecast 2021-2026 ($ million)
- Exhibit 43: Chart on Others - Year-over-year growth 2021-2026 (%)
- Exhibit 44: Data Table on Others - Year-over-year growth 2021-2026 (%)
- 5.7 Market opportunity by Application
- Exhibit 45: Market opportunity by Application ($ million)
6 Market Segmentation by Technology
- 6.1 Market segments
- Exhibit 46: Chart on Technology - Market share 2021-2026 (%)
- Exhibit 47: Data Table on Technology - Market share 2021-2026 (%)
- 6.2 Comparison by Technology
- Exhibit 48: Chart on Comparison by Technology
- Exhibit 49: Data Table on Comparison by Technology
- 6.3 SAW - Market size and forecast 2021-2026
- Exhibit 50: Chart on SAW - Market size and forecast 2021-2026 ($ million)
- Exhibit 51: Data Table on SAW - Market size and forecast 2021-2026 ($ million)
- Exhibit 52: Chart on SAW - Year-over-year growth 2021-2026 (%)
- Exhibit 53: Data Table on SAW - Year-over-year growth 2021-2026 (%)
- 6.4 BAW - Market size and forecast 2021-2026
- Exhibit 54: Chart on BAW - Market size and forecast 2021-2026 ($ million)
- Exhibit 55: Data Table on BAW - Market size and forecast 2021-2026 ($ million)
- Exhibit 56: Chart on BAW - Year-over-year growth 2021-2026 (%)
- Exhibit 57: Data Table on BAW - Year-over-year growth 2021-2026 (%)
- 6.5 Market opportunity by Technology
- Exhibit 58: Market opportunity by Technology ($ million)
7 Customer Landscape
- 7.1 Customer landscape overview
- Exhibit 59: Analysis of price sensitivity, lifecycle, customer purchase basket, adoption rates, and purchase criteria
8 Geographic Landscape
- 8.1 Geographic segmentation
- Exhibit 60: Chart on Market share by geography 2021-2026 (%)
- Exhibit 61: Data Table on Market share by geography 2021-2026 (%)
- 8.2 Geographic comparison
- Exhibit 62: Chart on Geographic comparison
- Exhibit 63: Data Table on Geographic comparison
- 8.3 APAC - Market size and forecast 2021-2026
- Exhibit 64: Chart on APAC - Market size and forecast 2021-2026 ($ million)
- Exhibit 65: Data Table on APAC - Market size and forecast 2021-2026 ($ million)
- Exhibit 66: Chart on APAC - Year-over-year growth 2021-2026 (%)
- Exhibit 67: Data Table on APAC - Year-over-year growth 2021-2026 (%)
- 8.4 Europe - Market size and forecast 2021-2026
- Exhibit 68: Chart on Europe - Market size and forecast 2021-2026 ($ million)
- Exhibit 69: Data Table on Europe - Market size and forecast 2021-2026 ($ million)
- Exhibit 70: Chart on Europe - Year-over-year growth 2021-2026 (%)
- Exhibit 71: Data Table on Europe - Year-over-year growth 2021-2026 (%)
- 8.5 North America - Market size and forecast 2021-2026
- Exhibit 72: Chart on North America - Market size and forecast 2021-2026 ($ million)
- Exhibit 73: Data Table on North America - Market size and forecast 2021-2026 ($ million)
- Exhibit 74: Chart on North America - Year-over-year growth 2021-2026 (%)
- Exhibit 75: Data Table on North America - Year-over-year growth 2021-2026 (%)
- 8.6 Middle East and Africa - Market size and forecast 2021-2026
- Exhibit 76: Chart on Middle East and Africa - Market size and forecast 2021-2026 ($ million)
- Exhibit 77: Data Table on Middle East and Africa - Market size and forecast 2021-2026 ($ million)
- Exhibit 78: Chart on Middle East and Africa - Year-over-year growth 2021-2026 (%)
- Exhibit 79: Data Table on Middle East and Africa - Year-over-year growth 2021-2026 (%)
- 8.7 South America - Market size and forecast 2021-2026
- Exhibit 80: Chart on South America - Market size and forecast 2021-2026 ($ million)
- Exhibit 81: Data Table on South America - Market size and forecast 2021-2026 ($ million)
- Exhibit 82: Chart on South America - Year-over-year growth 2021-2026 (%)
- Exhibit 83: Data Table on South America - Year-over-year growth 2021-2026 (%)
- 8.8 China - Market size and forecast 2021-2026
- Exhibit 84: Chart on China - Market size and forecast 2021-2026 ($ million)
- Exhibit 85: Data Table on China - Market size and forecast 2021-2026 ($ million)
- Exhibit 86: Chart on China - Year-over-year growth 2021-2026 (%)
- Exhibit 87: Data Table on China - Year-over-year growth 2021-2026 (%)
- 8.9 US - Market size and forecast 2021-2026
- Exhibit 88: Chart on US - Market size and forecast 2021-2026 ($ million)
- Exhibit 89: Data Table on US - Market size and forecast 2021-2026 ($ million)
- Exhibit 90: Chart on US - Year-over-year growth 2021-2026 (%)
- Exhibit 91: Data Table on US - Year-over-year growth 2021-2026 (%)
- 8.10 Germany - Market size and forecast 2021-2026
- Exhibit 92: Chart on Germany - Market size and forecast 2021-2026 ($ million)
- Exhibit 93: Data Table on Germany - Market size and forecast 2021-2026 ($ million)
- Exhibit 94: Chart on Germany - Year-over-year growth 2021-2026 (%)
- Exhibit 95: Data Table on Germany - Year-over-year growth 2021-2026 (%)
- 8.11 Taiwan - Market size and forecast 2021-2026
- Exhibit 96: Chart on Taiwan - Market size and forecast 2021-2026 ($ million)
- Exhibit 97: Data Table on Taiwan - Market size and forecast 2021-2026 ($ million)
- Exhibit 98: Chart on Taiwan - Year-over-year growth 2021-2026 (%)
- Exhibit 99: Data Table on Taiwan - Year-over-year growth 2021-2026 (%)
- 8.12 South Korea - Market size and forecast 2021-2026
- Exhibit 100: Chart on South Korea - Market size and forecast 2021-2026 ($ million)
- Exhibit 101: Data Table on South Korea - Market size and forecast 2021-2026 ($ million)
- Exhibit 102: Chart on South Korea - Year-over-year growth 2021-2026 (%)
- Exhibit 103: Data Table on South Korea - Year-over-year growth 2021-2026 (%)
- 8.13 Market opportunity by geography
- Exhibit 104: Market opportunity by geography ($ million)
9 Drivers, Challenges, and Trends
- 9.1 Market drivers
- 9.2 Market challenges
- 9.3 Impact of drivers and challenges
- Exhibit 105: Impact of drivers and challenges in 2021 and 2026
- 9.4 Market trends
10 Vendor Landscape
- 10.1 Overview
- 10.2 Vendor landscape
- Exhibit 106: Overview on Criticality of inputs and Factors of differentiation
- 10.3 Landscape disruption
- Exhibit 107: Overview on factors of disruption
- 10.4 Industry risks
- Exhibit 108: Impact of key risks on business
11 Vendor Analysis
- 11.1 Vendors covered
- Exhibit 109: Vendors covered
- 11.2 Market positioning of vendors
- Exhibit 110: Matrix on vendor position and classification
- 11.3 Broadcom Inc.
- Exhibit 111: Broadcom Inc. - Overview
- Exhibit 112: Broadcom Inc. - Business segments
- Exhibit 113: Broadcom Inc. - Key news
- Exhibit 114: Broadcom Inc. - Key offerings
- Exhibit 115: Broadcom Inc. - Segment focus
- 11.4 Dover Corp.
- Exhibit 116: Dover Corp. - Overview
- Exhibit 117: Dover Corp. - Business segments
- Exhibit 118: Dover Corp. - Key news
- Exhibit 119: Dover Corp. - Key offerings
- Exhibit 120: Dover Corp. - Segment focus
- 11.5 Kyocera Corp.
- Exhibit 121: Kyocera Corp. - Overview
- Exhibit 122: Kyocera Corp. - Business segments
- Exhibit 123: Kyocera Corp. - Key news
- Exhibit 124: Kyocera Corp. - Key offerings
- Exhibit 125: Kyocera Corp. - Segment focus
- 11.6 Murata Manufacturing Co. Ltd.
- Exhibit 126: Murata Manufacturing Co. Ltd. - Overview
- Exhibit 127: Murata Manufacturing Co. Ltd. - Business segments
- Exhibit 128: Murata Manufacturing Co. Ltd. - Key news
- Exhibit 129: Murata Manufacturing Co. Ltd. - Key offerings
- Exhibit 130: Murata Manufacturing Co. Ltd. - Segment focus
- 11.7 NXP Semiconductors NV
- Exhibit 131: NXP Semiconductors NV - Overview
- Exhibit 132: NXP Semiconductors NV - Product / Service
- Exhibit 133: NXP Semiconductors NV - Key news
- Exhibit 134: NXP Semiconductors NV - Key offerings
- 11.8 Qorvo Inc.
- Exhibit 135: Qorvo Inc. - Overview
- Exhibit 136: Qorvo Inc. - Business segments
- Exhibit 137: Qorvo Inc. - Key offerings
- Exhibit 138: Qorvo Inc. - Segment focus
- 11.9 Qualcomm Inc.
- Exhibit 139: Qualcomm Inc. - Overview
- Exhibit 140: Qualcomm Inc. - Business segments
- Exhibit 141: Qualcomm Inc. - Key news
- Exhibit 142: Qualcomm Inc. - Key offerings
- Exhibit 143: Qualcomm Inc. - Segment focus
- 11.10 Skyworks Solutions Inc.
- Exhibit 144: Skyworks Solutions Inc. - Overview
- Exhibit 145: Skyworks Solutions Inc. - Product / Service
- Exhibit 146: Skyworks Solutions Inc. - Key offerings
- 11.11 STMicroelectronics International NV
- Exhibit 147: STMicroelectronics International NV - Overview
- Exhibit 148: STMicroelectronics International NV - Business segments
- Exhibit 149: STMicroelectronics International NV - Key news
- Exhibit 150: STMicroelectronics International NV - Key offerings
- Exhibit 151: STMicroelectronics International NV - Segment focus
- 11.12 TAIYO YUDEN CO. LTD.
- Exhibit 152: TAIYO YUDEN CO. LTD. - Overview
- Exhibit 153: TAIYO YUDEN CO. LTD. - Product / Service
- Exhibit 154: TAIYO YUDEN CO. LTD. - Key offerings
12 Appendix
- 12.1 Scope of the report
- 12.2 Inclusions and exclusions checklist
- Exhibit 155: Inclusions checklist
- Exhibit 156: Exclusions checklist
- 12.3 Currency conversion rates for US$
- Exhibit 157: Currency conversion rates for US$
- 12.4 Research methodology
- Exhibit 158: Research methodology
- Exhibit 159: Validation techniques employed for market sizing
- Exhibit 160: Information sources
- 12.5 List of abbreviations
- Exhibit 161: List of abbreviations
- computing devices: Include desktops, notebooks, and tablets o
Technavio is a leading global technology research and advisory company. Their research and analysis focus on emerging market trends and provides actionable insights to help businesses identify market opportunities and develop effective strategies to optimize their market positions. With over 500 specialized analysts, Technavio's report library consists of more than 17,000 reports and counting, covering 800 technologies, spanning across 50 countries. Their client base consists of enterprises of all sizes, including more than 100 Fortune 500 companies. This growing client base relies on Technavio's comprehensive coverage, extensive research, and actionable market insights to identify opportunities in existing and potential markets and assess their competitive positions within changing market scenarios.
Technavio Research
Jesse Maida
Media & Marketing Executive
US: +1 844 364 1100
UK: +44 203 893 3200
Email: media@technavio.com
Website: www.technavio.com/


SOURCE Technavio
© 2024 Benzinga.com. Benzinga does not provide investment advice. All rights reserved.
Trade confidently with insights and alerts from analyst ratings, free reports and breaking news that affects the stocks you care about.

