


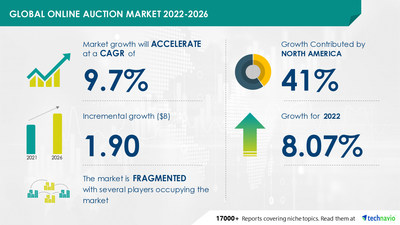
NEW YORK, July 11, 2022 /PRNewswire/ -- The global online auction market size is expected to grow by USD 1.90 billion from 2021 to 2026, at a CAGR of 9.7% as per the latest market report by Technavio. The emergence of AI-based online auctions is an online auction market trend that is expected to have a positive impact in the coming years. Artificial Intelligence (AI)-based online auctions are gaining popularity. AI platforms use machine learning and algorithms to deliver clear, easy, and actionable intelligence to bidders. During online auctions, the use of AI helps reduce administrative costs as a number of processes such as internal operations, customer-based service inquiries, the packaging of purchased industrial equipment, and its delivery can be automated.

For more highlights on the trends - Request a sample report
Major Driver:
- The key factors driving growth in the online auction market is the ease of bidding.
- Online auctions provide bidders with the convenience of flexibility in terms of time and place. One can easily log into the site and participate in the auction, which helps the users save money. Online auctions run over a fixed period and normally take 21 days for marketing and open-house viewings. They do not require the physical presence of the bidders as the process is carried out online. Companies upload images and videos of their stocks and products on their websites.
- Users can conduct research regarding the prices and the quality of the product before participating in the bidding process. This helps users understand the market situations and decide accordingly. It also helps in bargaining while bidding with the sellers or manufacturers. It eliminates the profit made by agents, brokers, or middlemen, thereby making the bidding process much easier and driving the growth of the global online auction market during the forecast period.
Major Challenges:
- The concerns related to fraudulent activities in online auctions will be a major challenge for the online auction market during the forecast period.
- The rapid increase in the number of participants in online auctions has led to a rise in fraudulent activities, making online auction fraud one of the most commonly prevalent online crimes. Bid rigging is one of the main types of fraud in online auctions.
- Bid rigging is primarily seen during the online auction of assets, such as automobiles and construction equipment. This type of fraud suppresses market competition, as the rigged price will be higher than what might have resulted from a competitive bidding process. Furthermore, the quality of products sold through online auctions is another major area of concern. Online auctioneers post fake images, ambiguous descriptions, and false facts about the product being sold through online auctions.
To know about other drivers & challenges - Grab a sample now!
Read the 120-page report with TOC on "Online Auction Market Analysis Report by Product (collectibles, electronics, artistic goods, jewelry, and others) and Geography (North America, Europe, APAC, South America, and the Middle East and Africa), and the Segment Forecasts,2022-2026". Gain competitive intelligence about market leaders. Track key industry opportunities, trends, and threats. Information on marketing, brand, strategy and market development, sales, and supply functions. https://www.technavio.com/report/report/online-auction-market-industry-size-analysis
The online auction market is fragmented and the vendors are deploying growth strategies such as investing in designing, planning, developing, branding, expanding existing products and services, and acquiring new players to compete in the market.
- Atomic Mall
- A One Salasar Pvt. Ltd.
- Auction Network
- Auction Technology Group Plc
- AuctionZip LLC
- Biddingo.com
- Bonanza
- eBay Inc.
- eBid Ltd.
- eCRATER
- Goodwill Industries of Orange County
- Listia Inc.
- OnlineAuction.com
- PropertyRoom.com Inc.
- SJH-All Plant Group Ltd.
- Webstore.com
- To know about the vendor offerings - Click Now!
Product Outlook (Revenue, USD bn, 2021-2026)
- Collectibles - size and forecast 2021-2026
- Electronics - size and forecast 2021-2026
- Artistic goods - size and forecast 2021-2026
- Jewelry - size and forecast 2021-2026
- Others - size and forecast 2021-2026
Geography Outlook (Revenue, USD bn, 2021-2026)
- North America - size and forecast 2021-2026
- Europe - size and forecast 2021-2026
- APAC - size and forecast 2021-2026
- South America - size and forecast 2021-2026
- The Middle East and Africa - size and forecast 2021-2026
To know about the market contribution of each segment - Grab an exclusive Report
- The money transfer agencies' market share is expected to increase to USD 13.89 billion from 2021 to 2026, and the market's growth momentum will accelerate at a CAGR of 10.34%.
- The debt financing market share is expected to increase to USD 16.17 billion from 2021 to 2026, and the market's growth momentum will accelerate at a CAGR of 9.66%.
Online Auction Market Scope | |
Report Coverage | Details |
Page number | 120 |
Base year | 2021 |
Forecast period | 2022-2026 |
Growth momentum & CAGR | Accelerate at a CAGR of 9.7% |
Market growth 2022-2026 | USD 1.90 billion |
Market structure | Fragmented |
YoY growth (%) | 8.07 |
Performing market contribution | North America at 41% |
Competitive landscape | Leading companies, competitive strategies, consumer engagement scope |
Companies profiled | Atomic Mall, A One Salasar Pvt. Ltd., Auction Network, Auction Technology Group Plc, AuctionZip LLC, Biddingo.com, Bonanza, eBay Inc., eBid Ltd., eCRATER, Goodwill Industries of Orange County, Listia Inc., OnlineAuction.com, PropertyRoom.com Inc., SJH-All Plant Group Ltd., and Webstore.com |
Market Dynamics | Parent market analysis, Market growth inducers and obstacles, Fast-growing and slow-growing segment analysis, COVID 19 impact and future consumer dynamics, market condition analysis for the forecast period, |
Customization purview | If our report has not included the data you are looking for, you can reach out to our analysts and get customized segments. |
1 Executive Summary
- 1.1 Market overview
- Exhibit 01: Executive Summary – Chart on Market Overview
- Exhibit 02: Executive Summary – Data Table on Market Overview
- Exhibit 03: Executive Summary – Chart on Global Market Characteristics
- Exhibit 04: Executive Summary – Chart on Market by Geography
- Exhibit 05: Executive Summary – Chart on Market Segmentation by Product
- Exhibit 06: Executive Summary – Chart on Incremental Growth
- Exhibit 07: Executive Summary – Data Table on Incremental Growth
- Exhibit 08: Executive Summary – Chart on Vendor Market Positioning
2 Market Landscape
- 2.1 Market ecosystem
- Exhibit 09: Parent market
- Exhibit 10: Market Characteristics
3 Market Sizing
- 3.1 Market definition
- Exhibit 11: Offerings of vendors included in the market definition
- 3.2 Market segment analysis
- Exhibit 12: Market segments
- 3.3 Market size 2021
- 3.4 Market outlook: Forecast for 2021-2026
- Exhibit 13: Chart on Global - Market size and forecast 2021-2026 ($ million)
- Exhibit 14: Data Table on Global - Market size and forecast 2021-2026 ($ million)
- Exhibit 15: Chart on Global Market: Year-over-year growth 2021-2026 (%)
- Exhibit 16: Data Table on Global Market: Year-over-year growth 2021-2026 (%)
4 Five Forces Analysis
- 4.1 Five forces summary
- Exhibit 17: Five forces analysis - Comparison between 2021 and 2026
- 4.2 Bargaining power of buyers
- Exhibit 18: Bargaining power of buyers – Impact of key factors in 2021 and 2026
- 4.3 Bargaining power of suppliers
- Exhibit 19: Bargaining power of suppliers – Impact of key factors in 2021 and 2026
- 4.4 Threat of new entrants
- Exhibit 20: Threat of new entrants – Impact of key factors in 2021 and 2026
- 4.5 Threat of substitutes
- Exhibit 21: Threat of substitutes – Impact of key factors in 2021 and 2026
- 4.6 Threat of rivalry
- Exhibit 22: Threat of rivalry – Impact of key factors in 2021 and 2026
- 4.7 Market condition
- Exhibit 23: Chart on Market condition - Five forces 2021 and 2026
5 Market Segmentation by Product
- 5.1 Market segments
- Exhibit 24: Chart on Product - Market share 2021-2026 (%)
- Exhibit 25: Data Table on Product - Market share 2021-2026 (%)
- 5.2 Comparison by Product
- Exhibit 26: Chart on Comparison by Product
- Exhibit 27: Data Table on Comparison by Product
- 5.3 Collectibles - Market size and forecast 2021-2026
- Exhibit 28: Chart on Collectibles - Market size and forecast 2021-2026 ($ million)
- Exhibit 29: Data Table on Collectibles - Market size and forecast 2021-2026 ($ million)
- Exhibit 30: Chart on Collectibles - Year-over-year growth 2021-2026 (%)
- Exhibit 31: Data Table on Collectibles - Year-over-year growth 2021-2026 (%)
- 5.4 Electronics - Market size and forecast 2021-2026
- Exhibit 32: Chart on Electronics - Market size and forecast 2021-2026 ($ million)
- Exhibit 33: Data Table on Electronics - Market size and forecast 2021-2026 ($ million)
- Exhibit 34: Chart on Electronics - Year-over-year growth 2021-2026 (%)
- Exhibit 35: Data Table on Electronics - Year-over-year growth 2021-2026 (%)
- 5.5 Artistic goods - Market size and forecast 2021-2026
- Exhibit 36: Chart on Artistic goods - Market size and forecast 2021-2026 ($ million)
- Exhibit 37: Data Table on Artistic goods - Market size and forecast 2021-2026 ($ million)
- Exhibit 38: Chart on Artistic goods - Year-over-year growth 2021-2026 (%)
- Exhibit 39: Data Table on Artistic goods - Year-over-year growth 2021-2026 (%)
- 5.6 Jewelry - Market size and forecast 2021-2026
- Exhibit 40: Chart on Jewelry - Market size and forecast 2021-2026 ($ million)
- Exhibit 41: Data Table on Jewelry - Market size and forecast 2021-2026 ($ million)
- Exhibit 42: Chart on Jewelry - Year-over-year growth 2021-2026 (%)
- Exhibit 43: Data Table on Jewelry - Year-over-year growth 2021-2026 (%)
- 5.7 Others - Market size and forecast 2021-2026
- Exhibit 44: Chart on Others - Market size and forecast 2021-2026 ($ million)
- Exhibit 45: Data Table on Others - Market size and forecast 2021-2026 ($ million)
- Exhibit 46: Chart on Others - Year-over-year growth 2021-2026 (%)
- Exhibit 47: Data Table on Others - Year-over-year growth 2021-2026 (%)
- 5.8 Market opportunity by Product
- Exhibit 48: Market opportunity by Product ($ million)
6 Customer Landscape
- 6.1 Customer landscape overview
- Exhibit 49: Analysis of price sensitivity, lifecycle, customer purchase basket, adoption rates, and purchase criteria
7 Geographic Landscape
- 7.1 Geographic segmentation
- Exhibit 50: Chart on Market share by geography 2021-2026 (%)
- Exhibit 51: Data Table on Market share by geography 2021-2026 (%)
- 7.2 Geographic comparison
- Exhibit 52: Chart on Geographic comparison
- Exhibit 53: Data Table on Geographic comparison
- 7.3 North America - Market size and forecast 2021-2026
- Exhibit 54: Chart on North America - Market size and forecast 2021-2026 ($ million)
- Exhibit 55: Data Table on North America - Market size and forecast 2021-2026 ($ million)
- Exhibit 56: Chart on North America - Year-over-year growth 2021-2026 (%)
- Exhibit 57: Data Table on North America - Year-over-year growth 2021-2026 (%)
- 7.4 Europe - Market size and forecast 2021-2026
- Exhibit 58: Chart on Europe - Market size and forecast 2021-2026 ($ million)
- Exhibit 59: Data Table on Europe - Market size and forecast 2021-2026 ($ million)
- Exhibit 60: Chart on Europe - Year-over-year growth 2021-2026 (%)
- Exhibit 61: Data Table on Europe - Year-over-year growth 2021-2026 (%)
- 7.5 APAC - Market size and forecast 2021-2026
- Exhibit 62: Chart on APAC - Market size and forecast 2021-2026 ($ million)
- Exhibit 63: Data Table on APAC - Market size and forecast 2021-2026 ($ million)
- Exhibit 64: Chart on APAC - Year-over-year growth 2021-2026 (%)
- Exhibit 65: Data Table on APAC - Year-over-year growth 2021-2026 (%)
- 7.6 South America - Market size and forecast 2021-2026
- Exhibit 66: Chart on South America - Market size and forecast 2021-2026 ($ million)
- Exhibit 67: Data Table on South America - Market size and forecast 2021-2026 ($ million)
- Exhibit 68: Chart on South America - Year-over-year growth 2021-2026 (%)
- Exhibit 69: Data Table on South America - Year-over-year growth 2021-2026 (%)
- 7.7 Middle East and Africa - Market size and forecast 2021-2026
- Exhibit 70: Chart on Middle East and Africa - Market size and forecast 2021-2026 ($ million)
- Exhibit 71: Data Table on Middle East and Africa - Market size and forecast 2021-2026 ($ million)
- Exhibit 72: Chart on Middle East and Africa - Year-over-year growth 2021-2026 (%)
- Exhibit 73: Data Table on Middle East and Africa - Year-over-year growth 2021-2026 (%)
- 7.8 US - Market size and forecast 2021-2026
- Exhibit 74: Chart on US - Market size and forecast 2021-2026 ($ million)
- Exhibit 75: Data Table on US - Market size and forecast 2021-2026 ($ million)
- Exhibit 76: Chart on US - Year-over-year growth 2021-2026 (%)
- Exhibit 77: Data Table on US - Year-over-year growth 2021-2026 (%)
- 7.9 China - Market size and forecast 2021-2026
- Exhibit 78: Chart on China - Market size and forecast 2021-2026 ($ million)
- Exhibit 79: Data Table on China - Market size and forecast 2021-2026 ($ million)
- Exhibit 80: Chart on China - Year-over-year growth 2021-2026 (%)
- Exhibit 81: Data Table on China - Year-over-year growth 2021-2026 (%)
- 7.10 UK - Market size and forecast 2021-2026
- Exhibit 82: Chart on UK - Market size and forecast 2021-2026 ($ million)
- Exhibit 83: Data Table on UK - Market size and forecast 2021-2026 ($ million)
- Exhibit 84: Chart on UK - Year-over-year growth 2021-2026 (%)
- Exhibit 85: Data Table on UK - Year-over-year growth 2021-2026 (%)
- 7.11 France - Market size and forecast 2021-2026
- Exhibit 86: Chart on France - Market size and forecast 2021-2026 ($ million)
- Exhibit 87: Data Table on France - Market size and forecast 2021-2026 ($ million)
- Exhibit 88: Chart on France - Year-over-year growth 2021-2026 (%)
- Exhibit 89: Data Table on France - Year-over-year growth 2021-2026 (%)
- 7.12 Japan - Market size and forecast 2021-2026
- Exhibit 90: Chart on Japan - Market size and forecast 2021-2026 ($ million)
- Exhibit 91: Data Table on Japan - Market size and forecast 2021-2026 ($ million)
- Exhibit 92: Chart on Japan - Year-over-year growth 2021-2026 (%)
- Exhibit 93: Data Table on Japan - Year-over-year growth 2021-2026 (%)
- 7.13 Market opportunity by geography
- Exhibit 94: Market opportunity by geography ($ million)
8 Drivers, Challenges, and Trends
- 8.1 Market drivers
- 8.2 Market challenges
- 8.3 Impact of drivers and challenges
- Exhibit 95: Impact of drivers and challenges in 2021 and 2026
- 8.4 Market trends
9 Vendor Landscape
- 9.1 Overview
- 9.2 Vendor landscape
- Exhibit 96: Overview on Criticality of inputs and Factors of differentiation
- 9.3 Landscape disruption
- Exhibit 97: Overview on factors of disruption
- 9.4 Industry risks
- Exhibit 98: Impact of key risks on business
10 Vendor Analysis
- 10.1 Vendors covered
- Exhibit 99: Vendors covered
- 10.2 Market positioning of vendors
- Exhibit 100: Matrix on vendor position and classification
- 10.3 Atomic Mall
- Exhibit 101: Atomic Mall - Overview
- Exhibit 102: Atomic Mall - Product / Service
- Exhibit 103: Atomic Mall - Key offerings
- 10.4 AuctionZip LLC
- Exhibit 104: AuctionZip LLC - Overview
- Exhibit 105: AuctionZip LLC - Product / Service
- Exhibit 106: AuctionZip LLC - Key offerings
- 10.5 Bonanza
- Exhibit 107: Bonanza - Overview
- Exhibit 108: Bonanza - Product / Service
- Exhibit 109: Bonanza - Key offerings
- 10.6 eBay Inc.
- Exhibit 110: eBay Inc. - Overview
- Exhibit 111: eBay Inc. - Business segments
- Exhibit 112: eBay Inc. - Key news
- Exhibit 113: eBay Inc. - Key offerings
- Exhibit 114: eBay Inc. - Segment focus
- 10.7 eBid Ltd.
- Exhibit 115: eBid Ltd. - Overview
- Exhibit 116: eBid Ltd. - Product / Service
- Exhibit 117: eBid Ltd. - Key offerings
- 10.8 eCRATER
- Exhibit 118: eCRATER - Overview
- Exhibit 119: eCRATER - Product / Service
- Exhibit 120: eCRATER - Key offerings
- 10.9 Goodwill Industries of Orange County
- Exhibit 121: Goodwill Industries of Orange County - Overview
- Exhibit 122: Goodwill Industries of Orange County - Product / Service
- Exhibit 123: Goodwill Industries of Orange County - Key offerings
- 10.10 Listia Inc.
- Exhibit 124: Listia Inc. - Overview
- Exhibit 125: Listia Inc. - Product / Service
- Exhibit 126: Listia Inc. - Key offerings
- 10.11 OnlineAuction.com
- Exhibit 127: OnlineAuction.com - Overview
- Exhibit 128: OnlineAuction.com - Product / Service
- Exhibit 129: OnlineAuction.com - Key offerings
- 10.12 PropertyRoom.com Inc.
- Exhibit 130: PropertyRoom.com Inc. - Overview
- Exhibit 131: PropertyRoom.com Inc. - Product / Service
- Exhibit 132: PropertyRoom.com Inc. - Key offerings
11 Appendix
- 11.1 Scope of the report
- 11.2 Inclusions and exclusions checklist
- Exhibit 133: Inclusions checklist
- Exhibit 134: Exclusions checklist
- 11.3 Currency conversion rates for US$
- Exhibit 135: Currency conversion rates for US$
- 11.4 Research methodology
- Exhibit 136: Research methodology
- Exhibit 137: Validation techniques employed for market sizing
- Exhibit 138: Information sources
- 11.5 List of abbreviations
- Exhibit 139: List of abbreviations
Technavio is a leading global technology research and advisory company. Their research and analysis focuses on emerging market trends and provide actionable insights to help businesses identify market opportunities and develop effective strategies to optimize their market positions.
With over 500 specialized analysts, Technavio's report library consists of more than 17,000 reports and counting, cover ing 800 technologies, spanning 50 countries. Their client base consists of enterprises of all sizes, including more than 100 Fortune 500 companies. This growing client base relies on Technavio's comprehensive coverage, extensive research, and actionable market insights to identify opportunities in existing and potential markets and assess their competitive positions within changing market scenarios.
Technavio Research
Jesse Maida
Media & Marketing Executive
US: +1 844 364 1100
UK: +44 203 893 3200
Email: media@technavio.com
Website: www.technavio.com/


SOURCE Technavio
© 2024 Benzinga.com. Benzinga does not provide investment advice. All rights reserved.
Trade confidently with insights and alerts from analyst ratings, free reports and breaking news that affects the stocks you care about.

