


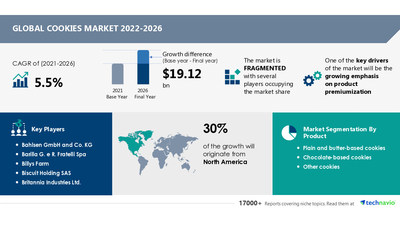
NEW YORK, July 5, 2022 /PRNewswire/ -- The "Cookies Market by Product and Geography - Forecast and Analysis 2022-2026" report has been added to Technavio's offering. According to the report, the market will observe an incremental growth of USD 19.12 billion between 2021 and 2026, expanding at a CAGR of 5.5% during the forecast period. The market will observe significant growth in North America. The growing consumer demand for innovative offerings and the presence of a strong consumer base is creating several growth opportunities for vendors operating in the region.

Read Our Report Sample for highlights on the market size, regional growth opportunities, and much more.
Market Dynamics
The market is driven by the growing emphasis on product premiumization. The growth of the millennial population and the rise in disposable incomes of consumers have increased the demand for premium products. Also, the rising awareness about the benefits of following a healthy diet is increasing the average consumer spending on premium food products made of healthy ingredients. These factors are driving vendors in the market to offer a diverse range of cookies that include an element of premiumization in terms of branding, packaging, and positioning. They are also incorporating ingredients such as dry fruits, seeds, traditional grains, and nuts to differentiate and premiumize their cookies. Such efforts by vendors are expected to drive the growth of the global cookies market during the forecast period.
In addition, the rising popularity of clean labeled cookies is anticipated to boost the growth of the cookies market. However, the high energy costs for bakery processors and the lack of established retail distribution channels in developing countries such as India, Nigeria, and Brazil will challenge the growth of the market.
Major Vendors in the Cookies Market:
The global cookies market is highly fragmented due to the presence of several international and regional players. The well-established international and local vendors have a considerable competitive advantage due to factors such as brand loyalty, high investment capability, high product differentiation, and large scale of operations. These vendors differentiate their products predominantly on pricing and packaging aspects. The following are some of the key players identified in the market.
- Bahlsen GmbH and Co. KG
- Barilla G. e R. Fratelli Spa
- Billys Farm
- Biscuit Holding SAS
- Britannia Industries Ltd.
- Campbell Soup Co.
- Deweys Bakery Inc.
- Emmys Organics Inc.
- FUEL10K Ltd.
- General Mills Inc.
- ITC Ltd.
- Kellogg Co.
- Mayora Group
- Mondelez International Inc.
- Parle Products Pvt. Ltd.
- PepsiCo Inc.
- Starbucks Co.
- The Hershey Co.
- UNIBIC Foods India Pvt. Ltd.
- Yildiz Holding AS
View Report Sample for more insights into the vendor landscape and the factors impacting growth.
Cookies Market Product Outlook (Revenue, USD Billion, 2021-2026)
- Plain and butter-based cookies - size and forecast 2021-2026
- Chocolate-based cookies - size and forecast 2021-2026
- Other cookies - size and forecast 2021-2026
The plain and butter-based cookies segment generated maximum revenue in the market in 2021. The demand for these cookies is high across the world, especially in countries such as China, India, and the UK. They are consumed as complimentary snacks with hot beverages, including tea and coffee. The market growth in the segment will be significant over the forecast period.
Cookies Market Geography Outlook (Revenue, USD Billion, 2021-2026)
- North America - size and forecast 2021-2026
- APAC - size and forecast 2021-2026
- Europe - size and forecast 2021-2026
- South America - size and forecast 2021-2026
- Middle East and Africa - size and forecast 2021-2026
The market will observe maximum growth in North America. About 30% of the overall market growth is expected to originate from this region. The availability of a wide range of flavored cookies and increasing health awareness are driving the growth of the regional market.
Technavio's sample reports are free of charge and contain multiple sections of the report, such as the market size and forecast, drivers, challenges, trends, and more.
Related Reports:
- Frozen Bakery Products Market by Product and Geography - Forecast and Analysis 2022-2026
- Vegan Food Market by Product and Geography - Forecast and Analysis 2022-2026
Cookies Market Scope | |
Report Coverage | Details |
Page number | 120 |
Base year | 2021 |
Forecast period | 2022-2026 |
Growth momentum & CAGR | Accelerate at a CAGR of 5.5% |
Market growth 2022-2026 | USD 19.12 billion |
Market structure | Fragmented |
YoY growth (%) | 4.89 |
Regional analysis | North America, APAC, Europe, South America, and Middle East and Africa |
Performing market contribution | North America at 30% |
Key consumer countries | US, Canada, China, India, and Germany |
Competitive landscape | Leading companies, competitive strategies, consumer engagement scope |
Companies profiled | Bahlsen GmbH and Co. KG, Barilla G. e R. Fratelli Spa, Billys Farm, Biscuit Holding SAS, Britannia Industries Ltd., Campbell Soup Co., Deweys Bakery Inc., Emmys Organics Inc., FUEL10K Ltd., General Mills Inc., ITC Ltd., Kellogg Co., Mayora Group, Mondelez International Inc., Parle Products Pvt. Ltd., PepsiCo Inc., Starbucks Co., The Hershey Co., UNIBIC Foods India Pvt. Ltd., and Yildiz Holding AS |
Market Dynamics | Parent market analysis, Market growth inducers and obstacles, Fast-growing and slow-growing segment analysis, COVID 19 impact and future consumer dynamics, market condition analysis for forecast period. |
Customization purview | If our report has not included the data that you are looking for, you can reach out to our analysts and get segments customized. |
Table of Contents:
1 Executive Summary
- 1.1 Market overview
- Exhibit 01: Executive Summary – Chart on Market Overview
- Exhibit 02: Executive Summary – Data Table on Market Overview
- Exhibit 03: Executive Summary – Chart on Global Market Characteristics
- Exhibit 04: Executive Summary – Chart on Market by Geography
- Exhibit 05: Executive Summary – Chart on Market Segmentation by Product
- Exhibit 06: Executive Summary – Chart on Incremental Growth
- Exhibit 07: Executive Summary – Data Table on Incremental Growth
- Exhibit 08: Executive Summary – Chart on Vendor Market Positioning
2 Market Landscape
- 2.1 Market ecosystem
- Exhibit 09: Parent market
- Exhibit 10: Market Characteristics
3 Market Sizing
- 3.1 Market definition
- Exhibit 11: Offerings of vendors included in the market definition
- 3.2 Market segment analysis
- Exhibit 12: Market segments
- 3.3 Market size 2021
- 3.4 Market outlook: Forecast for 2021-2026
- Exhibit 13: Chart on Global - Market size and forecast 2021-2026 ($ billion)
- Exhibit 14: Data Table on Global - Market size and forecast 2021-2026 ($ billion)
- Exhibit 15: Chart on Global Market: Year-over-year growth 2021-2026 (%)
- Exhibit 16: Data Table on Global Market: Year-over-year growth 2021-2026 (%)
4 Five Forces Analysis
- 4.1 Five forces summary
- Exhibit 17: Five forces analysis - Comparison between 2021 and 2026
- 4.2 Bargaining power of buyers
- Exhibit 18: Chart on Bargaining power of buyers – Impact of key factors 2021 and 2026
- 4.3 Bargaining power of suppliers
- Exhibit 19: Bargaining power of suppliers – Impact of key factors in 2021 and 2026
- 4.4 Threat of new entrants
- Exhibit 20: Threat of new entrants – Impact of key factors in 2021 and 2026
- 4.5 Threat of substitutes
- Exhibit 21: Threat of substitutes – Impact of key factors in 2021 and 2026
- 4.6 Threat of rivalry
- Exhibit 22: Threat of rivalry – Impact of key factors in 2021 and 2026
- 4.7 Market condition
- Exhibit 23: Chart on Market condition - Five forces 2021 and 2026
5 Market Segmentation by Product
- 5.1 Market segments
- Exhibit 24: Chart on Product - Market share 2021-2026 (%)
- Exhibit 25: Data Table on Product - Market share 2021-2026 (%)
- 5.2 Comparison by Product
- Exhibit 26: Chart on Comparison by Product
- Exhibit 27: Data Table on Comparison by Product
- 5.3 Plain and butter-based cookies - Market size and forecast 2021-2026
- Exhibit 28: Chart on Plain and butter-based cookies - Market size and forecast 2021-2026 ($ billion)
- Exhibit 29: Data Table on Plain and butter-based cookies - Market size and forecast 2021-2026 ($ billion)
- Exhibit 30: Chart on Plain and butter-based cookies - Year-over-year growth 2021-2026 (%)
- Exhibit 31: Data Table on Plain and butter-based cookies - Year-over-year growth 2021-2026 (%)
- 5.4 Chocolate-based cookies - Market size and forecast 2021-2026
- Exhibit 32: Chart on Chocolate-based cookies - Market size and forecast 2021-2026 ($ billion)
- Exhibit 33: Data Table on Chocolate-based cookies - Market size and forecast 2021-2026 ($ billion)
- Exhibit 34: Chart on Chocolate-based cookies - Year-over-year growth 2021-2026 (%)
- Exhibit 35: Data Table on Chocolate-based cookies - Year-over-year growth 2021-2026 (%)
- 5.5 Other cookies - Market size and forecast 2021-2026
- Exhibit 36: Chart on Other cookies - Market size and forecast 2021-2026 ($ billion)
- Exhibit 37: Data Table on Other cookies - Market size and forecast 2021-2026 ($ billion)
- Exhibit 38: Chart on Other cookies - Year-over-year growth 2021-2026 (%)
- Exhibit 39: Data Table on Other cookies - Year-over-year growth 2021-2026 (%)
- 5.6 Market opportunity by Product
- Exhibit 40: Market opportunity by Product ($ billion)
6 Customer Landscape
- 6.1 Customer landscape overview
- Exhibit 41: Analysis of price sensitivity, lifecycle, customer purchase basket, adoption rates, and purchase criteria
7 Geographic Landscape
- 7.1 Geographic segmentation
- Exhibit 42: Chart on Market share by geography 2021-2026 (%)
- Exhibit 43: Data Table on Market share by geography 2021-2026 (%)
- 7.2 Geographic comparison
- Exhibit 44: Chart on Geographic comparison
- Exhibit 45: Data Table on Geographic comparison
- 7.3 North America - Market size and forecast 2021-2026
- Exhibit 46: Chart on North America - Market size and forecast 2021-2026 ($ billion)
- Exhibit 47: Data Table on North America - Market size and forecast 2021-2026 ($ billion)
- Exhibit 48: Chart on North America - Year-over-year growth 2021-2026 (%)
- Exhibit 49: Data Table on North America - Year-over-year growth 2021-2026 (%)
- 7.4 APAC - Market size and forecast 2021-2026
- Exhibit 50: Chart on APAC - Market size and forecast 2021-2026 ($ billion)
- Exhibit 51: Data Table on APAC - Market size and forecast 2021-2026 ($ billion)
- Exhibit 52: Chart on APAC - Year-over-year growth 2021-2026 (%)
- Exhibit 53: Data Table on APAC - Year-over-year growth 2021-2026 (%)
- 7.5 Europe - Market size and forecast 2021-2026
- Exhibit 54: Chart on Europe - Market size and forecast 2021-2026 ($ billion)
- Exhibit 55: Data Table on Europe - Market size and forecast 2021-2026 ($ billion)
- Exhibit 56: Chart on Europe - Year-over-year growth 2021-2026 (%)
- Exhibit 57: Data Table on Europe - Year-over-year growth 2021-2026 (%)
- 7.6 South America - Market size and forecast 2021-2026
- Exhibit 58: Chart on South America - Market size and forecast 2021-2026 ($ billion)
- Exhibit 59: Data Table on South America - Market size and forecast 2021-2026 ($ billion)
- Exhibit 60: Chart on South America - Year-over-year growth 2021-2026 (%)
- Exhibit 61: Data Table on South America - Year-over-year growth 2021-2026 (%)
- 7.7 Middle East and Africa - Market size and forecast 2021-2026
- Exhibit 62: Chart on Middle East and Africa - Market size and forecast 2021-2026 ($ billion)
- Exhibit 63: Data Table on Middle East and Africa - Market size and forecast 2021-2026 ($ billion)
- Exhibit 64: Chart on Middle East and Africa - Year-over-year growth 2021-2026 (%)
- Exhibit 65: Data Table on Middle East and Africa - Year-over-year growth 2021-2026 (%)
- 7.8 US - Market size and forecast 2021-2026
- Exhibit 66: Chart on US - Market size and forecast 2021-2026 ($ billion)
- Exhibit 67: Data Table on US - Market size and forecast 2021-2026 ($ billion)
- Exhibit 68: Chart on US - Year-over-year growth 2021-2026 (%)
- Exhibit 69: Data Table on US - Year-over-year growth 2021-2026 (%)
- 7.9 China - Market size and forecast 2021-2026
- Exhibit 70: Chart on China - Market size and forecast 2021-2026 ($ billion)
- Exhibit 71: Data Table on China - Market size and forecast 2021-2026 ($ billion)
- Exhibit 72: Chart on China - Year-over-year growth 2021-2026 (%)
- Exhibit 73: Data Table on China - Year-over-year growth 2021-2026 (%)
- 7.10 Germany - Market size and forecast 2021-2026
- Exhibit 74: Chart on Germany - Market size and forecast 2021-2026 ($ billion)
- Exhibit 75: Data Table on Germany - Market size and forecast 2021-2026 ($ billion)
- Exhibit 76: Chart on Germany - Year-over-year growth 2021-2026 (%)
- Exhibit 77: Data Table on Germany - Year-over-year growth 2021-2026 (%)
- 7.11 Canada - Market size and forecast 2021-2026
- Exhibit 78: Chart on Canada - Market size and forecast 2021-2026 ($ billion)
- Exhibit 79: Data Table on Canada - Market size and forecast 2021-2026 ($ billion)
- Exhibit 80: Chart on Canada - Year-over-year growth 2021-2026 (%)
- Exhibit 81: Data Table on Canada - Year-over-year growth 2021-2026 (%)
- 7.12 India - Market size and forecast 2021-2026
- Exhibit 82: Chart on India - Market size and forecast 2021-2026 ($ billion)
- Exhibit 83: Data Table on India - Market size and forecast 2021-2026 ($ billion)
- Exhibit 84: Chart on India - Year-over-year growth 2021-2026 (%)
- Exhibit 85: Data Table on India - Year-over-year growth 2021-2026 (%)
- 7.13 Market opportunity by geography
- Exhibit 86: Market opportunity by geography ($ billion)
8 Drivers, Challenges, and Trends
- 8.1 Market drivers
- 8.2 Market challenges
- 8.3 Impact of drivers and challenges
- Exhibit 87: Impact of drivers and challenges in 2021 and 2026
- 8.4 Market trends
9 Vendor Landscape
- 9.1 Overview
- 9.2 Vendor landscape
- Exhibit 88: Overview on Criticality of inputs and Factors of differentiation
- 9.3 Landscape disruption
- Exhibit 89: Overview on factors of disruption
- 9.4 Industry risks
- Exhibit 90: Impact of key risks on business
10 Vendor Analysis
- 10.1 Vendors covered
- Exhibit 91: Vendors covered
- 10.2 Market positioning of vendors
- Exhibit 92: Matrix on vendor position and classification
- 10.3 Barilla G. e R. Fratelli Spa
- Exhibit 93: Barilla G. e R. Fratelli Spa - Overview
- Exhibit 94: Barilla G. e R. Fratelli Spa - Business segments
- Exhibit 95: Barilla G. e R. Fratelli Spa - Key offerings
- Exhibit 96: Barilla G. e R. Fratelli Spa - Segment focus
- 10.4 Britannia Industries Ltd.
- Exhibit 97: Britannia Industries Ltd. - Overview
- Exhibit 98: Britannia Industries Ltd. - Product / Service
- Exhibit 99: Britannia Industries Ltd. - Key offerings
- 10.5 Campbell Soup Co.
- Exhibit 100: Campbell Soup Co. - Overview
- Exhibit 101: Campbell Soup Co. - Business segments
- Exhibit 102: Campbell Soup Co. - Key news
- Exhibit 103: Campbell Soup Co. - Key offerings
- Exhibit 104: Campbell Soup Co. - Segment focus
- 10.6 ITC Ltd.
- Exhibit 105: ITC Ltd. - Overview
- Exhibit 106: ITC Ltd. - Business segments
- Exhibit 107: ITC Ltd. - Key offerings
- Exhibit 108: ITC Ltd. - Segment focus
- 10.7 Kellogg Co.
- Exhibit 109: Kellogg Co. - Overview
- Exhibit 110: Kellogg Co. - Business segments
- Exhibit 111: Kellogg Co. - Key news
- Exhibit 112: Kellogg Co. - Key offerings
- Exhibit 113: Kellogg Co. - Segment focus
- 10.8 Mondelez International Inc.
- Exhibit 114: Mondelez International Inc. - Overview
- Exhibit 115: Mondelez International Inc. - Business segments
- Exhibit 116: Mondelez International Inc. - Key news
- Exhibit 117: Mondelez International Inc. - Key offerings
- Exhibit 118: Mondelez International Inc. - Segment focus
- 10.9 Parle Products Pvt. Ltd.
- Exhibit 119: Parle Products Pvt. Ltd. - Overview
- Exhibit 120: Parle Products Pvt. Ltd. - Product / Service
- Exhibit 121: Parle Products Pvt. Ltd. - Key offerings
- 10.10 PepsiCo Inc.
- Exhibit 122: PepsiCo Inc. - Overview
- Exhibit 123: PepsiCo Inc. - Business segments
- Exhibit 124: PepsiCo Inc. - Key news
- Exhibit 125: PepsiCo Inc. - Key offerings
- Exhibit 126: PepsiCo Inc. - Segment focus
- 10.11 Starbucks Co.
- Exhibit 127: Starbucks Co. - Overview
- Exhibit 128: Starbucks Co. - Business segments
- Exhibit 129: Starbucks Co. - Key news
- Exhibit 130: Starbucks Co. - Key offerings
- Exhibit 131: Starbucks Co. - Segment focus
- 10.12 The Hershey Co.
- Exhibit 132: The Hershey Co. - Overview
- Exhibit 133: The Hershey Co. - Business segments
- Exhibit 134: The Hershey Co. - Key news
- Exhibit 135: The Hershey Co. - Key offerings
- Exhibit 136: The Hershey Co. - Segment focus
11 Appendix
- 11.1 Scope of the report
- 11.2 Inclusions and exclusions checklist
- Exhibit 137: Inclusions checklist
- Exhibit 138: Exclusions checklist
- 11.3 Currency conversion rates for US$
- Exhibit 139: Currency conversion rates for US$
- 11.4 Research methodology
- Exhibit 140: Research methodology
- Exhibit 141: Validation techniques employed for market sizing
- Exhibit 142: Information sources
- 11.5 List of abbreviations
- Exhibit 143: List of abbreviations
About Technavio
Technavio is a leading global technology research and advisory company. Their research and analysis focus on emerging market trends and provides actionable insights to help businesses identify market opportunities and develop effective strategies to optimize their market positions.
With over 500 specialized analysts, Technavio's report library consists of more than 17,000 reports and counting, covering 800 technologies, spanning across 50 countries. Their client base consists of enterprises of all sizes, including more than 100 Fortune 500 companies. This growing client base relies on Technavio's comprehensive coverage, extensive research, and actionable market insights to identify opportunities in existing and potential markets and assess their competitive positions within changing market scenarios.
Contacts
Technavio Research
Jesse Maida
Media & Marketing Executive
US: +1 844 364 1100
UK: +44 203 893 3200
Email: media@technavio.com
Website: www.technavio.com/


SOURCE Technavio
© 2024 Benzinga.com. Benzinga does not provide investment advice. All rights reserved.
Trade confidently with insights and alerts from analyst ratings, free reports and breaking news that affects the stocks you care about.

