


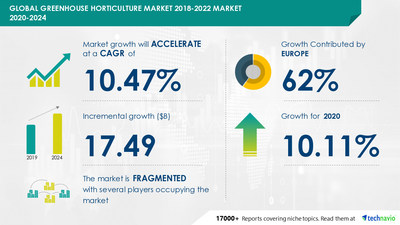
NEW YORK, June 21, 2022 /PRNewswire/ -- The greenhouse horticulture market share is expected to increase by USD 17.49 billion from 2020 to 2025, and the market's growth momentum will accelerate at a CAGR of 7.25%.

Learn more about factors influencing the market as you Get sample copy
The greenhouse horticulture market is categorized by Technavio as a part of the global building products market. The greenhouse horticulture market research report provides valuable insights on the post-pandemic impact on the market, which will help companies evaluate their business approaches.
The improvement in CO2 extraction technologies for greenhouses is driving the greenhouse horticulture market. CO2 is essential for plants to produce glucose during photosynthesis. The amount of CO2 available in the air is only 0.04% by volume. Greenhouses require additional CO2 for the plants to increase the yield along with proper ventilation. CO2 can be extracted from the air using different techniques. A recent technique called direct air capture captures CO2 directly from the atmosphere. The companies are developing advanced technology for the extraction of CO2. For instance, Climeworks has recently launched the world's first commercial plant for CO2 capture from the atmosphere. The plant aims to capture about 900 tons of CO2 per annum and distribute it to greenhouses for better vegetable cultivation. As CO2 becomes cheaper, farmers can pump it into their greenhouses to improve the yield, thus enhancing their margins.
View market report outlook to know more about factors driving the market
The high costs of greenhouses is expected to be a major hindrance to the greenhouse horticulture market during the forecast period. Building high-quality greenhouses for best yields requires high capital and operating expenses. Maintaining the characteristics of a greenhouse for desired plant growth requires a recurring expenditure on items such as plastic/glass roofing as well as climate control equipment such as fans, vents, heaters, and lighting systems. These will be treated as capital expenditure, which is a one-time expense. For instance, the average annual income of a farmer from a farm in the US was more than $23,700 and from other sources was about four times the farm income in 2018 according to the Farm Household Income and Characteristics research by the Economic Research Service of the USDA. On the other hand, the average cost of erecting a greenhouse varies from $5,000 to $25,000 for a low-end basic greenhouse or a high-end technology-equipped greenhouse. Although these can vary between regions, this shows that the annual farm income is comparable to constructing a greenhouse requiring substantial capital from a farmer.
The greenhouse horticulture market forecast report offers in-depth insights into key vendor profiles. The profiles include information on the production, sustainability, and prospects of the leading companies. For instance, Certhon, a leading vendor, designs and builds greenhouses, technical systems, and growth chambers for the international greenhouse horticulture sector.
The report identifies the following as the dominant vendors in the market:
- Certhon
- Dalsem Greenhouse Projects BV
- Netafim Ltd.
- Priva Holding BV
- Richel Group SAS
- Ridder Drive Systems BV
- Rough Brothers Inc
- Top Greenhouses Ltd.
- Van der Hoeven Horticultural Projects BV
Greenhouse Horticulture Market Scope | |
Report Coverage | Details |
Page number | 120 |
Base year | 2020 |
Forecast period | 2021-2025 |
Growth momentum & CAGR | Accelerate at a CAGR of 7.25% |
Market growth 2021-2025 | $ 9.41 billion |
Market structure | Fragmented |
YoY growth (%) | 4.35 |
Regional analysis | Europe, North America, APAC, MEA, and South America |
Performing market contribution | Europe at 56% |
Key consumer countries | US, The Netherlands, China, Germany, and Spain |
Competitive landscape | Leading companies, Competitive strategies, Consumer engagement scope |
Key companies profiled | Certhon, Dalsem Greenhouse Projects BV, Netafim Ltd., Priva Holding BV, Richel Group SAS, Ridder Drive Systems BV, Rough Brothers Inc, Top Greenhouses Ltd., and Van der Hoeven Horticultural Projects BV |
Market dynamics | Parent market analysis, Market growth inducers and obstacles, Fast-growing and slow-growing segment analysis, COVID 19 impact and recovery analysis and future consumer dynamics, Market condition analysis for forecast period |
Customization purview | If our report has not included the data that you are looking for, you can reach out to our analysts and get segments customized. |
Download report sample to unlock scope and parent market analysis insights
The increase in the number of greenhouse facilities, farm management, and the presence of many vendors is expected to propel the greenhouse horticulture market growth in Europe over the forecast period. The region is expected to contribute 62% of market growth as countries such as the Netherlands, Germany, and Spain are the key markets for greenhouse horticulture. Market growth in Europe is expected to be higher than the growth of the market in other regions.
Retrieve report sample and know more about the market contribution in Europe
The greenhouse horticulture market is divided by products into the plastic segment and glass segment. The plastic segment is expected to be the major contributor to the market during the forecast period. Plastic greenhouses are generally made from polycarbonate, polyethylene, acrylic, or fiberglass. Polycarbonates and acrylics are plastic materials that have high impact strength and protect crops from snow as well as hail. The downside of these materials is high combustibility resulting in higher insurance costs. Polyethylene transmits lesser light than glass and is resistant to the impact of hail. Such factors are expected to lead to the growth of the greenhouse horticulture market through this segment.
- CAGR of the market during the forecast period 2021-2025
- Accurate predictions on upcoming trends and changes in consumer behavior
- Detailed information on factors that will drive greenhouse horticulture market growth during the next five years
- Comprehensive details of factors that will challenge the growth of greenhouse horticulture market vendors
- A thorough analysis of the market's competitive landscape and detailed information on vendors
- Precise estimation of the greenhouse horticulture market size and its contribution to the parent market
- The growth of the greenhouse horticulture industry across Europe, North America, APAC, MEA, and South America
Single-Ply Membranes Market by Type and Geography - Forecast and Analysis 2022-2026 Download sample
Roofing Chemicals Market by Product and Geography - Forecast and Analysis 2022-2026 Download sample
1 Executive Summary
- 1.1 Market overview
- Exhibit 01: Executive Summary – Chart on Market Overview
- Exhibit 02: Executive Summary – Data Table on Market Overview
- Exhibit 03: Executive Summary – Chart on Global Market Characteristics
- Exhibit 04: Executive Summary – Chart on Market by Geography
- Exhibit 05: Executive Summary – Chart on Market Segmentation by Product
- Exhibit 06: Executive Summary – Chart on Incremental Growth
- Exhibit 07: Executive Summary – Data Table on Incremental Growth
- Exhibit 08: Executive Summary – Chart on Vendor Market Positioning
2 Market Landscape
- 2.1 Market ecosystem
- Exhibit 09: Parent market
- Exhibit 10: Market Characteristics
3 Market Sizing
- 3.1 Market definition
- Exhibit 11: Offerings of vendors included in the market definition
- 3.2 Market segment analysis
- Exhibit 12: Market segments
- 3.3 Market size 2021
- 3.4 Market outlook: Forecast for 2021-2026
- Exhibit 13: Chart on Global - Market size and forecast 2021-2026 ($ billion)
- Exhibit 14: Data Table on Global - Market size and forecast 2021-2026 ($ billion)
- Exhibit 15: Chart on Global Market: Year-over-year growth 2021-2026 (%)
- Exhibit 16: Data Table on Global Market: Year-over-year growth 2021-2026 (%)
4 Five Forces Analysis
- 4.1 Five forces summary
- Exhibit 17: Five forces analysis - Comparison between2021 and 2026
- 4.2 Bargaining power of buyers
- Exhibit 18: Chart on Bargaining power of buyers – Impact of key factors 2021 and 2026
- 4.3 Bargaining power of suppliers
- Exhibit 19: Bargaining power of suppliers – Impact of key factors in 2021 and 2026
- 4.4 Threat of new entrants
- Exhibit 20: Threat of new entrants – Impact of key factors in 2021 and 2026
- 4.5 Threat of substitutes
- Exhibit 21: Threat of substitutes – Impact of key factors in 2021 and 2026
- 4.6 Threat of rivalry
- Exhibit 22: Threat of rivalry – Impact of key factors in 2021 and 2026
- 4.7 Market condition
- Exhibit 23: Chart on Market condition - Five forces 2021 and 2026
5 Market Segmentation by Product
- 5.1 Market segments
- Exhibit 24: Chart on Product - Market share 2021-2026 (%)
- Exhibit 25: Data Table on Product - Market share 2021-2026 (%)
- 5.2 Comparison by Product
- Exhibit 26: Chart on Comparison by Product
- Exhibit 27: Data Table on Comparison by Product
- 5.3 Asphalt - Market size and forecast 2021-2026
- Exhibit 28: Chart on Asphalt - Market size and forecast 2021-2026 ($ billion)
- Exhibit 29: Data Table on Asphalt - Market size and forecast 2021-2026 ($ billion)
- Exhibit 30: Chart on Asphalt - Year-over-year growth 2021-2026 (%)
- Exhibit 31: Data Table on Asphalt - Year-over-year growth 2021-2026 (%)
- 5.4 Acrylic resin - Market size and forecast 2021-2026
- Exhibit 32: Chart on Acrylic resin - Market size and forecast 2021-2026 ($ billion)
- Exhibit 33: Data Table on Acrylic resin - Market size and forecast 2021-2026 ($ billion)
- Exhibit 34: Chart on Acrylic resin - Year-over-year growth 2021-2026 (%)
- Exhibit 35: Data Table on Acrylic resin - Year-over-year growth 2021-2026 (%)
- 5.5 Epoxy resin - Market size and forecast 2021-2026
- Exhibit 36: Chart on Epoxy resin - Market size and forecast 2021-2026 ($ billion)
- Exhibit 37: Data Table on Epoxy resin - Market size and forecast 2021-2026 ($ billion)
- Exhibit 38: Chart on Epoxy resin - Year-over-year growth 2021-2026 (%)
- Exhibit 39: Data Table on Epoxy resin - Year-over-year growth 2021-2026 (%)
- 5.6 Elastomer - Market size and forecast 2021-2026
- Exhibit 40: Chart on Elastomer - Market size and forecast 2021-2026 ($ billion)
- Exhibit 41: Data Table on Elastomer - Market size and forecast 2021-2026 ($ billion)
- Exhibit 42: Chart on Elastomer - Year-over-year growth 2021-2026 (%)
- Exhibit 43: Data Table on Elastomer - Year-over-year growth 2021-2026 (%)
- 5.7 Others - Market size and forecast 2021-2026
- Exhibit 44: Chart on Others - Market size and forecast 2021-2026 ($ billion)
- Exhibit 45: Data Table on Others - Market size and forecast 2021-2026 ($ billion)
- Exhibit 46: Chart on Others - Year-over-year growth 2021-2026 (%)
- Exhibit 47: Data Table on Others - Year-over-year growth 2021-2026 (%)
- 5.8 Market opportunity by Product
- Exhibit 48: Market opportunity by Product ($ billion)
6 Customer Landscape
- 6.1 Customer landscape overview
- Exhibit 49: Analysis of price sensitivity, lifecycle, customer purchase basket, adoption rates, and purchase criteria
7 Geographic Landscape
- 7.1 Geographic segmentation
- Exhibit 50: Chart on Market share by geography 2021-2026 (%)
- Exhibit 51: Data Table on Market share by geography 2021-2026 (%)
- 7.2 Geographic comparison
- Exhibit 52: Chart on Geographic comparison
- Exhibit 53: Data Table on Geographic comparison
- 7.3 APAC - Market size and forecast 2021-2026
- Exhibit 54: Chart on APAC - Market size and forecast 2021-2026 ($ billion)
- Exhibit 55: Data Table on APAC - Market size and forecast 2021-2026 ($ billion)
- Exhibit 56: Chart on APAC - Year-over-year growth 2021-2026 (%)
- Exhibit 57: Data Table on APAC - Year-over-year growth 2021-2026 (%)
- 7.4 North America - Market size and forecast 2021-2026
- Exhibit 58: Chart on North America - Market size and forecast 2021-2026 ($ billion)
- Exhibit 59: Data Table on North America - Market size and forecast 2021-2026 ($ billion)
- Exhibit 60: Chart on North America - Year-over-year growth 2021-2026 (%)
- Exhibit 61: Data Table on North America - Year-over-year growth 2021-2026 (%)
- 7.5 Europe - Market size and forecast 2021-2026
- Exhibit 62: Chart on Europe - Market size and forecast 2021-2026 ($ billion)
- Exhibit 63: Data Table on Europe - Market size and forecast 2021-2026 ($ billion)
- Exhibit 64: Chart on Europe - Year-over-year growth 2021-2026 (%)
- Exhibit 65: Data Table on Europe - Year-over-year growth 2021-2026 (%)
- 7.6 South America - Market size and forecast 2021-2026
- Exhibit 66: Chart on South America - Market size and forecast 2021-2026 ($ billion)
- Exhibit 67: Data Table on South America - Market size and forecast 2021-2026 ($ billion)
- Exhibit 68: Chart on South America - Year-over-year growth 2021-2026 (%)
- Exhibit 69: Data Table on South America - Year-over-year growth 2021-2026 (%)
- 7.7 Middle East and Africa - Market size and forecast 2021-2026
- Exhibit 70: Chart on Middle East and Africa - Market size and forecast 2021-2026 ($ billion)
- Exhibit 71: Data Table on Middle East and Africa - Market size and forecast 2021-2026 ($ billion)
- Exhibit 72: Chart on Middle East and Africa - Year-over-year growth 2021-2026 (%)
- Exhibit 73: Data Table on Middle East and Africa - Year-over-year growth 2021-2026 (%)
- 7.8 China - Market size and forecast 2021-2026
- Exhibit 74: Chart on China - Market size and forecast 2021-2026 ($ billion)
- Exhibit 75: Data Table on China - Market size and forecast 2021-2026 ($ billion)
- Exhibit 76: Chart on China - Year-over-year growth 2021-2026 (%)
- Exhibit 77: Data Table on China - Year-over-year growth 2021-2026 (%)
- 7.9 US - Market size and forecast 2021-2026
- Exhibit 78: Chart on US - Market size and forecast 2021-2026 ($ billion)
- Exhibit 79: Data Table on US - Market size and forecast 2021-2026 ($ billion)
- Exhibit 80: Chart on US - Year-over-year growth 2021-2026 (%)
- Exhibit 81: Data Table on US - Year-over-year growth 2021-2026 (%)
- 7.10 India - Market size and forecast 2021-2026
- Exhibit 82: Chart on India - Market size and forecast 2021-2026 ($ billion)
- Exhibit 83: Data Table on India - Market size and forecast 2021-2026 ($ billion)
- Exhibit 84: Chart on India - Year-over-year growth 2021-2026 (%)
- Exhibit 85: Data Table on India - Year-over-year growth 2021-2026 (%)
- 7.11 Germany - Market size and forecast 2021-2026
- Exhibit 86: Chart on Germany - Market size and forecast 2021-2026 ($ billion)
- Exhibit 87: Data Table on Germany - Market size and forecast 2021-2026 ($ billion)
- Exhibit 88: Chart on Germany - Year-over-year growth 2021-2026 (%)
- Exhibit 89: Data Table on Germany - Year-over-year growth 2021-2026 (%)
- 7.12 Canada - Market size and forecast 2021-2026
- Exhibit 90: Chart on Canada - Market size and forecast 2021-2026 ($ billion)
- Exhibit 91: Data Table on Canada - Market size and forecast 2021-2026 ($ billion)
- Exhibit 92: Chart on Canada - Year-over-year growth 2021-2026 (%)
- Exhibit 93: Data Table on Canada - Year-over-year growth 2021-2026 (%)
- 7.13 Market opportunity by geography
- Exhibit 94: Market opportunity by geography ($ billion)
8 Drivers, Challenges, and Trends
- 8.1 Market drivers
- 8.2 Market challenges
- 8.3 Impact of drivers and challenges
- Exhibit 95: Impact of drivers and challenges in 2021 and 2026
- 8.4 Market trends
9 Vendor Landscape
- 9.1 Overview
- 9.2 Vendor landscape
- Exhibit 96: Overview on Criticality of inputs and Factors of differentiation
- 9.3 Landscape disruption
- Exhibit 97: Overview on factors of disruption
- 9.4 Industry risks
- Exhibit 98: Impact of key risks on business
10 Vendor Analysis
- 10.1 Vendors covered
- Exhibit 99: Vendors covered
- 10.2 Market positioning of vendors
- Exhibit 100: Matrix on vendor position and classification
- 10.3 Akzo Nobel NV
- Exhibit 101: Akzo Nobel NV - Overview
- Exhibit 102: Akzo Nobel NV - Business segments
- Exhibit 103: Akzo Nobel NV - Key news
- Exhibit 104: Akzo Nobel NV - Key offerings
- Exhibit 105: Akzo Nobel NV - Segment focus
- 10.4 3M Corp.
- Exhibit 106: 3M Corp. - Overview
- Exhibit 107: 3M Corp. - Business segments
- Exhibit 108: 3M Corp. - Key news
- Exhibit 109: 3M Corp. - Key offerings
- Exhibit 110: 3M Corp. - Segment focus
- 10.5 Atlas Roofing Corp.
- Exhibit 111: Atlas Roofing Corp. - Overview
- Exhibit 112: Atlas Roofing Corp. - Product / Service
- Exhibit 113: Atlas Roofing Corp. - Key offerings
- 10.6 BASF SE
- Exhibit 114: BASF SE - Overview
- Exhibit 115: BASF SE - Business segments
- Exhibit 116: BASF SE - Key news
- Exhibit 117: BASF SE - Key offerings
- Exhibit 118: BASF SE - Segment focus
- 10.7 CICO Group
- Exhibit 119: CICO Group - Overview
- Exhibit 120: CICO Group - Product / Service
- Exhibit 121: CICO Group - Key offerings
- 10.8 Compagnie de Saint Gobain SA
- Exhibit 122: Compagnie de Saint Gobain SA - Overview
- Exhibit 123: Compagnie de Saint Gobain SA - Business segments
- Exhibit 124: Compagnie de Saint Gobain SA - Key news
- Exhibit 125: Compagnie de Saint Gobain SA - Key offerings
- Exhibit 126: Compagnie de Saint Gobain SA - Segment focus
- 10.9 DuPont de Nemours Inc.
- Exhibit 127: DuPont de Nemours Inc. - Overview
- Exhibit 128: DuPont de Nemours Inc. - Business segments
- Exhibit 129: DuPont de Nemours Inc. - Key offerings
- Exhibit 130: DuPont de Nemours Inc. - Segment focus
- 10.10 GAF Materials LLC
- Exhibit 131: GAF Materials LLC - Overview
- Exhibit 132: GAF Materials LLC - Product / Service
- Exhibit 133: GAF Materials LLC - Key offerings
- 10.11 Henry Co.
- Exhibit 134: Henry Co. - Overview
- Exhibit 135: Henry Co. - Product / Service
- Exhibit 136: Henry Co. - Key offerings
- 10.12 Sika AG
- Exhibit 137: Sika AG - Overview
- Exhibit 138: Sika AG - Business segments
- Exhibit 139: Sika AG - Key news
- Exhibit 140: Sika AG - Key offerings
- Exhibit 141: Sika AG - Segment focus
11 Appendix
- 11.1 Scope of the report
- 11.2 Inclusions and exclusions checklist
- Exhibit 142: Inclusions checklist
- Exhibit 143: Exclusions checklist
- 11.3 Currency conversion rates for US$
- Exhibit 144: Currency conversion rates for US$
- 11.4 Research methodology
- Exhibit 145: Research methodology
- Exhibit 146: Validation techniques employed for market sizing
- Exhibit 147: Information sources
- 11.5 List of abbreviations
- Exhibit 148: List of abbreviations
Technavio is a leading global technology research and advisory company. Their research and analysis focus on emerging market trends and provide actionable insights to help businesses identify market opportunities and develop effective strategies to optimize their market positions. With over 500 specialized analysts, Technavio's report library and its client base consist of enterprises of all sizes, including more than 100 Fortune 500 companies. This growing client base relies on Technavio's comprehensive coverage, extensive research, and actionable market insights to identify opportunities in existing and potential markets and assess their competitive positions within changing market scenarios.
Contact
Technavio Research
Jesse Maida
Media & Marketing Executive
US: +1 844 364 1100
UK: +44 203 893 3200
Email:media@technavio.com
Website: www.technavio.com/


SOURCE Technavio
© 2024 Benzinga.com. Benzinga does not provide investment advice. All rights reserved.
Trade confidently with insights and alerts from analyst ratings, free reports and breaking news that affects the stocks you care about.

