


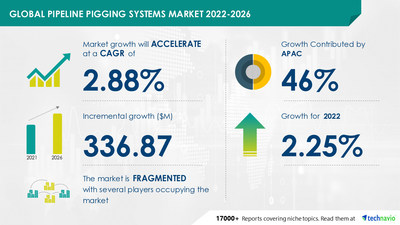
NEW YORK, June 8, 2022 /PRNewswire/ -- The Pipeline Pigging Systems Market size is expected to grow by USD 336.87 million at a CAGR of 2.88% during the forecast period, according to Technavio. The economic benefits of pipeline transportation are notably driving the pipeline pigging systems market growth.

This report extensively covers pipeline pigging systems market segmentation by the following:
- Application - Gas and oil
- Geography - APAC, North America, Europe, Middle East and Africa, and South America
The report offers an up-to-date analysis and to know the exact growth variance and the Y-O-Y growth rate Request a sample report.
The economic benefits of pipeline transportation, growing demand for oil and natural gas, and regulations that mandated frequent inspections of oil and gas pipelines will offer immense growth opportunities. Complexities associated with small-diameter pipelines and increasing pipeline sabotage will challenge the growth of the market participants.
To make the most of the opportunities, market vendors should focus more on the growth prospects in the fast-growing segments, while maintaining their positions in the slow-growing segments.
Download our Sample Report to know additional highlights and key points on various market segments and their impact in coming years.
Pipeline Pigging Systems Market: Segmentation
- Application
- Gas
- Oil
- Geographic
- APAC
- North America
- Europe
- Middle East And Africa
- South America
The gas segment's pipeline pigging systems market share will expand significantly. The increase can be linked to rising natural gas output around the world. Natural gas's expanding use and production is based on its environmental benefits over other fossil fuels, particularly in terms of GHG emissions. Increased government backing as a result of the change to a new source of clean energy has aided the market segment's growth tremendously.
Learn more about the additional trends impacting the future of the market and the positive and negative consequences on the businesses., download a free sample: https://www.technavio.com/talk-to-us?report=IRTNTR45065
Pipeline Pigging Systems Market: Scope
Technavio presents a detailed picture of the market by the way of study, synthesis, and summation of data from multiple sources. Our pipeline pigging systems market report covers the following areas:
- Pipeline Pigging Systems Market size
- Pipeline Pigging Systems Market trends
- Pipeline Pigging Systems Market industry analysis
This study identifies the development of intelligent pigs as one of the prime reasons driving the pipeline pigging systems market growth during the next few years.
Pipeline Pigging Systems Market: Vendor Analysis
The growing competition in the market is compelling vendors to adopt various growth strategies such as promotional activities and spending on advertisements to improve the visibility of their services. Some vendors are also adopting inorganic growth strategies such as M&As to remain competitive in the market. The report analyzes the market's competitive landscape and offers information on several market vendors, including:
- 3P Services GmbH and Co KG
- Aubin Ltd.
- Baker Hughes Co.
- CIRCOR International Inc.
- Dacon Inspection Technologies Co. Ltd.
- Diamond Edge Services
- Eddyfi NDT Inc.
- Enduro Pipeline Services Inc.
- GeoCorr LLC
- International Pipeline Products Ltd.
- Pigs Unlimited International LLC
- Pigtek Ltd
Find additional highlights on the growth strategies adopted by vendors and their product offerings, Download Sample Report.
Pipeline Pigging Systems Market: Key Highlights
- CAGR of the market during the forecast period 2022-2026
- Detailed information on factors that will assist pipeline pigging systems market growth during the next five years
- Estimation of the pipeline pigging systems market size and its contribution to the parent market
- Predictions on upcoming trends and changes in consumer behavior
- The growth of the pipeline pigging systems market
- Analysis of the market's competitive landscape and detailed information on vendors
- Comprehensive details of factors that will challenge the growth of pipeline pigging systems market vendors
Do reach out to our analysts for more customized reports as per your requirements. Speak to our Analyst now!
Related Reports:
Petroleum Sorbent Pads Market by End-user and Geography - Forecast and Analysis 2022-2026
Pipeline Pigging Systems Market Scope | |
Report Coverage | Details |
Page number | 120 |
Base year | 2021 |
Forecast period | 2022-2026 |
Growth momentum & CAGR | Accelerate at a CAGR of 2.88% |
Market growth 2022-2026 | $ 336.87 million |
Market structure | Fragmented |
YoY growth (%) | 2.25 |
Regional analysis | APAC, North America, Europe, Middle East and Africa, and South America |
Performing market contribution | APAC at 46% |
Key consumer countries | US, Canada, China, Russia, and UK |
Competitive landscape | Leading companies, Competitive strategies, Consumer engagement scope |
Key companies profiled | 3P Services GmbH and Co KG, Aubin Ltd., Baker Hughes Co., CIRCOR International Inc., Dacon Inspection Technologies Co. Ltd., Diamond Edge Services, Eddyfi NDT Inc., Enduro Pipeline Services Inc., GeoCorr LLC, International Pipeline Products Ltd., Pigs Unlimited International LLC, Pigtek Ltd, PIPECARE Group AG, Russell NDE Systems Inc., and T.D. Williamson Inc. |
Market dynamics | Parent market analysis, Market growth inducers and obstacles, Fast-growing and slow-growing segment analysis, COVID 19 impact and recovery analysis and future consumer dynamics, Market condition analysis for the forecast period |
Customization purview | If our report has not included the data that you are looking for, you can reach out to our analysts and get segments customized. |
Table Of Contents :
1 Executive Summary
- 1.1 Market overview
- Exhibit 01: Executive Summary – Chart on Market Overview
- Exhibit 02: Executive Summary – Data Table on Market Overview
- Exhibit 03: Executive Summary – Chart on Global Market Characteristics
- Exhibit 04: Executive Summary – Chart on Market by Geography
- Exhibit 05: Executive Summary – Chart on Market Segmentation by Application
- Exhibit 06: Executive Summary – Chart on Incremental Growth
- Exhibit 07: Executive Summary – Data Table on Incremental Growth
- Exhibit 08: Executive Summary – Chart on Vendor Market Positioning
2 Market Landscape
- 2.1 Market ecosystem
- Exhibit 09: Parent market
- Exhibit 10: Market Characteristics
3 Market Sizing
- 3.1 Market definition
- Exhibit 11: Offerings of vendors included in the market definition
- 3.2 Market segment analysis
- Exhibit 12: Market segments
- 3.3 Market size 2021
- 3.4 Market outlook: Forecast for 2021-2026
- Exhibit 13: Chart on Global - Market size and forecast 2021-2026 ($ million)
- Exhibit 14: Data Table on Global - Market size and forecast 2021-2026 ($ million)
- Exhibit 15: Chart on Global Market: Year-over-year growth 2021-2026 (%)
- Exhibit 16: Data Table on Global Market: Year-over-year growth 2021-2026 (%)
4 Five Forces Analysis
- 4.1 Five forces summary
- Exhibit 17: Five forces analysis - Comparison between 2021 and 2026
- 4.2 Bargaining power of buyers
- Exhibit 18: Chart on Bargaining power of buyers – Impact of key factors 2021 and 2026
- 4.3 Bargaining power of suppliers
- Exhibit 19: Bargaining power of suppliers – Impact of key factors in 2021 and 2026
- 4.4 Threat of new entrants
- Exhibit 20: Threat of new entrants – Impact of key factors in 2021 and 2026
- 4.5 Threat of substitutes
- Exhibit 21: Threat of substitutes – Impact of key factors in 2021 and 2026
- 4.6 Threat of rivalry
- Exhibit 22: Threat of rivalry – Impact of key factors in 2021 and 2026
- 4.7 Market condition
- Exhibit 23: Chart on Market condition - Five forces 2021 and 2026
5 Market Segmentation by Application
- 5.1 Market segments
- Exhibit 24: Chart on Application - Market share 2021-2026 (%)
- Exhibit 25: Data Table on Application - Market share 2021-2026 (%)
- 5.2 Comparison by Application
- Exhibit 26: Chart on Comparison by Application
- Exhibit 27: Data Table on Comparison by Application
- 5.3 Gas - Market size and forecast 2021-2026
- Exhibit 28: Chart on Gas - Market size and forecast 2021-2026 ($ million)
- Exhibit 29: Data Table on Gas - Market size and forecast 2021-2026 ($ million)
- Exhibit 30: Chart on Gas - Year-over-year growth 2021-2026 (%)
- Exhibit 31: Data Table on Gas - Year-over-year growth 2021-2026 (%)
- 5.4 Oil - Market size and forecast 2021-2026
- Exhibit 32: Chart on Oil - Market size and forecast 2021-2026 ($ million)
- Exhibit 33: Data Table on Oil - Market size and forecast 2021-2026 ($ million)
- Exhibit 34: Chart on Oil - Year-over-year growth 2021-2026 (%)
- Exhibit 35: Data Table on Oil - Year-over-year growth 2021-2026 (%)
- 5.5 Market opportunity by Application
- Exhibit 36: Market opportunity by Application ($ million)
6 Customer Landscape
- 6.1 Customer landscape overview
- Exhibit 37: Analysis of price sensitivity, lifecycle, customer purchase basket, adoption rates, and purchase criteria
7 Geographic Landscape
- 7.1 Geographic segmentation
- Exhibit 38: Chart on Market share by geography 2021-2026 (%)
- Exhibit 39: Data Table on Market share by geography 2021-2026 (%)
- 7.2 Geographic comparison
- Exhibit 40: Chart on Geographic comparison
- Exhibit 41: Data Table on Geographic comparison
- 7.3 APAC - Market size and forecast 2021-2026
- Exhibit 42: Chart on APAC - Market size and forecast 2021-2026 ($ million)
- Exhibit 43: Data Table on APAC - Market size and forecast 2021-2026 ($ million)
- Exhibit 44: Chart on APAC - Year-over-year growth 2021-2026 (%)
- Exhibit 45: Data Table on APAC - Year-over-year growth 2021-2026 (%)
- 7.4 North America - Market size and forecast 2021-2026
- Exhibit 46: Chart on North America - Market size and forecast 2021-2026 ($ million)
- Exhibit 47: Data Table on North America - Market size and forecast 2021-2026 ($ million)
- Exhibit 48: Chart on North America - Year-over-year growth 2021-2026 (%)
- Exhibit 49: Data Table on North America - Year-over-year growth 2021-2026 (%)
- 7.5 Europe - Market size and forecast 2021-2026
- Exhibit 50: Chart on Europe - Market size and forecast 2021-2026 ($ million)
- Exhibit 51: Data Table on Europe - Market size and forecast 2021-2026 ($ million)
- Exhibit 52: Chart on Europe - Year-over-year growth 2021-2026 (%)
- Exhibit 53: Data Table on Europe - Year-over-year growth 2021-2026 (%)
- 7.6 Middle East and Africa - Market size and forecast 2021-2026
- Exhibit 54: Chart on Middle East and Africa - Market size and forecast 2021-2026 ($ million)
- Exhibit 55: Data Table on Middle East and Africa - Market size and forecast 2021-2026 ($ million)
- Exhibit 56: Chart on Middle East and Africa - Year-over-year growth 2021-2026 (%)
- Exhibit 57: Data Table on Middle East and Africa - Year-over-year growth 2021-2026 (%)
- 7.7 South America - Market size and forecast 2021-2026
- Exhibit 58: Chart on South America - Market size and forecast 2021-2026 ($ million)
- Exhibit 59: Data Table on South America - Market size and forecast 2021-2026 ($ million)
- Exhibit 60: Chart on South America - Year-over-year growth 2021-2026 (%)
- Exhibit 61: Data Table on South America - Year-over-year growth 2021-2026 (%)
- 7.8 US - Market size and forecast 2021-2026
- Exhibit 62: Chart on US - Market size and forecast 2021-2026 ($ million)
- Exhibit 63: Data Table on US - Market size and forecast 2021-2026 ($ million)
- Exhibit 64: Chart on US - Year-over-year growth 2021-2026 (%)
- Exhibit 65: Data Table on US - Year-over-year growth 2021-2026 (%)
- 7.9 China - Market size and forecast 2021-2026
- Exhibit 66: Chart on China - Market size and forecast 2021-2026 ($ million)
- Exhibit 67: Data Table on China - Market size and forecast 2021-2026 ($ million)
- Exhibit 68: Chart on China - Year-over-year growth 2021-2026 (%)
- Exhibit 69: Data Table on China - Year-over-year growth 2021-2026 (%)
- 7.10 Russia - Market size and forecast 2021-2026
- Exhibit 70: Chart on Russia - Market size and forecast 2021-2026 ($ million)
- Exhibit 71: Data Table on Russia - Market size and forecast 2021-2026 ($ million)
- Exhibit 72: Chart on Russia - Year-over-year growth 2021-2026 (%)
- Exhibit 73: Data Table on Russia - Year-over-year growth 2021-2026 (%)
- 7.11 Canada - Market size and forecast 2021-2026
- Exhibit 74: Chart on Canada - Market size and forecast 2021-2026 ($ million)
- Exhibit 75: Data Table on Canada - Market size and forecast 2021-2026 ($ million)
- Exhibit 76: Chart on Canada - Year-over-year growth 2021-2026 (%)
- Exhibit 77: Data Table on Canada - Year-over-year growth 2021-2026 (%)
- 7.12 UK - Market size and forecast 2021-2026
- Exhibit 78: Chart on UK - Market size and forecast 2021-2026 ($ million)
- Exhibit 79: Data Table on UK - Market size and forecast 2021-2026 ($ million)
- Exhibit 80: Chart on UK - Year-over-year growth 2021-2026 (%)
- Exhibit 81: Data Table on UK - Year-over-year growth 2021-2026 (%)
- 7.13 Market opportunity by geography
- Exhibit 82: Market opportunity by geography ($ million)
8 Drivers, Challenges, and Trends
- 8.1 Market drivers
- 8.2 Market challenges
- 8.3 Impact of drivers and challenges
- Exhibit 83: Impact of drivers and challenges in 2021 and 2026
- 8.4 Market trends
9 Vendor Landscape
- 9.1 Overview
- 9.2 Vendor landscape
- Exhibit 84: Overview on Criticality of inputs and Factors of differentiation
- 9.3 Landscape disruption
- Exhibit 85: Overview on factors of disruption
- 9.4 Industry risks
- Exhibit 86: Impact of key risks on business
10 Vendor Analysis
- 10.1 Vendors covered
- Exhibit 87: Vendors covered
- 10.2 Market positioning of vendors
- Exhibit 88: Matrix on vendor position and classification
- 10.3 3P Services GmbH and Co KG
- Exhibit 89: 3P Services GmbH and Co KG - Overview
- Exhibit 90: 3P Services GmbH and Co KG - Product / Service
- Exhibit 91: 3P Services GmbH and Co KG - Key offerings
- 10.4 Baker Hughes Co.
- Exhibit 92: Baker Hughes Co. - Overview
- Exhibit 93: Baker Hughes Co. - Business segments
- Exhibit 94: Baker Hughes Co. - Key news
- Exhibit 95: Baker Hughes Co. - Key offerings
- Exhibit 96: Baker Hughes Co. - Segment focus
- 10.5 CIRCOR International Inc.
- Exhibit 97: CIRCOR International Inc. - Overview
- Exhibit 98: CIRCOR International Inc. - Business segments
- Exhibit 99: CIRCOR International Inc. - Key news
- Exhibit 100: CIRCOR International Inc. - Key offerings
- Exhibit 101: CIRCOR International Inc. - Segment focus
- 10.6 Dacon Inspection Technologies Co. Ltd.
- Exhibit 102: Dacon Inspection Technologies Co. Ltd. - Overview
- Exhibit 103: Dacon Inspection Technologies Co. Ltd. - Product / Service
- Exhibit 104: Dacon Inspection Technologies Co. Ltd. - Key offerings
- 10.7 GeoCorr LLC
- Exhibit 105: GeoCorr LLC - Overview
- Exhibit 106: GeoCorr LLC - Product / Service
- Exhibit 107: GeoCorr LLC - Key offerings
- 10.8 International Pipeline Products Ltd.
- Exhibit 108: International Pipeline Products Ltd. - Overview
- Exhibit 109: International Pipeline Products Ltd. - Product / Service
- Exhibit 110: International Pipeline Products Ltd. - Key offerings
- 10.9 Pigs Unlimited International LLC
- Exhibit 111: Pigs Unlimited International LLC - Overview
- Exhibit 112: Pigs Unlimited International LLC - Product / Service
- Exhibit 113: Pigs Unlimited International LLC - Key offerings
- 10.10 PIPECARE Group AG
- Exhibit 114: PIPECARE Group AG - Overview
- Exhibit 115: PIPECARE Group AG - Product / Service
- Exhibit 116: PIPECARE Group AG - Key offerings
- 10.11 Russell NDE Systems Inc.
- Exhibit 117: Russell NDE Systems Inc. - Overview
- Exhibit 118: Russell NDE Systems Inc. - Product / Service
- Exhibit 119: Russell NDE Systems Inc. - Key offerings
- 10.12 T.D. Williamson Inc.
- Exhibit 120: T.D. Williamson Inc. - Overview
- Exhibit 121: T.D. Williamson Inc. - Product / Service
- Exhibit 122: T.D. Williamson Inc. - Key offerings
11 Appendix
- 11.1 Scope of the report
- 11.2 Inclusions and exclusions checklist
- Exhibit 123: Inclusions checklist
- Exhibit 124: Exclusions checklist
- 11.3 Currency conversion rates for US$
- Exhibit 125: Currency conversion rates for US$
- 11.4 Research methodology
- Exhibit 126: Research methodology
- Exhibit 127: Validation techniques employed for market sizing
- Exhibit 128: Information sources
- 11.5 List of abbreviations
- Exhibit 129: List of abbreviations
About Us
Technavio is a leading global technology research and advisory company. Their research and analysis focus on emerging market trends and provides actionable insights to help businesses identify market opportunities and develop effective strategies to optimize their market positions. With over 500 specialized analysts, Technavio's report library consists of more than 17,000 reports and counting, covering 800 technologies, spanning across 50 countries. Their client base consists of enterprises of all sizes, including more than 100 Fortune 500 companies. This growing client base relies on Technavio's comprehensive coverage, extensive research, and actionable market insights to identify opportunities in existing and potential markets and assess their competitive positions within changing market scenarios.
Contact
Technavio Research
Jesse Maida
Media & Marketing Executive
US: +1 844 364 1100
UK: +44 203 893 3200
Email: media@technavio.com
Website: www.technavio.com/


SOURCE Technavio
© 2024 Benzinga.com. Benzinga does not provide investment advice. All rights reserved.
Trade confidently with insights and alerts from analyst ratings, free reports and breaking news that affects the stocks you care about.

