


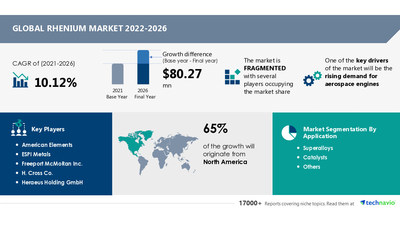
NEW YORK, May 19, 2022 /PRNewswire/ -- The Rhenium Market size is expected to grow by USD 80.27 million at a CAGR of 10.12% during the forecast period. The increased demand for aerospace engines is one of the major factors driving the rhenium industry forward. The report will comprise of detailed analysis of emerging market trends, regional outlook, competitive landscape, and comprehensive analysis of different market segments helping you to plan your business strategies. Grab your Sample Report of the Rhenium Market Right Away!

The rhenium market provides a detailed analysis of market overview, market drivers, opportunities, and potential applications.
The Top Key Players of the Rhenium Market are covered as:
- American Elements
- ESPI Metals
- Freeport McMoRan Inc.
- H. Cross Co.
- Heraeus Holding GmbH
- Hoganas AB
- KGHM Polska Miedz SA
- Leading Edge Metals and Alloys Inc.
- MOLYMET SA
- Navoi Mining and Metallurgical Co.
- Nova Resources B.V.
- Ossila Ltd.
- Remet UK Ltd.
- Rhenium Alloys Inc.
- Ultramet
- Umicore NV
Get in touch for any queries before you make a call to purchase the Rhenium Market report @ https://www.technavio.com/talk-to-us?report=IRTNTR46596
Key Market Segmentation
- Rhenium Market Split by Application
- Superalloys
- Catalysts
- Others
- Rhenium Market Split by Geography
- North America
- Europe
- APAC
- South America
- The Middle East and Africa
The superalloys category will grow its rhenium market share significantly. The superalloys application sector of the worldwide rhenium market was the largest, owing to the fact that superalloys are utilized to make both jet engines and industrial gas turbine fan blades.
The demand for rhenium is rising globally as the aviation and automotive industries expand. Rhenium is primarily produced in Chile, the United States, China, and Poland. Rhenium superalloys are utilized in the manufacture of thrusters, chambers, and nozzles in rockets, where their great heat resistance and stability are critical.
View Sample Report: to know additional highlights and key points on various market segments and their impact in coming years.
Imperative Insights on the following aspects:
- What was the size of the global rhenium industry by value in 2026?
- What will be the size of the global rhenium industry in 2026?
- What factors are affecting the strength of competition in the global rhenium industry?
- How has the industry performed over the last five years?
- What are the main segments that make up the global rhenium market?
Do reach out to our analysts for more customized reports as per your requirements. Speak to our Analyst now!
Rhenium market research report presents critical information and factual data about the rhenium industry, with an overall statistical study of this market based on market drivers, market limitations, and its prospects. The widespread trends and opportunities are also taken into consideration in the rhenium market study.
The product range of the rhenium industry is examined based on their production chain, pricing of products, and the profit generated by them. Various regional markets are analyzed in the rhenium market research report and the production volume and efficacy across the world are discussed.
Why buy?
- Identify growth Strategies across markets
- Track competitor gains and losses in market share.
- Assess the financial performance of competitors.
Buy the Rhenium Market report & Grow your Profit Margins With Us! Download Sample Report Now!
Related Reports:
Advanced Functional Materials Market by Type and Geography - Forecast and Analysis 2022-2026
Rhenium Market Scope | |
Report Coverage | Details |
Page number | 120 |
Base year | 2021 |
Forecast period | 2022-2026 |
Growth momentum & CAGR | Decelerate at a CAGR of 10.12% |
Market growth 2022-2026 | $ 80.27 million |
Market structure | Fragmented |
YoY growth (%) | 12.38 |
Regional analysis | North America, Europe, APAC, South America, and Middle East and Africa |
Performing market contribution | North America at 65% |
Key consumer countries | US, Canada, China, Russia, and Germany |
Competitive landscape | Leading companies, Competitive strategies, Consumer engagement scope |
Key companies profiled | American Elements, ESPI Metals, Freeport McMoRan Inc., H. Cross Co., Heraeus Holding GmbH, Hoganas AB, KGHM Polska Miedz SA, Leading Edge Metals and Alloys Inc., MOLYMET SA, Navoi Mining and Metallurgical Co., Nova Resources B.V., Ossila Ltd., Remet UK Ltd., Rhenium Alloys Inc., Ultramet, and Umicore NV |
Market dynamics | Parent market analysis, Market growth inducers and obstacles, Fast-growing and slow-growing segment analysis, COVID 19 impact and recovery analysis and future consumer dynamics, Market condition analysis for the forecast period |
Customization purview | If our report has not included the data that you are looking for, you can reach out to our analysts and get segments customized. |
Table of Content:
1 Executive Summary
- 1.1 Market overview
- Exhibit 01: Executive Summary – Chart on Market Overview
- Exhibit 02: Executive Summary – Data Table on Market Overview
- Exhibit 03: Executive Summary – Chart on Global Market Characteristics
- Exhibit 04: Executive Summary – Chart on Market by Geography
- Exhibit 05: Executive Summary – Chart on Market Segmentation by Application
- Exhibit 06: Executive Summary – Chart on Incremental Growth
- Exhibit 07: Executive Summary – Data Table on Incremental Growth
- Exhibit 08: Executive Summary – Chart on Vendor Market Positioning
2 Market Landscape
- 2.1 Market ecosystem
- Exhibit 09: Parent market
- Exhibit 10: Market Characteristics
3 Market Sizing
- 3.1 Market definition
- Exhibit 11: Offerings of vendors included in the market definition
- 3.2 Market segment analysis
- Exhibit 12: Market segments
- 3.3 Market size 2021
- 3.4 Market outlook: Forecast for 2021-2026
- Exhibit 13: Chart on Global - Market size and forecast 2021-2026 ($ million)
- Exhibit 14: Data Table on Global - Market size and forecast 2021-2026 ($ million)
- Exhibit 15: Chart on Global Market: Year-over-year growth 2021-2026 (%)
- Exhibit 16: Data Table on Global Market: Year-over-year growth 2021-2026 (%)
4 Five Forces Analysis
- 4.1 Five forces summary
- Exhibit 17: Five forces analysis - Comparison between 2021 and 2026
- 4.2 Bargaining power of buyers
- Exhibit 18: Chart on Bargaining power of buyers – Impact of key factors 2021 and 2026
- 4.3 Bargaining power of suppliers
- Exhibit 19: Bargaining power of suppliers – Impact of key factors in 2021 and 2026
- 4.4 Threat of new entrants
- Exhibit 20: Threat of new entrants – Impact of key factors in 2021 and 2026
- 4.5 Threat of substitutes
- Exhibit 21: Threat of substitutes – Impact of key factors in 2021 and 2026
- 4.6 Threat of rivalry
- Exhibit 22: Threat of rivalry – Impact of key factors in 2021 and 2026
- 4.7 Market condition
- Exhibit 23: Chart on Market condition - Five forces 2021 and 2026
5 Market Segmentation by Application
- 5.1 Market segments
- Exhibit 24: Chart on Application - Market share 2021-2026 (%)
- Exhibit 25: Data Table on Application - Market share 2021-2026 (%)
- 5.2 Comparison by Application
- Exhibit 26: Chart on Comparison by Application
- Exhibit 27: Data Table on Comparison by Application
- 5.3 Superalloys - Market size and forecast 2021-2026
- Exhibit 28: Chart on Superalloys - Market size and forecast 2021-2026 ($ million)
- Exhibit 29: Data Table on Superalloys - Market size and forecast 2021-2026 ($ million)
- Exhibit 30: Chart on Superalloys - Year-over-year growth 2021-2026 (%)
- Exhibit 31: Data Table on Superalloys - Year-over-year growth 2021-2026 (%)
- 5.4 Catalysts - Market size and forecast 2021-2026
- Exhibit 32: Chart on Catalysts - Market size and forecast 2021-2026 ($ million)
- Exhibit 33: Data Table on Catalysts - Market size and forecast 2021-2026 ($ million)
- Exhibit 34: Chart on Catalysts - Year-over-year growth 2021-2026 (%)
- Exhibit 35: Data Table on Catalysts - Year-over-year growth 2021-2026 (%)
- 5.5 Others - Market size and forecast 2021-2026
- Exhibit 36: Chart on Others - Market size and forecast 2021-2026 ($ million)
- Exhibit 37: Data Table on Others - Market size and forecast 2021-2026 ($ million)
- Exhibit 38: Chart on Others - Year-over-year growth 2021-2026 (%)
- Exhibit 39: Data Table on Others - Year-over-year growth 2021-2026 (%)
- 5.6 Market opportunity by Application
- Exhibit 40: Market opportunity by Application ($ million)
6 Customer Landscape
- 6.1 Customer landscape overview
- Exhibit 41: Analysis of price sensitivity, lifecycle, customer purchase basket, adoption rates, and purchase criteria
7 Geographic Landscape
- 7.1 Geographic segmentation
- Exhibit 42: Chart on Market share by geography 2021-2026 (%)
- Exhibit 43: Data Table on Market share by geography 2021-2026 (%)
- 7.2 Geographic comparison
- Exhibit 44: Chart on Geographic comparison
- Exhibit 45: Data Table on Geographic comparison
- 7.3 North America - Market size and forecast 2021-2026
- Exhibit 46: Chart on North America - Market size and forecast 2021-2026 ($ million)
- Exhibit 47: Data Table on North America - Market size and forecast 2021-2026 ($ million)
- Exhibit 48: Chart on North America - Year-over-year growth 2021-2026 (%)
- Exhibit 49: Data Table on North America - Year-over-year growth 2021-2026 (%)
- 7.4 Europe - Market size and forecast 2021-2026
- Exhibit 50: Chart on Europe - Market size and forecast 2021-2026 ($ million)
- Exhibit 51: Data Table on Europe - Market size and forecast 2021-2026 ($ million)
- Exhibit 52: Chart on Europe - Year-over-year growth 2021-2026 (%)
- Exhibit 53: Data Table on Europe - Year-over-year growth 2021-2026 (%)
- 7.5 APAC - Market size and forecast 2021-2026
- Exhibit 54: Chart on APAC - Market size and forecast 2021-2026 ($ million)
- Exhibit 55: Data Table on APAC - Market size and forecast 2021-2026 ($ million)
- Exhibit 56: Chart on APAC - Year-over-year growth 2021-2026 (%)
- Exhibit 57: Data Table on APAC - Year-over-year growth 2021-2026 (%)
- 7.6 South America - Market size and forecast 2021-2026
- Exhibit 58: Chart on South America - Market size and forecast 2021-2026 ($ million)
- Exhibit 59: Data Table on South America - Market size and forecast 2021-2026 ($ million)
- Exhibit 60: Chart on South America - Year-over-year growth 2021-2026 (%)
- Exhibit 61: Data Table on South America - Year-over-year growth 2021-2026 (%)
- 7.7 Middle East and Africa - Market size and forecast 2021-2026
- Exhibit 62: Chart on Middle East and Africa - Market size and forecast 2021-2026 ($ million)
- Exhibit 63: Data Table on Middle East and Africa - Market size and forecast 2021-2026 ($ million)
- Exhibit 64: Chart on Middle East and Africa - Year-over-year growth 2021-2026 (%)
- Exhibit 65: Data Table on Middle East and Africa - Year-over-year growth 2021-2026 (%)
- 7.8 US - Market size and forecast 2021-2026
- Exhibit 66: Chart on US - Market size and forecast 2021-2026 ($ million)
- Exhibit 67: Data Table on US - Market size and forecast 2021-2026 ($ million)
- Exhibit 68: Chart on US - Year-over-year growth 2021-2026 (%)
- Exhibit 69: Data Table on US - Year-over-year growth 2021-2026 (%)
- 7.9 Russia - Market size and forecast 2021-2026
- Exhibit 70: Chart on Russia - Market size and forecast 2021-2026 ($ million)
- Exhibit 71: Data Table on Russia - Market size and forecast 2021-2026 ($ million)
- Exhibit 72: Chart on Russia - Year-over-year growth 2021-2026 (%)
- Exhibit 73: Data Table on Russia - Year-over-year growth 2021-2026 (%)
- 7.10 China - Market size and forecast 2021-2026
- Exhibit 74: Chart on China - Market size and forecast 2021-2026 ($ million)
- Exhibit 75: Data Table on China - Market size and forecast 2021-2026 ($ million)
- Exhibit 76: Chart on China - Year-over-year growth 2021-2026 (%)
- Exhibit 77: Data Table on China - Year-over-year growth 2021-2026 (%)
- 7.11 Canada - Market size and forecast 2021-2026
- Exhibit 78: Chart on Canada - Market size and forecast 2021-2026 ($ million)
- Exhibit 79: Data Table on Canada - Market size and forecast 2021-2026 ($ million)
- Exhibit 80: Chart on Canada - Year-over-year growth 2021-2026 (%)
- Exhibit 81: Data Table on Canada - Year-over-year growth 2021-2026 (%)
- 7.12 Germany - Market size and forecast 2021-2026
- Exhibit 82: Chart on Germany - Market size and forecast 2021-2026 ($ million)
- Exhibit 83: Data Table on Germany - Market size and forecast 2021-2026 ($ million)
- Exhibit 84: Chart on Germany - Year-over-year growth 2021-2026 (%)
- Exhibit 85: Data Table on Germany - Year-over-year growth 2021-2026 (%)
- 7.13 Market opportunity by geography
- Exhibit 86: Market opportunity by geography ($ million)
8 Drivers, Challenges, and Trends
- 8.1 Market drivers
- 8.2 Market challenges
- 8.3 Impact of drivers and challenges
- Exhibit 87: Impact of drivers and challenges in 2021 and 2026
- 8.4 Market trends
9 Vendor Landscape
- 9.1 Overview
- 9.2 Vendor landscape
- Exhibit 88: Overview on Criticality of inputs and Factors of differentiation
- 9.3 Landscape disruption
- Exhibit 89: Overview on factors of disruption
- 9.4 Industry risks
- Exhibit 90: Impact of key risks on business
10 Vendor Analysis
- 10.1 Vendors covered
- Exhibit 91: Vendors covered
- 10.2 Market positioning of vendors
- Exhibit 92: Matrix on vendor position and classification
- 10.3 American Elements
- Exhibit 93: American Elements - Overview
- Exhibit 94: American Elements - Product / Service
- Exhibit 95: American Elements - Key offerings
- 10.4 H. Cross Co.
- Exhibit 96: H. Cross Co. - Overview
- Exhibit 97: H. Cross Co. - Product / Service
- Exhibit 98: H. Cross Co. - Key offerings
- 10.5 Heraeus Holding GmbH
- Exhibit 99: Heraeus Holding GmbH - Overview
- Exhibit 100: Heraeus Holding GmbH - Product / Service
- Exhibit 101: Heraeus Holding GmbH - Key offerings
- 10.6 Hoganas AB
- Exhibit 102: Hoganas AB - Overview
- Exhibit 103: Hoganas AB - Product / Service
- Exhibit 104: Hoganas AB - Key offerings
- 10.7 KGHM Polska Miedz SA
- Exhibit 105: KGHM Polska Miedz SA - Overview
- Exhibit 106: KGHM Polska Miedz SA - Business segments
- Exhibit 107: KGHM Polska Miedz SA - Key offerings
- Exhibit 108: KGHM Polska Miedz SA - Segment focus
- 10.8 MOLYMET SA
- Exhibit 109: MOLYMET SA - Overview
- Exhibit 110: MOLYMET SA - Product / Service
- Exhibit 111: MOLYMET SA - Key offerings
- 10.9 Remet UK Ltd.
- Exhibit 112: Remet UK Ltd. - Overview
- Exhibit 113: Remet UK Ltd. - Product / Service
- Exhibit 114: Remet UK Ltd. - Key offerings
- 10.10 Rhenium Alloys Inc.
- Exhibit 115: Rhenium Alloys Inc. - Overview
- Exhibit 116: Rhenium Alloys Inc. - Product / Service
- Exhibit 117: Rhenium Alloys Inc. - Key offerings
- 10.11 Ultramet
- Exhibit 118: Ultramet - Overview
- Exhibit 119: Ultramet - Product / Service
- Exhibit 120: Ultramet - Key offerings
- 10.12 Umicore NV
- Exhibit 121: Umicore NV - Overview
- Exhibit 122: Umicore NV - Business segments
- Exhibit 123: Umicore NV - Key news
- Exhibit 124: Umicore NV - Key offerings
- Exhibit 125: Umicore NV - Segment focus
11 Appendix
- 11.1 Scope of the report
- 11.2 Inclusions and exclusions checklist
- Exhibit 126: Inclusions checklist
- Exhibit 127: Exclusions checklist
- 11.3 Currency conversion rates for US$
- Exhibit 128: Currency conversion rates for US$
- 11.4 Research methodology
- Exhibit 129: Research methodology
- Exhibit 130: Validation techniques employed for market sizing
- Exhibit 131: Information sources
- 11.5 List of abbreviations
- Exhibit 132: List of abbreviations
About Us
Technavio is a leading global technology research and advisory company. Their research and analysis focus on emerging market trends and provides actionable insights to help businesses identify market opportunities and develop effective strategies to optimize their market positions. With over 500 specialized analysts, Technavio's report library consists of more than 17,000 reports and counting, covering 800 technologies, spanning across 50 countries. Their client base consists of enterprises of all sizes, including more than 100 Fortune 500 companies. This growing client base relies on Technavio's comprehensive coverage, extensive research, and actionable market insights to identify opportunities in existing and potential markets and assess their competitive positions within changing market scenarios.
Contact Us:
Technavio Research
Jesse Maida
Media & Marketing Executive
US: +1 844 364 1100
UK: +44 203 893 3200
Email: media@technavio.com
Website: www.technavio.com/


SOURCE Technavio
© 2024 Benzinga.com. Benzinga does not provide investment advice. All rights reserved.
Trade confidently with insights and alerts from analyst ratings, free reports and breaking news that affects the stocks you care about.

