


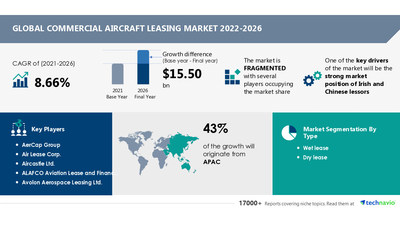
NEW YORK, May 18, 2022 /PRNewswire/ -- The latest market outlook report titled "Commercial Aircraft Leasing Market by Leasing Type and Geography - Forecast and Analysis 2022-2026" has been added to Technavio's catalog. This recent market analysis report identifies that the market will witness a potential growth difference of USD 15.50 billion from 2021 to 2026. The market is anticipated to record an accelerating growth momentum at a CAGR of 8.66% during this period.

Unlock more information on the YOY growth rate. Read our Report Sample!
Parent Market Overview
Technavio categorizes the global commercial aircraft leasing market as a part of the global aerospace & defense market. The parent market, the global aerospace & defense market, covers products and companies engaged in the production of aerial platforms used under commercial and general aviation; defense platforms used under naval, land, and air domains; arms and ammunition; defense electronics; defense logistics equipment; and space platforms, equipment, and launch vehicles.
Understand the Commercial Aircraft LeasingMarket Hierarchy and Gain Further Insights by Downloading Our Sample!
Market Competitive Landscape
The commercial aircraft leasing market is fragmented, and the vendors are deploying organic and inorganic growth strategies to compete in the market. Some of the key players covered in this report include AerCap Group, Air Lease Corp., Aircastle Ltd., ALAFCO Aviation Lease and Finance Co., Avolon Aerospace Leasing Ltd., Bank of Communications Co. Ltd., BBAM US LP, BOC Aviation Ltd., China Aircraft Leasing Group Holdings Ltd., China Development Bank Financial Leasing Co. Ltd., Deucalion Aviation Group, Dubai Aerospace Enterprise (DAE) Ltd., Industrial and Commercial Bank of China Co., Macquarie Group Ltd., Mitsubishi HC Capital Inc., Nordic Aviation Capital, Orix Corp., Saab AB, Sumitomo Mitsui Finance and Leasing Co. Ltd., and Tokyo Century Corp., among others.
For more insights on competitive strategies and market share of over 20 companies discussed in detail, Get Our Sample Report Right Here!
Strategic Initiatives and Products launches
- AerCap Group - The company offers commercial aircraft leasing that provides new and used commercial aircraft on operating lease from existing fleet and order book of Boeing, Airbus and Embraer aircraft, and through sale and leaseback transactions.
- Air Lease Corp. - The company offers commercial aircraft leasing that provides single-aisle aircraft, which includes Airbus A220 Family, Boeing 737 NG Family, and Twin Aisle Aircraft.
- Avolon Aerospace Leasing Ltd. - The company offers commercial aircraft leasing that includes AIRBUS A320 CEO, BOEING 787 8/9, AIRBUS A320 NEO, AIRBUS A350-900, and BOEING 777-300ER.
Want to get this report customized or tailor-made to suit your business requirements, Speak to Our Analysts
Strong market position of Irish and Chinese lessors to boost the market positively
Favorable policies by the government of Ireland have helped in the overall market growth. In addition, the leasing industry in China has been growing rapidly over the past decade, owing to favorable regulatory and policy support.
Fall in the price of crude oil likely to challenge the market growth
Reductions in fuel prices can enable airlines to save significant amounts on their operating expenses. The declining crude oil price has also been lowering the price of aviation fuels, which is helping airline operators in increasing their profit margin.
Download Report Sample Now to gain more insights on the other factors influencing market growth
COVID Impact and Recovery Analysis
Industrial activity in APAC was adversely impacted in 2020 due to the COVID-19 pandemic. However, all industrial sectors were expected to start showing signs of recovery from 2021 onward.
View report snapshot to learn more about the pandemic impact on the market and the industry
Market Segmentation
By type, the market has been segmented into wet-lease and dry lease. The wet-lease segment will have significant market share growth during the forecast period. The growth is attributed to several developments in the segment.
By geography, the market has been segmented into APAC, Europe, North America, South America, and MEA. APAC will have significant market share growth during the forecast period. The increasing demand for energy-efficient aircraft among fleet operators will drive the commercial aircraft leasing market growth in APAC during the forecast period.
Download Sample Report for market share information of each contributing segment
Key Report Takeaways
- CAGR of the market during the forecast period 2022-2026
- Detailed information on factors that will drive commercial aircraft leasing market growth during the next five years
- Precise estimation of the commercial aircraft leasing market size and its contribution to the parent market
- Accurate predictions on upcoming trends and changes in consumer behavior
- The growth of the commercial aircraft leasing market in North America, APAC, Europe, MEA, and South America and the top 20 countries across these regions
- A thorough analysis of the market's competitive landscape and detailed information on over 20 industry-focused market vendors classified as dominant and strong players
- Impact of lockdowns, supply chain disruptions, demand destruction, and change in customer behavior
- Pre as well as post COVID-19 market estimates
- Optimistic, base case, and pessimistic scenarios for all markets as the impact of the pandemic unfolds
Related Reports
Aircraft Auxiliary Power Unit Market by Application and Geography - Forecast and Analysis 2022-2026
Commercial Aircraft Leasing Market Scope | |
Report Coverage | Details |
Page number | 120 |
Base year | 2021 |
Forecast period | 2022-2026 |
Growth momentum & CAGR | Accelerate at a CAGR of 8.66% |
Market growth 2022-2026 | USD 15.50 billion |
Market structure | Fragmented |
YoY growth (%) | 6.97 |
Regional analysis | APAC, Europe, North America, South America, and Middle East and Africa |
Performing market contribution | APAC at 43% |
Key consumer countries | US, China, Japan, Germany, and France |
Competitive landscape | Leading companies, Competitive strategies, Consumer engagement scope |
Key companies profiled | AerCap Group, Air Lease Corp., Aircastle Ltd., ALAFCO Aviation Lease and Finance Co., Avolon Aerospace Leasing Ltd., Bank of Communications Co. Ltd., BBAM US LP, BOC Aviation Ltd., China Aircraft Leasing Group Holdings Ltd., China Development Bank Financial Leasing Co. Ltd., Deucalion Aviation Group, Dubai Aerospace Enterprise (DAE) Ltd., Industrial and Commercial Bank of China Co., Macquarie Group Ltd., Mitsubishi HC Capital Inc., Nordic Aviation Capital, Orix Corp., Saab AB, Sumitomo Mitsui Finance and Leasing Co. Ltd., and Tokyo Century Corp. |
Market dynamics | Parent market analysis, Market growth inducers and obstacles, Fast-growing and slow-growing segment analysis, COVID 19 impact and recovery analysis and future consumer dynamics, Market condition analysis for forecast period |
Customization purview | If our report has not included the data that you are looking for, you can reach out to our analysts and get segments customized. |
Table of Contents
1 Executive Summary
- 1.1 Market overview
- Exhibit 01: Executive Summary – Chart on Market Overview
- Exhibit 02: Executive Summary – Data Table on Market Overview
- Exhibit 03: Executive Summary – Chart on Global Market Characteristics
- Exhibit 04: Executive Summary – Chart on Market by Geography
- Exhibit 05: Executive Summary – Chart on Market Segmentation by Type
- Exhibit 06: Executive Summary – Chart on Incremental Growth
- Exhibit 07: Executive Summary – Data Table on Incremental Growth
- Exhibit 08: Executive Summary – Chart on Vendor Market Positioning
2 Market Landscape
- 2.1 Market ecosystem
- Exhibit 09: Parent market
- Exhibit 10: Market Characteristics
3 Market Sizing
- 3.1 Market definition
- Exhibit 11: Offerings of vendors included in the market definition
- 3.2 Market segment analysis
- Exhibit 12: Market segments
- 3.3 Market size 2021
- 3.4 Market outlook: Forecast for 2021-2026
- Exhibit 13: Chart on Global - Market size and forecast 2021-2026 ($ million)
- Exhibit 14: Data Table on Global - Market size and forecast 2021-2026 ($ million)
- Exhibit 15: Chart on Global Market: Year-over-year growth 2021-2026 (%)
- Exhibit 16: Data Table on Global Market: Year-over-year growth 2021-2026 (%)
4 Five Forces Analysis
- 4.1 Five forces summary
- Exhibit 17: Five forces analysis - Comparison between 2021 and 2026
- 4.2 Bargaining power of buyers
- Exhibit 18: Chart on Bargaining power of buyers – Impact of key factors 2021 and 2026
- 4.3 Bargaining power of suppliers
- Exhibit 19: Bargaining power of suppliers – Impact of key factors in 2021 and 2026
- 4.4 Threat of new entrants
- Exhibit 20: Threat of new entrants – Impact of key factors in 2021 and 2026
- 4.5 Threat of substitutes
- Exhibit 21: Threat of substitutes – Impact of key factors in 2021 and 2026
- 4.6 Threat of rivalry
- Exhibit 22: Threat of rivalry – Impact of key factors in 2021 and 2026
- 4.7 Market condition
- Exhibit 23: Chart on Market condition - Five forces 2021 and 2026
5 Market Segmentation by Type
- 5.1 Market segments
- Exhibit 24: Chart on Type - Market share 2021-2026 (%)
- Exhibit 25: Data Table on Type - Market share 2021-2026 (%)
- 5.2 Comparison by Type
- Exhibit 26: Chart on Comparison by Type
- Exhibit 27: Data Table on Comparison by Type
- 5.3 Wet lease - Market size and forecast 2021-2026
- Exhibit 28: Chart on Wet lease - Market size and forecast 2021-2026 ($ million)
- Exhibit 29: Data Table on Wet lease - Market size and forecast 2021-2026 ($ million)
- Exhibit 30: Chart on Wet lease - Year-over-year growth 2021-2026 (%)
- Exhibit 31: Data Table on Wet lease - Year-over-year growth 2021-2026 (%)
- 5.4 Dry lease - Market size and forecast 2021-2026
- Exhibit 32: Chart on Dry lease - Market size and forecast 2021-2026 ($ million)
- Exhibit 33: Data Table on Dry lease - Market size and forecast 2021-2026 ($ million)
- Exhibit 34: Chart on Dry lease - Year-over-year growth 2021-2026 (%)
- Exhibit 35: Data Table on Dry lease - Year-over-year growth 2021-2026 (%)
- 5.5 Market opportunity by Type
- Exhibit 36: Market opportunity by Type ($ million)
6 Customer Landscape
- 6.1 Customer landscape overview
- Exhibit 37: Analysis of price sensitivity, lifecycle, customer purchase basket, adoption rates, and purchase criteria
7 Geographic Landscape
- 7.1 Geographic segmentation
- Exhibit 38: Chart on Market share by geography 2021-2026 (%)
- Exhibit 39: Data Table on Market share by geography 2021-2026 (%)
- 7.2 Geographic comparison
- Exhibit 40: Chart on Geographic comparison
- Exhibit 41: Data Table on Geographic comparison
- 7.3 APAC - Market size and forecast 2021-2026
- Exhibit 42: Chart on APAC - Market size and forecast 2021-2026 ($ million)
- Exhibit 43: Data Table on APAC - Market size and forecast 2021-2026 ($ million)
- Exhibit 44: Chart on APAC - Year-over-year growth 2021-2026 (%)
- Exhibit 45: Data Table on APAC - Year-over-year growth 2021-2026 (%)
- 7.4 Europe - Market size and forecast 2021-2026
- Exhibit 46: Chart on Europe - Market size and forecast 2021-2026 ($ million)
- Exhibit 47: Data Table on Europe - Market size and forecast 2021-2026 ($ million)
- Exhibit 48: Chart on Europe - Year-over-year growth 2021-2026 (%)
- Exhibit 49: Data Table on Europe - Year-over-year growth 2021-2026 (%)
- 7.5 North America - Market size and forecast 2021-2026
- Exhibit 50: Chart on North America - Market size and forecast 2021-2026 ($ million)
- Exhibit 51: Data Table on North America - Market size and forecast 2021-2026 ($ million)
- Exhibit 52: Chart on North America - Year-over-year growth 2021-2026 (%)
- Exhibit 53: Data Table on North America - Year-over-year growth 2021-2026 (%)
- 7.6 South America - Market size and forecast 2021-2026
- Exhibit 54: Chart on South America - Market size and forecast 2021-2026 ($ million)
- Exhibit 55: Data Table on South America - Market size and forecast 2021-2026 ($ million)
- Exhibit 56: Chart on South America - Year-over-year growth 2021-2026 (%)
- Exhibit 57: Data Table on South America - Year-over-year growth 2021-2026 (%)
- 7.7 Middle East and Africa - Market size and forecast 2021-2026
- Exhibit 58: Chart on Middle East and Africa - Market size and forecast 2021-2026 ($ million)
- Exhibit 59: Data Table on Middle East and Africa - Market size and forecast 2021-2026 ($ million)
- Exhibit 60: Chart on Middle East and Africa - Year-over-year growth 2021-2026 (%)
- Exhibit 61: Data Table on Middle East and Africa - Year-over-year growth 2021-2026 (%)
- 7.8 China - Market size and forecast 2021-2026
- Exhibit 62: Chart on China - Market size and forecast 2021-2026 ($ million)
- Exhibit 63: Data Table on China - Market size and forecast 2021-2026 ($ million)
- Exhibit 64: Chart on China - Year-over-year growth 2021-2026 (%)
- Exhibit 65: Data Table on China - Year-over-year growth 2021-2026 (%)
- 7.9 US - Market size and forecast 2021-2026
- Exhibit 66: Chart on US - Market size and forecast 2021-2026 ($ million)
- Exhibit 67: Data Table on US - Market size and forecast 2021-2026 ($ million)
- Exhibit 68: Chart on US - Year-over-year growth 2021-2026 (%)
- Exhibit 69: Data Table on US - Year-over-year growth 2021-2026 (%)
- 7.10 Germany - Market size and forecast 2021-2026
- Exhibit 70: Chart on Germany - Market size and forecast 2021-2026 ($ million)
- Exhibit 71: Data Table on Germany - Market size and forecast 2021-2026 ($ million)
- Exhibit 72: Chart on Germany - Year-over-year growth 2021-2026 (%)
- Exhibit 73: Data Table on Germany - Year-over-year growth 2021-2026 (%)
- 7.11 France - Market size and forecast 2021-2026
- Exhibit 74: Chart on France - Market size and forecast 2021-2026 ($ million)
- Exhibit 75: Data Table on France - Market size and forecast 2021-2026 ($ million)
- Exhibit 76: Chart on France - Year-over-year growth 2021-2026 (%)
- Exhibit 77: Data Table on France - Year-over-year growth 2021-2026 (%)
- 7.12 Japan - Market size and forecast 2021-2026
- Exhibit 78: Chart on Japan - Market size and forecast 2021-2026 ($ million)
- Exhibit 79: Data Table on Japan - Market size and forecast 2021-2026 ($ million)
- Exhibit 80: Chart on Japan - Year-over-year growth 2021-2026 (%)
- Exhibit 81: Data Table on Japan - Year-over-year growth 2021-2026 (%)
- 7.13 Market opportunity by geography
- Exhibit 82: Market opportunity by geography ($ million)
8 Drivers, Challenges, and Trends
- 8.1 Market drivers
- 8.2 Market challenges
- 8.3 Impact of drivers and challenges
- Exhibit 83: Impact of drivers and challenges in 2021 and 2026
- 8.4 Market trends
9 Vendor Landscape
- 9.1 Overview
- 9.2 Vendor landscape
- Exhibit 84: Overview on Criticality of inputs and Factors of differentiation
- 9.3 Landscape disruption
- Exhibit 85: Overview on factors of disruption
- 9.4 Industry risks
- Exhibit 86: Impact of key risks on business
10 Vendor Analysis
- 10.1 Vendors covered
- Exhibit 87: Vendors covered
- 10.2 Market positioning of vendors
- Exhibit 88: Matrix on vendor position and classification
- 10.3 AerCap Group
- Exhibit 89: AerCap Group - Overview
- Exhibit 90: AerCap Group - Business segments
- Exhibit 91: AerCap Group - Key offerings
- Exhibit 92: AerCap Group - Segment focus
- 10.4 Air Lease Corp.
- Exhibit 93: Air Lease Corp. - Overview
- Exhibit 94: Air Lease Corp. - Business segments
- Exhibit 95: Air Lease Corp. - Key offerings
- Exhibit 96: Air Lease Corp. - Segment focus
- 10.5 Avolon Aerospace Leasing Ltd.
- Exhibit 97: Avolon Aerospace Leasing Ltd. - Overview
- Exhibit 98: Avolon Aerospace Leasing Ltd. - Business segments
- Exhibit 99: Avolon Aerospace Leasing Ltd. - Key offerings
- Exhibit 100: Avolon Aerospace Leasing Ltd. - Segment focus
- 10.6 BBAM US LP
- Exhibit 101: BBAM US LP - Overview
- Exhibit 102: BBAM US LP - Business segments
- Exhibit 103: BBAM US LP - Key offerings
- Exhibit 104: BBAM US LP - Segment focus
- 10.7 BOC Aviation Ltd.
- Exhibit 105: BOC Aviation Ltd. - Overview
- Exhibit 106: BOC Aviation Ltd. - Business segments
- Exhibit 107: BOC Aviation Ltd. - Key offerings
- Exhibit 108: BOC Aviation Ltd. - Segment focus
- 10.8 Dubai Aerospace Enterprise (DAE) Ltd.
- Exhibit 109: Dubai Aerospace Enterprise (DAE) Ltd. - Overview
- Exhibit 110: Dubai Aerospace Enterprise (DAE) Ltd. - Business segments
- Exhibit 111: Dubai Aerospace Enterprise (DAE) Ltd. - Key offerings
- Exhibit 112: Dubai Aerospace Enterprise (DAE) Ltd. - Segment focus
- 10.9 Industrial and Commercial Bank of China Co.
- Exhibit 113: Industrial and Commercial Bank of China Co. - Overview
- Exhibit 114: Industrial and Commercial Bank of China Co. - Product / Service
- Exhibit 115: Industrial and Commercial Bank of China Co. - Key offerings
- 10.10 Nordic Aviation Capital
- Exhibit 116: Nordic Aviation Capital - Overview
- Exhibit 117: Nordic Aviation Capital - Business segments
- Exhibit 118: Nordic Aviation Capital - Key offerings
- Exhibit 119: Nordic Aviation Capital - Segment focus
- 10.11 Sumitomo Mitsui Finance and Leasing Co. Ltd.
- Exhibit 120: Sumitomo Mitsui Finance and Leasing Co. Ltd. - Overview
- Exhibit 121: Sumitomo Mitsui Finance and Leasing Co. Ltd. - Business segments
- Exhibit 122: Sumitomo Mitsui Finance and Leasing Co. Ltd. - Key offerings
- Exhibit 123: Sumitomo Mitsui Finance and Leasing Co. Ltd. - Segment focus
- 10.12 Tokyo Century Corp.
- Exhibit 124: Tokyo Century Corp. - Overview
- Exhibit 125: Tokyo Century Corp. - Business segments
- Exhibit 126: Tokyo Century Corp. - Key offerings
- Exhibit 127: Tokyo Century Corp. - Segment focus
11 Appendix
- 11.1 Scope of the report
- 11.2 Inclusions and exclusions checklist
- Exhibit 128: Inclusions checklist
- Exhibit 129: Exclusions checklist
- 11.3 Currency conversion rates for US$
- Exhibit 130: Currency conversion rates for US$
- 11.4 Research methodology
- Exhibit 131: Research methodology
- Exhibit 132: Validation techniques employed for market sizing
- Exhibit 133: Information sources
- 11.5 List of abbreviations
- Exhibit 134: List of abbreviations
About Us
Technavio is a leading global technology research and advisory company. Their research and analysis focuses on emerging market trends and provides actionable insights to help businesses identify market opportunities and develop effective strategies to optimize their market positions. With over 500 specialized analysts, Technavio's report library Their client base consists of enterprises of all sizes, including more than 100 Fortune 500 companies. This growing client base relies on Technavio's comprehensive coverage, extensive research, and actionable market insights to identify opportunities in existing and potential markets and assess their competitive positions within changing market scenarios.
Contact
Technavio Research
Jesse Maida
Media & Marketing Executive
US: +1 844 364 1100
UK: +44 203 893 3200
Email:media@technavio.com
Website: https://www.technavio.com


SOURCE Technavio
© 2024 Benzinga.com. Benzinga does not provide investment advice. All rights reserved.
Trade confidently with insights and alerts from analyst ratings, free reports and breaking news that affects the stocks you care about.

