


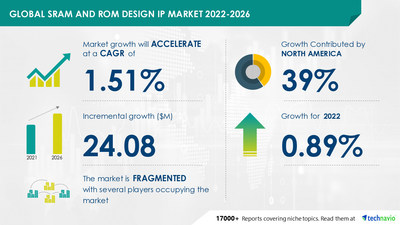
NEW YORK, May 11, 2022 /PRNewswire/ -- The global SRAM and ROM design IP market size is expected to grow by USD 24.08 million from 2021 to 2026 at a CAGR of 1.51% as per the latest market report by Technavio. 39% of the market's growth will originate from North America during the forecast period. The US is the key market for SRAM and ROM design IP market in North America. Market growth in this region will be faster than the growth of the market in other regions. Another key region offering significant growth opportunities to the vendors in APAC. The technological shift in the regional enterprises will facilitate the SRAM and ROM design IP market growth in North America over the forecast period.

For more insights on the market share of various regions - Download a sample report in MINUTES
Read the 120-page report with TOC on "SRAM and ROM Design IP Market Analysis Report by Type (SRAM and ROM) and Geography (APAC, North America, Europe, South America, and Middle East and Africa), and the Segment Forecasts,2022-2026". Gain competitive intelligence about market leaders. Track key industry opportunities, trends, and threats. Information on marketing, brand, strategy and market development, sales, and supply functions. https://www.technavio.com/report/report/sram-and-rom-design-ip-market-industry-analysis
SRAM and ROM Design IP Market: Vendor Analysis
The SRAM and ROM design IP market is fragmented and the vendors are deploying organic and inorganic growth strategies to compete in the market. The SRAM and ROM design IP market report offers information on several market vendors, including AnySilicon, Arm Ltd., Avalanche Technology Inc., Cadence Design Systems Inc., CEVA Inc., Design and Reuse SA, Dolphin Technology Inc, Edge AI, and Vision Alliance, eMemory Technology Inc., Everspin Technologies Inc., Infineon Technologies AG, Integrated Silicon Solution Inc., Microchip Technology Inc., Renesas Electronics Corp., Sperling Media Group LLC, STMicroelectronics NV, Surecore Ltd, Synopsys Inc., Toshiba Corp., VeriSilicon Microelectronics (Shanghai) Co. Ltd., and Xilinx Inc. among others.
- eMemory Technology Inc. The company offers SRAM and ROM design IP products such as NVM silicon IP platform NeoBit, NeoFuse, NeoMTP, NeoEE and NeoPUF
To know about all vendor offerings - Download a sample now!
SRAM and ROM Design IP Market - Drivers & Challenges
The faster processing speed is one of the key drivers supporting the SRAM and ROM design IP market growth. The speed at which a computer central processing unit (CPU) retrieves and interprets instructions is determined by the processor clock speed. This allows your computer to do more tasks in a shorter amount of time. SRAM is faster than DRAM since it does not have to refresh as frequently, as DRAM does. It has access periods of 60 nanoseconds in terms of seconds. In 10 nanoseconds, SRAM accomplishes the same task. It does not require an electric charge to be recharged. As the CPU does not have to wait for data from SRAM, it is faster than DRAM. The most typical application of SRAM is to act as a processor cache. Such increasing applications are driving the market growth.
However, the scaling issue of SRAM is one of the factors hindering the SRAM and ROM design IP market growth. SRAM scaling challenges are twofold-cell stability and physical area. SRAM Vmin is a function of transistor Vt mismatch, which is made up of two parts that include structural and random dopant fluctuation (RDF). To the first order, Vt mismatch is inversely proportional to the device/cell size. As a result, the larger the cell, the more stable it is. For instance, SRAM cell size scaling is limited by a few critical ground rules in terms of physical area difficulties," stated Subramani Kengeri, vice president of advanced technology architecture at Global Foundries. However, to address the SRAM scaling problem, chipmakers face some tough processes and design choices. Such challenges faced by chipmakers will negatively impact the market growth during the forecast period.
To know about the other drivers & challenges - Download a sample now!
SRAM And ROM Design IP Market: Segmentation Analysis
Type Outlook (Revenue, USD mn, 2021-2026)
- SRAM - size and forecast 2021-2026
- ROM - size and forecast 2021-2026
Geography Outlook (Revenue, USD mn, 2021-2026)
- APAC - size and forecast 2021-2026
- North America - size and forecast 2021-2026
- Europe - size and forecast 2021-2026
- South America - size and forecast 2021-2026
- Middle East and Africa - size and forecast 2021-2026
To know about the contribution of each segment - Grab an Exclusive Sample Report
Don't wait, Make a strategic approach & boost your business goals with our SRAM And ROM Design IP Market Forecast Report - Buy Now!
Related Reports:
- The DRAM market share is estimated to increase by USD 111.71 billion from 2021 to 2026, at a CAGR of 16.89%. Download a sample now!
- The programmable application-specific integrated circuit (ASIC) market share is expected to increase by USD 2.05 billion from 2021 to 2026, and the market's growth momentum will accelerate at a CAGR of 8.71%. Download a sample now!
SRAM And ROM Design IP Market Scope | |
Report Coverage | Details |
Page number | 120 |
Base year | 2021 |
Forecast period | 2022-2026 |
Growth momentum & CAGR | Accelerate at a CAGR of 1.51% |
Market growth 2022-2026 | USD 24.08 million |
Market structure | Fragmented |
YoY growth (%) | 0.89 |
Performing market contribution | North America at 39% |
Competitive landscape | Leading companies, competitive strategies, consumer engagement scope |
Companies profiled | AnySilicon, Arm Ltd., Avalanche Technology Inc., Cadence Design Systems Inc., CEVA Inc., Design and Reuse SA, Dolphin Technology Inc, Edge AI and Vision Alliance, eMemory Technology Inc., Everspin Technologies Inc., Infineon Technologies AG, Integrated Silicon Solution Inc., Microchip Technology Inc., Renesas Electronics Corp., Sperling Media Group LLC, STMicroelectronics NV, Surecore Ltd, Synopsys Inc., Toshiba Corp., VeriSilicon Microelectronics (Shanghai) Co. Ltd., and Xilinx Inc. |
Market Dynamics | Parent market analysis, Market growth inducers and obstacles, Fast-growing and slow-growing segment analysis, COVID 19 impact and future consumer dynamics, market condition analysis for the forecast period, |
Customization purview | If our report has not included the data that you are looking for, you can reach out to our analysts and get segments customized. |
Table of Content
1 Executive Summary
- 1.1 Market overview
- Exhibit 01: Executive Summary – Chart on Market Overview
- Exhibit 02: Executive Summary – Data Table on Market Overview
- Exhibit 03: Executive Summary – Chart on Global Market Characteristics
- Exhibit 04: Executive Summary – Chart on Market by Geography
- Exhibit 05: Executive Summary – Chart on Market Segmentation by Type
- Exhibit 06: Executive Summary – Chart on Incremental Growth
- Exhibit 07: Executive Summary – Data Table on Incremental Growth
- Exhibit 08: Executive Summary – Chart on Vendor Market Positioning
2 Market Landscape
- 2.1 Market ecosystem
- Exhibit 09: Parent market
- Exhibit 10: Market Characteristics
3 Market Sizing
- 3.1 Market definition
- Exhibit 11: Offerings of vendors included in the market definition
- 3.2 Market segment analysis
- Exhibit 12: Market segments
- 3.3 Market size 2021
- 3.4 Market outlook: Forecast for 2021-2026
- Exhibit 13: Chart on Global - Market size and forecast 2021-2026 ($ million)
- Exhibit 14: Data Table on Global - Market size and forecast 2021-2026 ($ million)
- Exhibit 15: Chart on Global Market: Year-over-year growth 2021-2026 (%)
- Exhibit 16: Data Table on Global Market: Year-over-year growth 2021-2026 (%)
4 Five Forces Analysis
- 4.1 Five forces summary
- Exhibit 17: Five forces analysis - Comparison between2021 and 2026
- 4.2 Bargaining power of buyers
- Exhibit 18: Chart on Bargaining power of buyers – Impact of key factors 2021 and 2026
- 4.3 Bargaining power of suppliers
- Exhibit 19: Bargaining power of suppliers – Impact of key factors in 2021 and 2026
- 4.4 Threat of new entrants
- Exhibit 20: Threat of new entrants – Impact of key factors in 2021 and 2026
- 4.5 Threat of substitutes
- Exhibit 21: Threat of substitutes – Impact of key factors in 2021 and 2026
- 4.6 Threat of rivalry
- Exhibit 22: Threat of rivalry – Impact of key factors in 2021 and 2026
- 4.7 Market condition
- Exhibit 23: Chart on Market condition - Five forces 2021 and 2026
5 Market Segmentation by Type
- 5.1 Market segments
- Exhibit 24: Chart on Type - Market share 2021-2026 (%)
- Exhibit 25: Data Table on Type - Market share 2021-2026 (%)
- 5.2 Comparison by Type
- Exhibit 26: Chart on Comparison by Type
- Exhibit 27: Data Table on Comparison by Type
- 5.3 SRAM - Market size and forecast 2021-2026
- Exhibit 28: Chart on SRAM - Market size and forecast 2021-2026 ($ million)
- Exhibit 29: Data Table on SRAM - Market size and forecast 2021-2026 ($ million)
- Exhibit 30: Chart on SRAM - Year-over-year growth 2021-2026 (%)
- Exhibit 31: Data Table on SRAM - Year-over-year growth 2021-2026 (%)
- 5.4 ROM - Market size and forecast 2021-2026
- Exhibit 32: Chart on ROM - Market size and forecast 2021-2026 ($ million)
- Exhibit 33: Data Table on ROM - Market size and forecast 2021-2026 ($ million)
- Exhibit 34: Chart on ROM - Year-over-year growth 2021-2026 (%)
- Exhibit 35: Data Table on ROM - Year-over-year growth 2021-2026 (%)
- 5.5 Market opportunity by Type
- Exhibit 36: Market opportunity by Type ($ million)
6 Customer Landscape
- 6.1 Customer landscape overview
- Exhibit 37: Analysis of price sensitivity, lifecycle, customer purchase basket, adoption rates, and purchase criteria
7 Geographic Landscape
- 7.1 Geographic segmentation
- Exhibit 38: Chart on Market share by geography 2021-2026 (%)
- Exhibit 39: Data Table on Market share by geography 2021-2026 (%)
- 7.2 Geographic comparison
- Exhibit 40: Chart on Geographic comparison
- Exhibit 41: Data Table on Geographic comparison
- 7.3 APAC - Market size and forecast 2021-2026
- Exhibit 42: Chart on APAC - Market size and forecast 2021-2026 ($ million)
- Exhibit 43: Data Table on APAC - Market size and forecast 2021-2026 ($ million)
- Exhibit 44: Chart on APAC - Year-over-year growth 2021-2026 (%)
- Exhibit 45: Data Table on APAC - Year-over-year growth 2021-2026 (%)
- 7.4 North America - Market size and forecast 2021-2026
- Exhibit 46: Chart on North America - Market size and forecast 2021-2026 ($ million)
- Exhibit 47: Data Table on North America - Market size and forecast 2021-2026 ($ million)
- Exhibit 48: Chart on North America - Year-over-year growth 2021-2026 (%)
- Exhibit 49: Data Table on North America - Year-over-year growth 2021-2026 (%)
- 7.5 Europe - Market size and forecast 2021-2026
- Exhibit 50: Chart on Europe - Market size and forecast 2021-2026 ($ million)
- Exhibit 51: Data Table on Europe - Market size and forecast 2021-2026 ($ million)
- Exhibit 52: Chart on Europe - Year-over-year growth 2021-2026 (%)
- Exhibit 53: Data Table on Europe - Year-over-year growth 2021-2026 (%)
- 7.6 South America - Market size and forecast 2021-2026
- Exhibit 54: Chart on South America - Market size and forecast 2021-2026 ($ million)
- Exhibit 55: Data Table on South America - Market size and forecast 2021-2026 ($ million)
- Exhibit 56: Chart on South America - Year-over-year growth 2021-2026 (%)
- Exhibit 57: Data Table on South America - Year-over-year growth 2021-2026 (%)
- 7.7 Middle East and Africa - Market size and forecast 2021-2026
- Exhibit 58: Chart on Middle East and Africa - Market size and forecast 2021-2026 ($ million)
- Exhibit 59: Data Table on Middle East and Africa - Market size and forecast 2021-2026 ($ million)
- Exhibit 60: Chart on Middle East and Africa - Year-over-year growth 2021-2026 (%)
- Exhibit 61: Data Table on Middle East and Africa - Year-over-year growth 2021-2026 (%)
- 7.8 US - Market size and forecast 2021-2026
- Exhibit 62: Chart on US - Market size and forecast 2021-2026 ($ million)
- Exhibit 63: Data Table on US - Market size and forecast 2021-2026 ($ million)
- Exhibit 64: Chart on US - Year-over-year growth 2021-2026 (%)
- Exhibit 65: Data Table on US - Year-over-year growth 2021-2026 (%)
- 7.9 China - Market size and forecast 2021-2026
- Exhibit 66: Chart on China - Market size and forecast 2021-2026 ($ million)
- Exhibit 67: Data Table on China - Market size and forecast 2021-2026 ($ million)
- Exhibit 68: Chart on China - Year-over-year growth 2021-2026 (%)
- Exhibit 69: Data Table on China - Year-over-year growth 2021-2026 (%)
- 7.10 UK - Market size and forecast 2021-2026
- Exhibit 70: Chart on UK - Market size and forecast 2021-2026 ($ million)
- Exhibit 71: Data Table on UK - Market size and forecast 2021-2026 ($ million)
- Exhibit 72: Chart on UK - Year-over-year growth 2021-2026 (%)
- Exhibit 73: Data Table on UK - Year-over-year growth 2021-2026 (%)
- 7.11 Germany - Market size and forecast 2021-2026
- Exhibit 74: Chart on Germany - Market size and forecast 2021-2026 ($ million)
- Exhibit 75: Data Table on Germany - Market size and forecast 2021-2026 ($ million)
- Exhibit 76: Chart on Germany - Year-over-year growth 2021-2026 (%)
- Exhibit 77: Data Table on Germany - Year-over-year growth 2021-2026 (%)
- 7.12 Japan - Market size and forecast 2021-2026
- Exhibit 78: Chart on Japan - Market size and forecast 2021-2026 ($ million)
- Exhibit 79: Data Table on Japan - Market size and forecast 2021-2026 ($ million)
- Exhibit 80: Chart on Japan - Year-over-year growth 2021-2026 (%)
- Exhibit 81: Data Table on Japan - Year-over-year growth 2021-2026 (%)
- 7.13 Market opportunity by geography
- Exhibit 82: Market opportunity by geography ($ million)
8 Drivers, Challenges, and Trends
- 8.1 Market drivers
- 8.2 Market challenges
- 8.3 Impact of drivers and challenges
- Exhibit 83: Impact of drivers and challenges in 2021 and 2026
- 8.4 Market trends
9 Vendor Landscape
- 9.1 Overview
- 9.2 Vendor landscape
- Exhibit 84: Overview on Criticality of inputs and Factors of differentiation
- 9.3 Landscape disruption
- Exhibit 85: Overview on factors of disruption
- 9.4 Industry risks
- Exhibit 86: Impact of key risks on business
10 Vendor Analysis
- 10.1 Vendors covered
- Exhibit 87: Vendors covered
- 10.2 Market positioning of vendors
- Exhibit 88: Matrix on vendor position and classification
- 10.3 Arm Ltd.
- Exhibit 89: Arm Ltd. - Overview
- Exhibit 90: Arm Ltd. - Product / Service
- Exhibit 91: Arm Ltd. - Key offerings
- 10.4 Avalanche Technology Inc.
- Exhibit 92: Avalanche Technology Inc. - Overview
- Exhibit 93: Avalanche Technology Inc. - Product / Service
- Exhibit 94: Avalanche Technology Inc. - Key offerings
- 10.5 Cadence Design Systems Inc.
- Exhibit 95: Cadence Design Systems Inc. - Overview
- Exhibit 96: Cadence Design Systems Inc. - Product / Service
- Exhibit 97: Cadence Design Systems Inc. - Key offerings
- 10.6 Dolphin Technology Inc
- Exhibit 98: Dolphin Technology Inc - Overview
- Exhibit 99: Dolphin Technology Inc - Product / Service
- Exhibit 100: Dolphin Technology Inc - Key offerings
- 10.7 eMemory Technology Inc.
- Exhibit 101: eMemory Technology Inc. - Overview
- Exhibit 102: eMemory Technology Inc. - Business segments
- Exhibit 103: eMemory Technology Inc. - Key offerings
- Exhibit 104: eMemory Technology Inc. - Segment focus
- 10.8 Everspin Technologies Inc.
- Exhibit 105: Everspin Technologies Inc. - Overview
- Exhibit 106: Everspin Technologies Inc. - Product / Service
- Exhibit 107: Everspin Technologies Inc. - Key offerings
- 10.9 Renesas Electronics Corp.
- Exhibit 108: Renesas Electronics Corp. - Overview
- Exhibit 109: Renesas Electronics Corp. - Business segments
- Exhibit 110: Renesas Electronics Corp. - Key offerings
- Exhibit 111: Renesas Electronics Corp. - Segment focus
- 10.10 Surecore Ltd
- Exhibit 112: Surecore Ltd - Overview
- Exhibit 113: Surecore Ltd - Product / Service
- Exhibit 114: Surecore Ltd - Key offerings
- 10.11 Synopsys Inc.
- Exhibit 115: Synopsys Inc. - Overview
- Exhibit 116: Synopsys Inc. - Business segments
- Exhibit 117: Synopsys Inc. - Key offerings
- Exhibit 118: Synopsys Inc. - Segment focus
- 10.12 Xilinx Inc.
- Exhibit 119: Xilinx Inc. - Overview
- Exhibit 120: Xilinx Inc. - Business segments
- Exhibit 121: Xilinx Inc. - Key offerings
- Exhibit 122: Xilinx Inc. - Segment focus
11 Appendix
- 11.1 Scope of the report
- 11.2 Inclusions and exclusions checklist
- Exhibit 123: Inclusions checklist
- 11.3 Currency conversion rates for US$
- Exhibit 124: Currency conversion rates for US$
- 11.4 Research methodology
- Exhibit 125: Research methodology
- Exhibit 126: Validation techniques employed for market sizing
- Exhibit 127: Information sources
- 11.5 List of abbreviations
- Exhibit 128: List of abbreviations
About Technavio
Technavio is a leading global technology research and advisory company. Their research and analysis focuses on emerging market trends and provides actionable insights to help businesses identify market opportunities and develop effective strategies to optimize their market positions.
With over 500 specialized analysts, Technavio's report library consists of more than 17,000 reports and counting, covering 800 technologies, spanning across 50 countries. Their client base consists of enterprises of all sizes, including more than 100 Fortune 500 companies. This growing client base relies on Technavio's comprehensive coverage, extensive research, and actionable market insights to identify opportunities in existing and potential markets and assess their competitive positions within changing market scenarios.
Contact
Technavio Research
Jesse Maida
Media & Marketing Executive
US: +1 844 364 1100
UK: +44 203 893 3200
Email: media@technavio.com
Website: www.technavio.com/


SOURCE Technavio
© 2024 Benzinga.com. Benzinga does not provide investment advice. All rights reserved.
Trade confidently with insights and alerts from analyst ratings, free reports and breaking news that affects the stocks you care about.

