


NEW YORK, May 9, 2022 /PRNewswire/ -- The "Gas Sensors Market by Type (Wired and Wireless) and Geography (APAC, North America, Europe, South America, and the Middle East and Africa) - Forecast and Analysis 2022-2026" report has been added to Technavio's offering. The increasing use of gas sensors in the mining industry is one of the primary reasons driving the global gas sensors market growth.

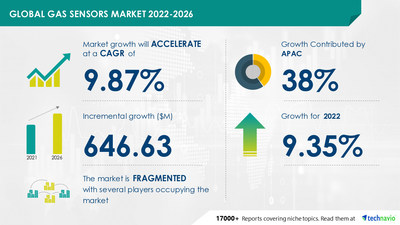
The potential growth difference for the gas sensors market between 2021 and 2026 is USD 646.63 million. To get the exact yearly growth variance and the Y-O-Y growth rate, Talk to our analyst.
Key Market Dynamics:
- Market Driver
- Market Challenges
The increasing use of gas sensors in the mining industry is one of the primary reasons driving the global gas sensors market growth. On the earth's surface, there exist several gases that are exhaustible in nature, and these gases are surrounded by hazardous organic components. Miners working underground confront numerous challenges in such situations, as these gases are not detectable by humans. As a result, gas sensors are frequently utilized in the mining industry to detect dangerous amounts of various gases existing beneath the earth's surface and to save miners' lives. During the predicted period, this will increase demand for gas sensors.
However, factors such as issues related to sensitivity, selectivity, and stability of gas sensors will challenge market growth.
To learn about additional key drivers, trends, and challenges available with Technavio. Read our Sample Report right now!
Key Market Segmentation
APAC will account for 38 percent of market growth. In APAC, China, South Korea, and Japan are the most important markets for gas sensors. The market in this region will increase at a quicker rate than the market in other regions.
The considerable increase in demand for diesel and gasoline as a result of rising automotive sales would aid the expansion of the gas sensors market in APAC over the forecast period. This market research report includes thorough information on competitor intelligence, marketing gaps, and geographical potential for suppliers, all of which will aid in the development of effective business plans.
Download our sample report for additional insights into the contribution of all the segments, and regional opportunities in the report.
Some Companies Mentioned with their Offerings
The report analyzes the market's competitive landscape and offers information on several market vendors, including:
- Alphasense Ltd.
- Amphenol Corp.
- ams AG
- Breeze Technologies UG
- Danfoss AS
- Dynament Ltd.
- Edinburgh Instruments Ltd.
- eLichens
- Figaro Engineering Inc.
- Gastec Corp.
- Honeywell International Inc.
- Membrapor AG
- MIPEX TECHNOLOGY
- MSA Safety Inc.
- Nemoto Sensor Engineering Co. Ltd.
- Nissha Co. Ltd.
- Renesas Electronics Corp.
- Robert Bosch GmbH
- Sensirion AG
- SPEC Sensors, LLC
Find additional highlights on the growth strategies adopted by vendors and their product offerings, Read our Sample Report.
Related Reports:
Energy Efficient HVAC Systems Market by Product and Geography - Forecast and Analysis 2022-2026
Commercial Sous Vide Machine Market by Product and Geography - Forecast and Analysis 2022-2026
Gas Sensors Market Scope | |
Report Coverage | Details |
Page number | 120 |
Base year | 2021 |
Forecast period | 2022-2026 |
Growth momentum & CAGR | Accelerate at a CAGR of 9.87% |
Market growth 2022-2026 | $ 646.63 million |
Market structure | Fragmented |
YoY growth (%) | 9.35 |
Regional analysis | APAC, North America, Europe, South America, and Middle East and Africa |
Performing market contribution | APAC at 38% |
Key consumer countries | US, China, South Korea, Japan, and Germany |
Competitive landscape | Leading companies, Competitive strategies, Consumer engagement scope |
Key companies profiled | Alphasense Ltd., Amphenol Corp., ams AG, Breeze Technologies UG, Danfoss AS, Dynament Ltd., Edinburgh Instruments Ltd., eLichens, Figaro Engineering Inc., Gastec Corp., Honeywell International Inc., Membrapor AG, MIPEX TECHNOLOGY, MSA Safety Inc., Nemoto Sensor Engineering Co. Ltd., Nissha Co. Ltd., Renesas Electronics Corp., Robert Bosch GmbH, Sensirion AG, and SPEC Sensors, LLC |
Market dynamics | Parent market analysis, Market growth inducers and obstacles, Fast-growing and slow-growing segment analysis, COVID 19 impact and recovery analysis and future consumer dynamics, Market condition analysis for forecast period |
Customization purview | If our report has not included the data that you are looking for, you can reach out to our analysts and get segments customized. |
Table of Contents
1. Executive Summary
1.1 Market overview
Exhibit 01: Executive Summary – Chart on Market Overview
Exhibit 02: Executive Summary – Data Table on Market Overview
Exhibit 03: Executive Summary – Chart on Global Market Characteristics
Exhibit 04: Executive Summary – Chart on Market by Geography
Exhibit 05: Executive Summary – Chart on Market Segmentation by Type
Exhibit 06: Executive Summary – Chart on Incremental Growth
Exhibit 07: Executive Summary – Data Table on Incremental Growth
Exhibit 08: Executive Summary – Chart on Vendor Market Positioning
2. Market Landscape
2.1 Market ecosystem
Exhibit 09: Parent market
Exhibit 10: Market Characteristics
3. Market Sizing
3.1 Market definition
Exhibit 11: Offerings of vendors included in the market definition
3.2 Market segment analysis
Exhibit 12: Market segments
3.3 Market size 2021
3.4 Market outlook: Forecast for 2021-2026
Exhibit 13: Chart on Global - Market size and forecast 2021-2026 ($ million)
Exhibit 14: Data Table on Global - Market size and forecast 2021-2026 ($ million)
Exhibit 15: Chart on Global Market: Year-over-year growth 2021-2026 (%)
Exhibit 16: Data Table on Global Market: Year-over-year growth 2021-2026 (%)
4. Five Forces Analysis
4.1 Five Forces Summary
Exhibit 17: Five forces analysis - Comparison between2021 and 2026
4.2 Bargaining power of buyers
Exhibit 18: Chart on Bargaining power of buyers – Impact of key factors 2021 and 2026
4.3 Bargaining power of suppliers
Exhibit 19: Bargaining power of suppliers – Impact of key factors in 2021 and 2026
4.4 Threat of new entrants
Exhibit 20: Threat of new entrants – Impact of key factors in 2021 and 2026
4.5 Threat of substitutes
Exhibit 21: Threat of substitutes – Impact of key factors in 2021 and 2026
4.6 Threat of rivalry
Exhibit 22: Threat of rivalry – Impact of key factors in 2021 and 2026
4.7 Market condition
Exhibit 23: Chart on Market condition - Five forces 2021 and 2026
5. Market Segmentation by Type
5.1 Market segments
Exhibit 24: Chart on Type- Market share 2021-2026 (%)
Exhibit 25: Data Table on Type- Market share 2021-2026 (%)
5.2 Comparison by Type
Exhibit 26: Chart on Comparison by Type
Exhibit 27: Data Table on Comparison by Type
5.3 Wired - Market size and forecast 2021-2026
Exhibit 28: Chart on Wired - Market size and forecast 2021-2026 ($ million)
Exhibit 29: Data Table on Wired - Market size and forecast 2021-2026 ($ million)
Exhibit 30: Chart on Wired - Year-over-year growth 2021-2026 (%)
Exhibit 31: Data Table on Wired - Year-over-year growth 2021-2026 (%)
5.4 Wireless - Market size and forecast 2021-2026
Exhibit 32: Chart on Wireless - Market size and forecast 2021-2026 ($ million)
Exhibit 33: Data Table on Wireless - Market size and forecast 2021-2026 ($ million)
Exhibit 34: Chart on Wireless - Year-over-year growth 2021-2026 (%)
Exhibit 35: Data Table on Wireless - Year-over-year growth 2021-2026 (%)
5.5 Market opportunity by Type
Exhibit 36: Market opportunity by Type ($ million)
6. Customer landscape
Technavio's customer landscape matrix comparing Drivers or price sensitivity, Adoption lifecycle, importance in customer price basket, Adoption rate and Key purchase criteria
6.1 Customer landscape overview
Exhibit 37: Analysis of price sensitivity, lifecycle, customer purchase basket, adoption rates, and purchase criteria
7. Geographic Landscape
7.1 Geographic segmentation
Exhibit 38: Chart on Market share by geography 2021-2026 (%)
Exhibit 39: Data Table on Market share by geography 2021-2026 (%)
7.2 Geographic comparison
Exhibit 40: Chart on Geographic comparison
Exhibit 41: Data Table on Geographic comparison
7.3 APAC - Market size and forecast 2021-2026
Exhibit 42: Chart on APAC - Market size and forecast 2021-2026 ($ million)
Exhibit 43: Data Table on APAC- Market size and forecast 2021-2026 ($ million)
Exhibit 44: Chart on APAC- Year-over-year growth 2021-2026 (%)
Exhibit 45: Data Table on APAC- Year-over-year growth 2021-2026 (%)
7.4 North America - Market size and forecast 2021-2026
Exhibit 46: Chart on North America - Market size and forecast 2021-2026 ($ million)
Exhibit 47: Data Table on North America - Market size and forecast 2021-2026 ($ million)
Exhibit 48: Chart on North America - Year-over-year growth 2021-2026 (%)
Exhibit 49: Data Table on North America - Year-over-year growth 2021-2026 (%)
7.5 Europe - Market size and forecast 2021-2026
Exhibit 50: Chart on Europe- Market size and forecast 2021-2026 ($ million)
Exhibit 51: Data Table on Europe- Market size and forecast 2021-2026 ($ million)
Exhibit 52: Chart on Europe- Year-over-year growth 2021-2026 (%)
Exhibit 53: Data Table on Europe- Year-over-year growth 2021-2026 (%)
7.6 South America - Market size and forecast 2021-2026
Exhibit 54: Chart on South America - Market size and forecast 2021-2026 ($ million)
Exhibit 55: Data Table on South America - Market size and forecast 2021-2026 ($ million)
Exhibit 56: Chart on South America - Year-over-year growth 2021-2026 (%)
Exhibit 57: Data Table on South America - Year-over-year growth 2021-2026 (%)
7.7 Middle East and Africa - Market size and forecast 2021-2026
Exhibit 58: Chart on Middle East and Africa - Market size and forecast 2021-2026 ($ million)
Exhibit 59: Data Table on Middle East and Africa - Market size and forecast 2021-2026 ($ million)
Exhibit 60: Chart on Middle East and Africa - Year-over-year growth 2021-2026 (%)
Exhibit 61: Data Table on Middle East and Africa - Year-over-year growth 2021-2026 (%)
7.8 US- Market size and forecast 2021-2026
Exhibit 62: Chart on US- Market size and forecast 2021-2026 ($ million)
Exhibit 63: Data Table on US- Market size and forecast 2021-2026 ($ million)
Exhibit 64: Chart on US- Year-over-year growth 2021-2026 (%)
Exhibit 65: Data Table on US- Year-over-year growth 2021-2026 (%)
7.9 China- Market size and forecast 2021-2026
Exhibit 66: Chart on China- Market size and forecast 2021-2026 ($ million)
Exhibit 67: Data Table on China- Market size and forecast 2021-2026 ($ million)
Exhibit 68: Chart on China- Year-over-year growth 2021-2026 (%)
Exhibit 69: Data Table on China- Year-over-year growth 2021-2026 (%)
7.10 South Korea- Market size and forecast 2021-2026
Exhibit 70: Chart on South Korea- Market size and forecast 2021-2026 ($ million)
Exhibit 71: Data Table on South Korea- Market size and forecast 2021-2026 ($ million)
Exhibit 72: Chart on South Korea- Year-over-year growth 2021-2026 (%)
Exhibit 73: Data Table on South Korea- Year-over-year growth 2021-2026 (%)
7.11 Japan- Market size and forecast 2021-2026
Exhibit 74: Chart on Japan- Market size and forecast 2021-2026 ($ million)
Exhibit 75: Data Table on Japan- Market size and forecast 2021-2026 ($ million)
Exhibit 76: Chart on Japan- Year-over-year growth 2021-2026 (%)
Exhibit 77: Data Table on Japan- Year-over-year growth 2021-2026 (%)
7.12 Germany- Market size and forecast 2021-2026
Exhibit 78: Chart on Germany- Market size and forecast 2021-2026 ($ million)
Exhibit 79: Data Table on Germany- Market size and forecast 2021-2026 ($ million)
Exhibit 80: Chart on Germany- Year-over-year growth 2021-2026 (%)
Exhibit 81: Data Table on Germany- Year-over-year growth 2021-2026 (%)
7.13 Market opportunity by geography
Exhibit 82: Market opportunity by geography ($ million)
8. Drivers, Challenges, and Trends
8.1 Market drivers
8.1.1 Rising applications of gas sensors in mining industry
8.1.2 Development of new sensor designs and technology
8.1.3 Emphasis on improving workplace safety
8.2 Market challenges
8.2.1 Issues related to sensitivity, selectivity, and stability of gas sensors
8.2.2 Limited shelf life of electrochemical sensors
8.2.3 Intense competition in the market
8.3 Impact of drivers and challenges
Exhibit 83: Impact of drivers and challenges in 2021 and 2026
8.4 Market trends
8.4.1 Emergence of advanced sensors for gas detection
8.4.2 Growing popularity of gas detectors for commercial applications
8.4.3 Growing popularity of wearable gas sensors
9. Vendor Landscape
9.1 Overview
9.2 Vendor landscape
Exhibit 84: Overview on Criticality of inputs and Factors of differentiation
9.3 Landscape disruption
Exhibit 85: Overview on factors of disruption
9.4 Industry risks
Exhibit 86: Impact of key risks on business
10. Vendor Analysis
10.1 Vendors covered
Exhibit 87: Vendors covered
10.2 Market positioning of vendors
Exhibit 88: Matrix on vendor position and classification
10.3 Alphasense Ltd.
Exhibit 89: Alphasense Ltd. - Overview
Exhibit 90: Alphasense Ltd. - Product / Service
Exhibit 91: Alphasense Ltd. - Key offerings
10.4 Blossman Propane Gas and Appliance Inc.
Exhibit 92: Amphenol Corp. - Overview
Exhibit 93: Amphenol Corp. - Business segments
Exhibit 94: Amphenol Corp. - Key news
Exhibit 95: Amphenol Corp. - Key offerings
Exhibit 96: Amphenol Corp. - Segment focus
10.5 Dynament Ltd.
Exhibit 97: Dynament Ltd. - Overview
Exhibit 98: Dynament Ltd. - Product / Service
Exhibit 99: Dynament Ltd. - Key offerings
10.6 eLichens
Exhibit 100: eLichens - Overview
Exhibit 101: eLichens - Product / Service
Exhibit 102: eLichens - Key offerings
10.7 China Petrochemical Corp.
Exhibit 103: Figaro Engineering Inc. - Overview
Exhibit 104: Figaro Engineering Inc. - Product / Service
Exhibit 105: Figaro Engineering Inc. - Key offerings
10.8 Gastec Corp.
Exhibit 106: Gastec Corp. - Overview
Exhibit 107: Gastec Corp. - Product / Service
Exhibit 108: Gastec Corp. - Key offerings
10.9 Membrapor AG
Exhibit 109: Membrapor AG - Overview
Exhibit 110: Membrapor AG - Product / Service
Exhibit 111: Membrapor AG - Key offerings
10.10 Equinor ASA
Exhibit 112: Nemoto Sensor Engineering Co. Ltd. - Overview
Exhibit 113: Nemoto Sensor Engineering Co. Ltd. - Product / Service
Exhibit 114: Nemoto Sensor Engineering Co. Ltd. - Key offerings
10.11 Robert Bosch GmbH
Exhibit 115: Robert Bosch GmbH - Overview
Exhibit 116: Robert Bosch GmbH - Business segments
About Us
Technavio is a leading global technology research and advisory company. Their research and analysis focuses on emerging market trends and provides actionable insights to help businesses identify market opportunities and develop effective strategies to optimize their market positions. With over 500 specialized analysts, Technavio's report library Their client base consists of enterprises of all sizes, including more than 100 Fortune 500 companies. This growing client base relies on Technavio's comprehensive coverage, extensive research, and actionable market insights to identify opportunities in existing and potential markets and assess their competitive positions within changing market scenarios.
Contact
Technavio Research
Jesse Maida
Media & Marketing Executive
US: +1 844 364 1100
UK: +44 203 893 3200
Email:media@technavio.com
Website: www.technavio.com


SOURCE Technavio
© 2024 Benzinga.com. Benzinga does not provide investment advice. All rights reserved.
Trade confidently with insights and alerts from analyst ratings, free reports and breaking news that affects the stocks you care about.

