


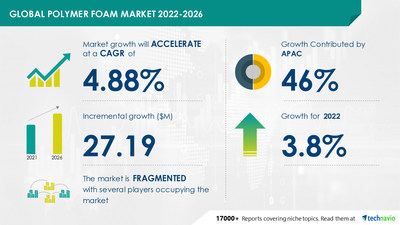
NEW YORK, May 9, 2022 /PRNewswire/ -- The "Global Polymer Foam Market by Application and Type - Forecast and Analysis 2022-2026" report has been added to Technavio's latest offering. According to the report, the market will observe an incremental growth of USD 27.19 million between 2021 and 2026, expanding at a CAGR of 4.88% during the forecast period. APAC is identified as the key region in terms of revenue generation. Population growth, economic growth, and the rising disposable incomes of the people in India, the Philippines, Malaysia, and China are creating significant growth opportunities for vendors operating in the region.

Download a Sample Report Now to get highlights on the market size, growth momentum, and regional growth opportunities.
The global polymer foam market is fragmented is highly competitive with the existence of a large number of key players. Also, there are a sizeable number of small local and regional vendors with significant shares in the market. Vendors compete on the basis of factors such as innovation, price, operational cost, and product quality. Competitors have to focus on differentiating their product offerings with unique value propositions to strengthen their foothold in the market. Market vendors also have to leverage the existing growth prospects in the fast-growing segments, while maintaining their positions in the slow-growing segments.
Arkema Group, Armacell International SA, BASF SE, Boyd Corp., FXI, Huntsman International LLC, LANXESS AG, Meenakshi Polymers Pvt. Ltd., Mitsubishi Gas Chemical Co. Inc., Mitsui Chemicals Inc., RAG-Stiftung, Recticel NV, Rogers Foam Corp., SABIC, The Dow Chemical Co., Toray Industries Inc., Tosoh Corp., Vita Holdings Ltd., Woodbridge Foam Corp., and Zotefoams Plc are identified some of the major market participants. Growth in the bedding and furniture industry has been instrumental in driving the growth of the market. However, environmental hazards due to the manufacture and application of PU might hamper the market growth.
Buy our report now to get a detailed analysis of the vendor profiles, successful growth strategies adopted by leading vendors, and the products offered by them.
Read Our Sample Report Before Purchasing
Polymer Foam Market 2022-2026: Segmentation
The global polymer foam market is segmented as below:
- Application
- Packaging
- Building And Construction
- Furniture And Bedding
- Transportation
- Others
The packaging segment holds the largest share of the market. The extensive use of polymer foams for packaging lightweight, fragile, and shock-sensitive products. Also, properties of polymer foams such as low weight, better surface protection, and thermal insulation are increasing their applications in the packaging industry.
- Type
- PU
- PVC
- Phenolic
- Others
The market growth in the PU segment will be significant over the forecast period. The growth of the construction and infrastructure industries and the thriving global automotive industry are driving the growth of the market in the PU segment.
- Geography
- APAC
- North America
- Europe
- The Middle East and Africa
- South America
APAC is the dominating region in the market, occupying 46% of the global market share. The rapid growth of the paper and paperboard container and packaging market in APAC is driving the growth of the regional market. In addition, the increasing demand for polymer foams from the construction industry in China and India is contributing to the growth of the market.
Know about other potential segments and regions in the market. Request a Sample Report Now
Polymer Foam Market 2022-2026: Key Highlights
- CAGR of the market during the forecast period 2022-2026
- Detailed information on factors that will assist polymer foam market growth during the next five years
- Estimation of the polymer foam market size and its contribution to the parent market
- Predictions on upcoming trends and changes in consumer behavior
- The growth of the polymer foam market
- Analysis of the market's competitive landscape and detailed information on vendors
- Comprehensive details of factors that will challenge the growth of polymer foam market vendors
Related Reports:
Nitrile Butadiene Rubber Market by Application and Geography - Forecast and Analysis 2022-2026
Polyolefin (POF) Shrink Film Market by Application and Geography - Forecast and Analysis 2022-2026
Polymer Foam Market Scope | |
Report Coverage | Details |
Page number | 120 |
Base year | 2021 |
Forecast period | 2022-2026 |
Growth momentum & CAGR | Accelerate at a CAGR of 4.88% |
Market growth 2022-2026 | USD 27.19 million |
Market structure | Fragmented |
YoY growth (%) | 3.8 |
Regional analysis | APAC, North America, Europe, Middle East and Africa, and South America |
Performing market contribution | APAC at 46% |
Key consumer countries | US, China, Japan, India, and Germany |
Competitive landscape | Leading companies, competitive strategies, consumer engagement scope |
Companies profiled | Arkema Group, Armacell International SA, BASF SE, Boyd Corp., FXI, Huntsman International LLC, LANXESS AG, Meenakshi Polymers Pvt. Ltd., Mitsubishi Gas Chemical Co. Inc., Mitsui Chemicals Inc., RAG-Stiftung, Recticel NV, Rogers Foam Corp., SABIC, The Dow Chemical Co., Toray Industries Inc., Tosoh Corp., Vita Holdings Ltd., Woodbridge Foam Corp., and Zotefoams Plc |
Market Dynamics | Parent market analysis, Market growth inducers and obstacles, Fast-growing and slow-growing segment analysis, COVID 19 impact and future consumer dynamics, market condition analysis for the forecast period. |
Customization purview | If our report has not included the data that you are looking for, you can reach out to our analysts and get segments customized. |
Table of Contents:
1 Executive Summary
- 1.1 Market overview
- Exhibit 01: Executive Summary – Chart on Market Overview
- Exhibit 02: Executive Summary – Data Table on Market Overview
- Exhibit 03: Executive Summary – Chart on Global Market Characteristics
- Exhibit 04: Executive Summary – Chart on Market by Geography
- Exhibit 05: Executive Summary – Chart on Market Segmentation by Application
- Exhibit 06: Executive Summary – Chart on Market Segmentation by Type
- Exhibit 07: Executive Summary – Chart on Incremental Growth
- Exhibit 08: Executive Summary – Data Table on Incremental Growth
- Exhibit 09: Executive Summary – Chart on Vendor Market Positioning
2 Market Landscape
- 2.1 Market ecosystem
- Exhibit 10: Parent market
- Exhibit 11: Market Characteristics
3 Market Sizing
- 3.1 Market definition
- Exhibit 12: Offerings of vendors included in the market definition
- 3.2 Market segment analysis
- Exhibit 13: Market segments
- 3.3 Market size 2021
- 3.4 Market outlook: Forecast for 2021-2026
- Exhibit 14: Chart on Global - Market size and forecast 2021-2026 ($ million)
- Exhibit 15: Data Table on Global - Market size and forecast 2021-2026 ($ million)
- Exhibit 16: Chart on Global Market: Year-over-year growth 2021-2026 (%)
- Exhibit 17: Data Table on Global Market: Year-over-year growth 2021-2026 (%)
4 Five Forces Analysis
- 4.1 Five forces summary
- Exhibit 18: Five forces analysis - Comparison between2021 and 2026
- 4.2 Bargaining power of buyers
- Exhibit 19: Chart on Bargaining power of buyers – Impact of key factors 2021 and 2026
- 4.3 Bargaining power of suppliers
- Exhibit 20: Bargaining power of suppliers – Impact of key factors in 2021 and 2026
- 4.4 Threat of new entrants
- Exhibit 21: Threat of new entrants – Impact of key factors in 2021 and 2026
- 4.5 Threat of substitutes
- Exhibit 22: Threat of substitutes – Impact of key factors in 2021 and 2026
- 4.6 Threat of rivalry
- Exhibit 23: Threat of rivalry – Impact of key factors in 2021 and 2026
- 4.7 Market condition
- Exhibit 24: Chart on Market condition - Five forces 2021 and 2026
5 Market Segmentation by Application
- 5.1 Market segments
- Exhibit 25: Chart on Application - Market share 2021-2026 (%)
- Exhibit 26: Data Table on Application - Market share 2021-2026 (%)
- 5.2 Comparison by Application
- Exhibit 27: Chart on Comparison by Application
- Exhibit 28: Data Table on Comparison by Application
- 5.3 Packaging - Market size and forecast 2021-2026
- Exhibit 29: Chart on Packaging - Market size and forecast 2021-2026 ($ million)
- Exhibit 30: Data Table on Packaging - Market size and forecast 2021-2026 ($ million)
- Exhibit 31: Chart on Packaging - Year-over-year growth 2021-2026 (%)
- Exhibit 32: Data Table on Packaging - Year-over-year growth 2021-2026 (%)
- 5.4 Building and construction - Market size and forecast 2021-2026
- Exhibit 33: Chart on Building and construction - Market size and forecast 2021-2026 ($ million)
- Exhibit 34: Data Table on Building and construction - Market size and forecast 2021-2026 ($ million)
- Exhibit 35: Chart on Building and construction - Year-over-year growth 2021-2026 (%)
- Exhibit 36: Data Table on Building and construction - Year-over-year growth 2021-2026 (%)
- 5.5 Furniture and bedding - Market size and forecast 2021-2026
- Exhibit 37: Chart on Furniture and bedding - Market size and forecast 2021-2026 ($ million)
- Exhibit 38: Data Table on Furniture and bedding - Market size and forecast 2021-2026 ($ million)
- Exhibit 39: Chart on Furniture and bedding - Year-over-year growth 2021-2026 (%)
- Exhibit 40: Data Table on Furniture and bedding - Year-over-year growth 2021-2026 (%)
- 5.6 Transportation - Market size and forecast 2021-2026
- Exhibit 41: Chart on Transportation - Market size and forecast 2021-2026 ($ million)
- Exhibit 42: Data Table on Transportation - Market size and forecast 2021-2026 ($ million)
- Exhibit 43: Chart on Transportation - Year-over-year growth 2021-2026 (%)
- Exhibit 44: Data Table on Transportation - Year-over-year growth 2021-2026 (%)
- 5.7 Others - Market size and forecast 2021-2026
- Exhibit 45: Chart on Others - Market size and forecast 2021-2026 ($ million)
- Exhibit 46: Data Table on Others - Market size and forecast 2021-2026 ($ million)
- Exhibit 47: Chart on Others - Year-over-year growth 2021-2026 (%)
- Exhibit 48: Data Table on Others - Year-over-year growth 2021-2026 (%)
- 5.8 Market opportunity by Application
- Exhibit 49: Market opportunity by Application ($ million)
6 Market Segmentation by Type
- 6.1 Market segments
- Exhibit 50: Chart on Type - Market share 2021-2026 (%)
- Exhibit 51: Data Table on Type - Market share 2021-2026 (%)
- 6.2 Comparison by Type
- Exhibit 52: Chart on Comparison by Type
- Exhibit 53: Data Table on Comparison by Type
- 6.3 PU - Market size and forecast 2021-2026
- Exhibit 54: Chart on PU - Market size and forecast 2021-2026 ($ million)
- Exhibit 55: Data Table on PU - Market size and forecast 2021-2026 ($ million)
- Exhibit 56: Chart on PU - Year-over-year growth 2021-2026 (%)
- Exhibit 57: Data Table on PU - Year-over-year growth 2021-2026 (%)
- 6.4 PS - Market size and forecast 2021-2026
- Exhibit 58: Chart on PS - Market size and forecast 2021-2026 ($ million)
- Exhibit 59: Data Table on PS - Market size and forecast 2021-2026 ($ million)
- Exhibit 60: Chart on PS - Year-over-year growth 2021-2026 (%)
- Exhibit 61: Data Table on PS - Year-over-year growth 2021-2026 (%)
- 6.5 PVC - Market size and forecast 2021-2026
- Exhibit 62: Chart on PVC - Market size and forecast 2021-2026 ($ million)
- Exhibit 63: Data Table on PVC - Market size and forecast 2021-2026 ($ million)
- Exhibit 64: Chart on PVC - Year-over-year growth 2021-2026 (%)
- Exhibit 65: Data Table on PVC - Year-over-year growth 2021-2026 (%)
- 6.6 Phenolic - Market size and forecast 2021-2026
- Exhibit 66: Chart on Phenolic - Market size and forecast 2021-2026 ($ million)
- Exhibit 67: Data Table on Phenolic - Market size and forecast 2021-2026 ($ million)
- Exhibit 68: Chart on Phenolic - Year-over-year growth 2021-2026 (%)
- Exhibit 69: Data Table on Phenolic - Year-over-year growth 2021-2026 (%)
- 6.7 Others - Market size and forecast 2021-2026
- Exhibit 70: Chart on Others - Market size and forecast 2021-2026 ($ million)
- Exhibit 71: Data Table on Others - Market size and forecast 2021-2026 ($ million)
- Exhibit 72: Chart on Others - Year-over-year growth 2021-2026 (%)
- Exhibit 73: Data Table on Others - Year-over-year growth 2021-2026 (%)
- 6.8 Market opportunity by Type
- Exhibit 74: Market opportunity by Type ($ million)
7 Customer Landscape
- 7.1 Customer landscape overview
- Exhibit 75: Analysis of price sensitivity, lifecycle, customer purchase basket, adoption rates, and purchase criteria
8 Geographic Landscape
- 8.1 Geographic segmentation
- Exhibit 76: Chart on Market share by geography 2021-2026 (%)
- Exhibit 77: Data Table on Market share by geography 2021-2026 (%)
- 8.2 Geographic comparison
- Exhibit 78: Chart on Geographic comparison
- Exhibit 79: Data Table on Geographic comparison
- 8.3 APAC - Market size and forecast 2021-2026
- Exhibit 80: Chart on APAC - Market size and forecast 2021-2026 ($ million)
- Exhibit 81: Data Table on APAC - Market size and forecast 2021-2026 ($ million)
- Exhibit 82: Chart on APAC - Year-over-year growth 2021-2026 (%)
- Exhibit 83: Data Table on APAC - Year-over-year growth 2021-2026 (%)
- 8.4 North America - Market size and forecast 2021-2026
- Exhibit 84: Chart on North America - Market size and forecast 2021-2026 ($ million)
- Exhibit 85: Data Table on North America - Market size and forecast 2021-2026 ($ million)
- Exhibit 86: Chart on North America - Year-over-year growth 2021-2026 (%)
- Exhibit 87: Data Table on North America - Year-over-year growth 2021-2026 (%)
- 8.5 Europe - Market size and forecast 2021-2026
- Exhibit 88: Chart on Europe - Market size and forecast 2021-2026 ($ million)
- Exhibit 89: Data Table on Europe - Market size and forecast 2021-2026 ($ million)
- Exhibit 90: Chart on Europe - Year-over-year growth 2021-2026 (%)
- Exhibit 91: Data Table on Europe - Year-over-year growth 2021-2026 (%)
- 8.6 Middle East and Africa - Market size and forecast 2021-2026
- Exhibit 92: Chart on Middle East and Africa - Market size and forecast 2021-2026 ($ million)
- Exhibit 93: Data Table on Middle East and Africa - Market size and forecast 2021-2026 ($ million)
- Exhibit 94: Chart on Middle East and Africa - Year-over-year growth 2021-2026 (%)
- Exhibit 95: Data Table on Middle East and Africa - Year-over-year growth 2021-2026 (%)
- 8.7 South America - Market size and forecast 2021-2026
- Exhibit 96: Chart on South America - Market size and forecast 2021-2026 ($ million)
- Exhibit 97: Data Table on South America - Market size and forecast 2021-2026 ($ million)
- Exhibit 98: Chart on South America - Year-over-year growth 2021-2026 (%)
- Exhibit 99: Data Table on South America - Year-over-year growth 2021-2026 (%)
- 8.8 China - Market size and forecast 2021-2026
- Exhibit 100: Chart on China - Market size and forecast 2021-2026 ($ million)
- Exhibit 101: Data Table on China - Market size and forecast 2021-2026 ($ million)
- Exhibit 102: Chart on China - Year-over-year growth 2021-2026 (%)
- Exhibit 103: Data Table on China - Year-over-year growth 2021-2026 (%)
- 8.9 US - Market size and forecast 2021-2026
- Exhibit 104: Chart on US - Market size and forecast 2021-2026 ($ million)
- Exhibit 105: Data Table on US - Market size and forecast 2021-2026 ($ million)
- Exhibit 106: Chart on US - Year-over-year growth 2021-2026 (%)
- Exhibit 107: Data Table on US - Year-over-year growth 2021-2026 (%)
- 8.10 Japan - Market size and forecast 2021-2026
- Exhibit 108: Chart on Japan - Market size and forecast 2021-2026 ($ million)
- Exhibit 109: Data Table on Japan - Market size and forecast 2021-2026 ($ million)
- Exhibit 110: Chart on Japan - Year-over-year growth 2021-2026 (%)
- Exhibit 111: Data Table on Japan - Year-over-year growth 2021-2026 (%)
- 8.11 Germany - Market size and forecast 2021-2026
- Exhibit 112: Chart on Germany - Market size and forecast 2021-2026 ($ million)
- Exhibit 113: Data Table on Germany - Market size and forecast 2021-2026 ($ million)
- Exhibit 114: Chart on Germany - Year-over-year growth 2021-2026 (%)
- Exhibit 115: Data Table on Germany - Year-over-year growth 2021-2026 (%)
- 8.12 India - Market size and forecast 2021-2026
- Exhibit 116: Chart on India - Market size and forecast 2021-2026 ($ million)
- Exhibit 117: Data Table on India - Market size and forecast 2021-2026 ($ million)
- Exhibit 118: Chart on India - Year-over-year growth 2021-2026 (%)
- Exhibit 119: Data Table on India - Year-over-year growth 2021-2026 (%)
- 8.13 Market opportunity by geography
- Exhibit 120: Market opportunity by geography ($ million)
9 Drivers, Challenges, and Trends
- 9.1 Market drivers
- 9.2 Market challenges
- 9.3 Impact of drivers and challenges
- Exhibit 121: Impact of drivers and challenges in 2021 and 2026
- 9.4 Market trends
10 Vendor Landscape
- 10.1 Overview
- 10.2 Vendor landscape
- Exhibit 122: Overview on Criticality of inputs and Factors of differentiation
- 10.3 Landscape disruption
- Exhibit 123: Overview on factors of disruption
- 10.4 Industry risks
- Exhibit 124: Impact of key risks on business
11 Vendor Analysis
- 11.1 Vendors covered
- Exhibit 125: Vendors covered
- 11.2 Market positioning of vendors
- Exhibit 126: Matrix on vendor position and classification
- 11.3 Arkema Group
- Exhibit 127: Arkema Group - Overview
- Exhibit 128: Arkema Group - Business segments
- Exhibit 129: Arkema Group - Key news
- Exhibit 130: Arkema Group - Key offerings
- Exhibit 131: Arkema Group - Segment focus
- 11.4 Armacell International SA
- Exhibit 132: Armacell International SA - Overview
- Exhibit 133: Armacell International SA - Business segments
- Exhibit 134: Armacell International SA - Key offerings
- Exhibit 135: Armacell International SA - Segment focus
- 11.5 BASF SE
- Exhibit 136: BASF SE - Overview
- Exhibit 137: BASF SE - Business segments
- Exhibit 138: BASF SE - Key news
- Exhibit 139: BASF SE - Key offerings
- Exhibit 140: BASF SE - Segment focus
- 11.6 Huntsman International LLC
- Exhibit 141: Huntsman International LLC - Overview
- Exhibit 142: Huntsman International LLC - Business segments
- Exhibit 143: Huntsman International LLC - Key news
- Exhibit 144: Huntsman International LLC - Key offerings
- Exhibit 145: Huntsman International LLC - Segment focus
- 11.7 LANXESS AG
- Exhibit 146: LANXESS AG - Overview
- Exhibit 147: LANXESS AG - Business segments
- Exhibit 148: LANXESS AG - Key offerings
- Exhibit 149: LANXESS AG - Segment focus
- 11.8 RAG-Stiftung
- Exhibit 150: RAG-Stiftung - Overview
- Exhibit 151: RAG-Stiftung - Product / Service
- Exhibit 152: RAG-Stiftung - Key offerings
- 11.9 Rogers Foam Corp.
- Exhibit 153: Rogers Foam Corp. - Overview
- Exhibit 154: Rogers Foam Corp. - Product / Service
- Exhibit 155: Rogers Foam Corp. - Key offerings
- 11.10 The Dow Chemical Co.
- Exhibit 156: The Dow Chemical Co. - Overview
- Exhibit 157: The Dow Chemical Co. - Business segments
- Exhibit 158: The Dow Chemical Co. - Key news
- Exhibit 159: The Dow Chemical Co. - Key offerings
- Exhibit 160: The Dow Chemical Co. - Segment focus
- 11.11 Toray Industries Inc.
- Exhibit 161: Toray Industries Inc. - Overview
- Exhibit 162: Toray Industries Inc. - Business segments
- Exhibit 163: Toray Industries Inc. - Key news
- Exhibit 164: Toray Industries Inc. - Key offerings
- Exhibit 165: Toray Industries Inc. - Segment focus
- 11.12 Tosoh Corp.
- Exhibit 166: Tosoh Corp. - Overview
- Exhibit 167: Tosoh Corp. - Business segments
- Exhibit 168: Tosoh Corp. - Key offerings
- Exhibit 169: Tosoh Corp. - Segment focus
12 Appendix
- 12.1 Scope of the report
- 12.2 Inclusions and exclusions checklist
- Exhibit 170: Inclusions checklist
- Exhibit 171: Exclusions checklist
- 12.3 Currency conversion rates for US$
- Exhibit 172: Currency conversion rates for US$
- 12.4 Research methodology
- Exhibit 173: Research methodology
- Exhibit 174: Validation techniques employed for market sizing
- Exhibit 175: Information sources
- 12.5 List of abbreviations
- Exhibit 176: List of abbreviations
- in crude oil prices: The volatility of crude oil prices is one of the key challenges in the global commodity chemicals market. The volatility of crude oil prices impacts the pricing strategies and margins of adhesives, sealants, lubricants, oilfield cleaners, polymers, as well as plastic additives. The margins of the commodity chemicals are inherently dependent on the global prices of crude oil, which is one of the key raw materials. Any volatility in the prices of crude oil causes uncertainty in end-use markets and eventually influences the margins of all the key stakeholders, including the vendors in the global commodity chemicals market. These fluctuations adversely affect the profitability, cost of sales, and the ability of vendors to effectively address the demands of consumers.
About Us
Technavio is a leading global technology research and advisory company. Their research and analysis focus on emerging market trends and provides actionable insights to help businesses identify market opportunities and develop effective strategies to optimize their market positions. With over 500 specialized analysts, Technavio's report library consists of more than 17,000 reports and counting, covering 800 technologies, spanning across 50 countries. Their client base consists of enterprises of all sizes, including more than 100 Fortune 500 companies. This growing client base relies on Technavio's comprehensive coverage, extensive research, and actionable market insights to identify opportunities in existing and potential markets and assess their competitive positions within changing market scenarios.
Contact
Technavio Research
Jesse Maida
Media & Marketing Executive
US: +1 844 364 1100
UK: +44 203 893 3200
Email: media@technavio.com
Website: www.technavio.com/


SOURCE Technavio
© 2024 Benzinga.com. Benzinga does not provide investment advice. All rights reserved.
Trade confidently with insights and alerts from analyst ratings, free reports and breaking news that affects the stocks you care about.

