


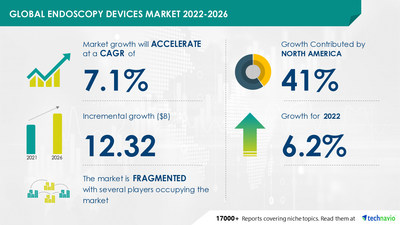
NEW YORK, April 15, 2022 /PRNewswire/ -- The "Endoscopy Devices Market - Competitive Analysis, Drivers, Trends, Challenges & Five Force Analysis" report has been added to Technavio's offering. The endoscopy devices market is estimated to grow by USD 12.32 billion from 2021 to 2026, growing at a CAGR of 7.1% as per the latest market report by Technavio. 41% of the market's growth will originate from North America during the forecast period. The US is the key market for endoscopy devices market in North America. Market growth in this region will be slower than the growth of the market in Asia. The increasing incidence of chronic diseases such as arthritis, GI diseases, and ENT disorders will facilitate the endoscopy devices market growth in North America over the forecast period.

For more insights on the market share of various regions - Download a free sample now!
Market Dynamics
Factors such as the increasing volume of endoscopy procedures coupled with the growing target population, increasing demand for minimally invasive procedures, and the growing demand for video endoscopy systems will drive the growth of the Endoscopy Devices Market However, risks and complications associated with endoscopy might hamper the market growth. The holistic analysis of the drivers, trends & challenges will help in deducing end goals and refining marketing strategies to gain a competitive edge.
Company Profiles
The endoscopy devices market is fragmented and the vendors are deploying growth strategies such as R and D to compete in the market. Some of the companies covered in this report are Arthrex Inc., asap endoscopic products GmbH, B Braun Melsungen AG, Boston Scientific Corp., Conmed Corp., Ecleris, FUJIFILM Holdings Corp., G.I. View Ltd., Hitachi Ltd., Integrated Endoscopy, IntroMedic Co. Ltd., Johnson and Johnson, KARL STORZ SE and Co. KG, Laborie Medical Technologies Corp., Medtronic Plc, Olympus Corp., Optim LLC, Smith and Nephew plc, Stryker Corp., and Schindler Holding Ltd., etc.
Few companies with key offerings
- Bbraun.com - The company offers endoscopy devices that give an indication for laparoscopy, arthroscopy, neuro endoscopy, ENT, gynecology, and urology.
- Conmed.com - The company provides endoscopy devices such as ClearView Endoscopic Ultrasound Aspiration Needle, CleanGuard Disposable Endoscope Valves, CleanCage Endoscope Valve-Tracking System, and CleanTray Endoscope Pre-Cleaning System.
- Jnj.com - The company offers endoscopy devices such as ENDOPATH Bipolar Forceps, ENDOPATH Active Cords, ENDOPATH Scissors, ENDOPATH Graspers, ENDOPATH Bipolar Forceps, ENDOPATH Babcocks, and ENDOPOUCH Specimen Retrieval Bag.
- Giview.com -The company deals with endoscopy products for gastrointestinal applications based on visualization and self-propelled pneumatic intubation technology, including the disposable Aer-O-Scope colonoscope.
- Intromedic.com -The company deals with the development of medical devices and offers capsule endoscope system MiroCam, ductile video esophagoscope E.G.Scan, and absorbent hemostasis equipment for internal body EndoClot.
- To know about all major vendors with their offerings - Download a free sample now!
Competitive Analysis
The report includes the competitive analysis, a proprietary tool to analyze and evaluate the position of companies based on their industry position score and market performance score. The tool uses various factors for categorizing the players into four categories. Some of these factors considered for analysis are financial performance over the last 3 years, growth strategies, innovation score, new product launches, investments, growth in market share, etc.
Segmentation Analysis
- By Application, the market is classified as laparoscopy, GI, and others
- By Product, the market is classified as endoscopy and accessories, and others.
- By Geography, the market is classified as North America, Europe, Asia, and the Rest of the World (ROW).
To know about the market contribution of each segment - Download a free sample now!
Related Reports -
- The urology devices market share is expected to increase by USD 14.70 billion from 2021 to 2026, and the market's growth momentum will accelerate at a CAGR of 6.7%. Download a free sample now!
- The transcranial doppler market share is expected to increase by USD 32.42 million from 2021 to 2026, at a CAGR of 6.45%. Download a free sample now!
Endoscopy Devices Market Scope | |
Report Coverage | Details |
Page number | 120 |
Base year | 2021 |
Forecast period | 2022-2026 |
Growth momentum & CAGR | Accelerate at a CAGR of 7.1% |
Market growth 2022-2026 | USD 12.32 billion |
Market structure | Fragmented |
YoY growth (%) | 6.2 |
Performing market contribution | North America at 41% |
Competitive landscape | Leading companies, competitive strategies, consumer engagement scope |
Companies profiled | Arthrex Inc., asap endoscopic products GmbH, B Braun Melsungen AG, Boston Scientific Corp., Conmed Corp., Ecleris, FUJIFILM Holdings Corp., G.I. View Ltd., Hitachi Ltd., Integrated Endoscopy, IntroMedic Co. Ltd., Johnson and Johnson, KARL STORZ SE and Co. KG, Laborie Medical Technologies Corp., Medtronic Plc, Olympus Corp., Optim LLC, Smith and Nephew plc, Stryker Corp., and Schindler Holding Ltd. |
Market Dynamics | Parent market analysis, Market growth inducers and obstacles, Fast-growing and slow-growing segment analysis, COVID 19 impact and future consumer dynamics, market condition analysis for forecast period, |
Customization purview | If our report has not included the data that you are looking for, you can reach out to our analysts and get segments customized. |
Table of Content
1 Executive Summary
- 1.1 Market overview
- Exhibit 01: Executive Summary – Chart on Market Overview
- Exhibit 02: Executive Summary – Data Table on Market Overview
- Exhibit 03: Executive Summary – Chart on Global Market Characteristics
- Exhibit 04: Executive Summary – Chart on Market by Geography
- Exhibit 05: Executive Summary – Chart on Market Segmentation by Application
- Exhibit 06: Executive Summary – Chart on Market Segmentation by Product
- Exhibit 07: Executive Summary – Chart on Incremental Growth
- Exhibit 08: Executive Summary – Data Table on Incremental Growth
- Exhibit 09: Executive Summary – Chart on Vendor Market Positioning
2 Market Landscape
- 2.1 Market ecosystem
- Exhibit 10: Parent market
- Exhibit 11: Market Characteristics
3 Market Sizing
- 3.1 Market definition
- Exhibit 12: Offerings of vendors included in the market definition
- 3.2 Market segment analysis
- Exhibit 13: Market segments
- 3.3 Market size 2021
- 3.4 Market outlook: Forecast for 2021-2026
- Exhibit 14: Chart on Global - Market size and forecast 2021-2026 ($ million)
- Exhibit 15: Data Table on Global - Market size and forecast 2021-2026 ($ million)
- Exhibit 16: Chart on Global Market: Year-over-year growth 2021-2026 (%)
- Exhibit 17: Data Table on Global Market: Year-over-year growth 2021-2026 (%)
4 Five Forces Analysis
- 4.1 Five forces summary
- Exhibit 18: Five forces analysis - Comparison between2021 and 2026
- 4.2 Bargaining power of buyers
- Exhibit 19: Chart on Bargaining power of buyers – Impact of key factors 2021 and 2026
- 4.3 Bargaining power of suppliers
- Exhibit 20: Bargaining power of suppliers – Impact of key factors in 2021 and 2026
- 4.4 Threat of new entrants
- Exhibit 21: Threat of new entrants – Impact of key factors in 2021 and 2026
- 4.5 Threat of substitutes
- Exhibit 22: Threat of substitutes – Impact of key factors in 2021 and 2026
- 4.6 Threat of rivalry
- Exhibit 23: Threat of rivalry – Impact of key factors in 2021 and 2026
- 4.7 Market condition
- Exhibit 24: Chart on Market condition - Five forces 2021 and 2026
5 Market Segmentation by Application
- 5.1 Market segments
- Exhibit 25: Chart on Application - Market share 2021-2026 (%)
- Exhibit 26: Data Table on Application - Market share 2021-2026 (%)
- 5.2 Comparison by Application
- Exhibit 27: Chart on Comparison by Application
- Exhibit 28: Data Table on Comparison by Application
- 5.3 Laproscopy - Market size and forecast 2021-2026
- Exhibit 29: Chart on Laproscopy - Market size and forecast 2021-2026 ($ million)
- Exhibit 30: Data Table on Laproscopy - Market size and forecast 2021-2026 ($ million)
- Exhibit 31: Chart on Laproscopy - Year-over-year growth 2021-2026 (%)
- Exhibit 32: Data Table on Laproscopy - Year-over-year growth 2021-2026 (%)
- 5.4 GI - Market size and forecast 2021-2026
- Exhibit 33: Chart on GI - Market size and forecast 2021-2026 ($ million)
- Exhibit 34: Data Table on GI - Market size and forecast 2021-2026 ($ million)
- Exhibit 35: Chart on GI - Year-over-year growth 2021-2026 (%)
- Exhibit 36: Data Table on GI - Year-over-year growth 2021-2026 (%)
- 5.5 Others - Market size and forecast 2021-2026
- Exhibit 37: Chart on Others - Market size and forecast 2021-2026 ($ million)
- Exhibit 38: Data Table on Others - Market size and forecast 2021-2026 ($ million)
- Exhibit 39: Chart on Others - Year-over-year growth 2021-2026 (%)
- Exhibit 40: Data Table on Others - Year-over-year growth 2021-2026 (%)
- 5.6 Market opportunity by Application
- Exhibit 41: Market opportunity by Application ($ million)
6 Market Segmentation by Product
- 6.1 Market segments
- Exhibit 42: Chart on Product - Market share 2021-2026 (%)
- Exhibit 43: Data Table on Product - Market share 2021-2026 (%)
- 6.2 Comparison by Product
- Exhibit 44: Chart on Comparison by Product
- Exhibit 45: Data Table on Comparison by Product
- 6.3 Endoscopes - Market size and forecast 2021-2026
- Exhibit 46: Chart on Endoscopes - Market size and forecast 2021-2026 ($ million)
- Exhibit 47: Data Table on Endoscopes - Market size and forecast 2021-2026 ($ million)
- Exhibit 48: Chart on Endoscopes - Year-over-year growth 2021-2026 (%)
- Exhibit 49: Data Table on Endoscopes - Year-over-year growth 2021-2026 (%)
- 6.4 Accessories and others - Market size and forecast 2021-2026
- Exhibit 50: Chart on Accessories and others - Market size and forecast 2021-2026 ($ million)
- Exhibit 51: Data Table on Accessories and others - Market size and forecast 2021-2026 ($ million)
- Exhibit 52: Chart on Accessories and others - Year-over-year growth 2021-2026 (%)
- Exhibit 53: Data Table on Accessories and others - Year-over-year growth 2021-2026 (%)
- 6.5 Market opportunity by Product
- Exhibit 54: Market opportunity by Product ($ million)
7 Customer Landscape
- 7.1 Customer landscape overview
- Exhibit 55: Analysis of price sensitivity, lifecycle, customer purchase basket, adoption rates, and purchase criteria
8 Geographic Landscape
- 8.1 Geographic segmentation
- Exhibit 56: Chart on Market share by geography 2021-2026 (%)
- Exhibit 57: Data Table on Market share by geography 2021-2026 (%)
- 8.2 Geographic comparison
- Exhibit 58: Chart on Geographic comparison
- Exhibit 59: Data Table on Geographic comparison
- 8.3 North America - Market size and forecast 2021-2026
- Exhibit 60: Chart on North America - Market size and forecast 2021-2026 ($ million)
- Exhibit 61: Data Table on North America - Market size and forecast 2021-2026 ($ million)
- Exhibit 62: Chart on North America - Year-over-year growth 2021-2026 (%)
- Exhibit 63: Data Table on North America - Year-over-year growth 2021-2026 (%)
- 8.4 Europe - Market size and forecast 2021-2026
- Exhibit 64: Chart on Europe - Market size and forecast 2021-2026 ($ million)
- Exhibit 65: Data Table on Europe - Market size and forecast 2021-2026 ($ million)
- Exhibit 66: Chart on Europe - Year-over-year growth 2021-2026 (%)
- Exhibit 67: Data Table on Europe - Year-over-year growth 2021-2026 (%)
- 8.5 Asia - Market size and forecast 2021-2026
- Exhibit 68: Chart on Asia - Market size and forecast 2021-2026 ($ million)
- Exhibit 69: Data Table on Asia - Market size and forecast 2021-2026 ($ million)
- Exhibit 70: Chart on Asia - Year-over-year growth 2021-2026 (%)
- Exhibit 71: Data Table on Asia - Year-over-year growth 2021-2026 (%)
- 8.6 Rest of World (ROW) - Market size and forecast 2021-2026
- Exhibit 72: Chart on Rest of World (ROW) - Market size and forecast 2021-2026 ($ million)
- Exhibit 73: Data Table on Rest of World (ROW) - Market size and forecast 2021-2026 ($ million)
- Exhibit 74: Chart on Rest of World (ROW) - Year-over-year growth 2021-2026 (%)
- Exhibit 75: Data Table on Rest of World (ROW) - Year-over-year growth 2021-2026 (%)
- 8.7 US - Market size and forecast 2021-2026
- Exhibit 76: Chart on US - Market size and forecast 2021-2026 ($ million)
- Exhibit 77: Data Table on US - Market size and forecast 2021-2026 ($ million)
- Exhibit 78: Chart on US - Year-over-year growth 2021-2026 (%)
- Exhibit 79: Data Table on US - Year-over-year growth 2021-2026 (%)
- 8.8 Germany - Market size and forecast 2021-2026
- Exhibit 80: Chart on Germany - Market size and forecast 2021-2026 ($ million)
- Exhibit 81: Data Table on Germany - Market size and forecast 2021-2026 ($ million)
- Exhibit 82: Chart on Germany - Year-over-year growth 2021-2026 (%)
- Exhibit 83: Data Table on Germany - Year-over-year growth 2021-2026 (%)
- 8.9 UK - Market size and forecast 2021-2026
- Exhibit 84: Chart on UK - Market size and forecast 2021-2026 ($ million)
- Exhibit 85: Data Table on UK - Market size and forecast 2021-2026 ($ million)
- Exhibit 86: Chart on UK - Year-over-year growth 2021-2026 (%)
- Exhibit 87: Data Table on UK - Year-over-year growth 2021-2026 (%)
- 8.10 China - Market size and forecast 2021-2026
- Exhibit 88: Chart on China - Market size and forecast 2021-2026 ($ million)
- Exhibit 89: Data Table on China - Market size and forecast 2021-2026 ($ million)
- Exhibit 90: Chart on China - Year-over-year growth 2021-2026 (%)
- Exhibit 91: Data Table on China - Year-over-year growth 2021-2026 (%)
- 8.11 Japan - Market size and forecast 2021-2026
- Exhibit 92: Chart on Japan - Market size and forecast 2021-2026 ($ million)
- Exhibit 93: Data Table on Japan - Market size and forecast 2021-2026 ($ million)
- Exhibit 94: Chart on Japan - Year-over-year growth 2021-2026 (%)
- Exhibit 95: Data Table on Japan - Year-over-year growth 2021-2026 (%)
- 8.12 Market opportunity by geography
- Exhibit 96: Market opportunity by geography ($ million)
9 Drivers, Challenges, and Trends
- 9.1 Market drivers
- 9.2 Market challenges
- 9.3 Impact of drivers and challenges
- Exhibit 97: Impact of drivers and challenges in 2021 and 2026
- 9.4 Market trends
10 Vendor Landscape
- 10.1 Overview
- 10.2 Vendor landscape
- Exhibit 98: Overview on Criticality of inputs and Factors of differentiation
- 10.3 Landscape disruption
- Exhibit 99: Overview on factors of disruption
- 10.4 Industry risks
- Exhibit 100: Impact of key risks on business
11 Vendor Analysis
- 11.1 Vendors covered
- Exhibit 101: Vendors covered
- 11.2 Market positioning of vendors
- Exhibit 102: Matrix on vendor position and classification
- 11.3 Arthrex Inc.
- Exhibit 103: Arthrex Inc. - Overview
- Exhibit 104: Arthrex Inc. - Product / Service
- Exhibit 105: Arthrex Inc. - Key offerings
- 11.4 B Braun Melsungen AG
- Exhibit 106: B Braun Melsungen AG - Overview
- Exhibit 107: B Braun Melsungen AG - Business segments
- Exhibit 108: B Braun Melsungen AG - Key news
- Exhibit 109: B Braun Melsungen AG - Key offerings
- Exhibit 110: B Braun Melsungen AG - Segment focus
- 11.5 Conmed Corp.
- Exhibit 111: Conmed Corp. - Overview
- Exhibit 112: Conmed Corp. - Business segments
- Exhibit 113: Conmed Corp. - Key offerings
- Exhibit 114: Conmed Corp. - Segment focus
- 11.6 Johnson and Johnson
- Exhibit 115: Johnson and Johnson - Overview
- Exhibit 116: Johnson and Johnson - Business segments
- Exhibit 117: Johnson and Johnson - Key news
- Exhibit 118: Johnson and Johnson - Key offerings
- Exhibit 119: Johnson and Johnson - Segment focus
- 11.7 KARL STORZ SE and Co. KG
- Exhibit 120: KARL STORZ SE and Co. KG - Overview
- Exhibit 121: KARL STORZ SE and Co. KG - Product / Service
- Exhibit 122: KARL STORZ SE and Co. KG - Key news
- Exhibit 123: KARL STORZ SE and Co. KG - Key offerings
- 11.8 Medtronic Plc
- Exhibit 124: Medtronic Plc - Overview
- Exhibit 125: Medtronic Plc - Business segments
- Exhibit 126: Medtronic Plc - Key news
- Exhibit 127: Medtronic Plc - Key offerings
- Exhibit 128: Medtronic Plc - Segment focus
- 11.9 Olympus Corp.
- Exhibit 129: Olympus Corp. - Overview
- Exhibit 130: Olympus Corp. - Business segments
- Exhibit 131: Olympus Corp. - Key news
- Exhibit 132: Olympus Corp. - Key offerings
- Exhibit 133: Olympus Corp. - Segment focus
- 11.10 Schindler Holding Ltd.
- Exhibit 134: Schindler Holding Ltd. - Overview
- Exhibit 135: Schindler Holding Ltd. - Product / Service
- Exhibit 136: Schindler Holding Ltd. - Key news
- Exhibit 137: Schindler Holding Ltd. - Key offerings
- 11.11 Smith and Nephew plc
- Exhibit 138: Smith and Nephew plc - Overview
- Exhibit 139: Smith and Nephew plc - Business segments
- Exhibit 140: Smith and Nephew plc - Key news
- Exhibit 141: Smith and Nephew plc - Key offerings
- Exhibit 142: Smith and Nephew plc - Segment focus
- 11.12 Stryker Corp.
- Exhibit 143: Stryker Corp. - Overview
- Exhibit 144: Stryker Corp. - Business segments
- Exhibit 145: Stryker Corp. - Key news
- Exhibit 146: Stryker Corp. - Key offerings
- Exhibit 147: Stryker Corp. - Segment focus
12 Appendix
- 12.1 Scope of the report
- 12.2 Inclusions and exclusions checklist
- Exhibit 148: Inclusions checklist
- Exhibit 149: Exclusions checklist
- 12.3 Currency conversion rates for US$
- Exhibit 150: Currency conversion rates for US$
- 12.4 Research methodology
- Exhibit 151: Research methodology
- Exhibit 152: Validation techniques employed for market sizing
- Exhibit 153: Information sources
- 12.5 List of abbreviations
- Exhibit 154: List of abbreviations
About Us
Technavio is a leading global technology research and advisory company. Their research and analysis focus on emerging market trends and provide actionable insights to help businesses identify market opportunities and develop effective strategies to optimize their market positions. With over 500 specialized analysts, Technavio's report library consists of more than 17,000 reports and counting, covering 800 technologies, spanning 50 countries. Their client base consists of enterprises of all sizes, including more than 100 Fortune 500 companies. This growing client base relies on Technavio's comprehensive coverage, extensive research, and actionable market insights to identify opportunities in existing and potential markets and assess their competitive positions within changing market scenarios.
Contact
Technavio Research
Jesse Maida
Media & Marketing Executive
US: +1 844 364 1100
UK: +44 203 893 3200
Email: media@technavio.com
Website: www.technavio.com/


SOURCE Technavio
© 2024 Benzinga.com. Benzinga does not provide investment advice. All rights reserved.
Trade confidently with insights and alerts from analyst ratings, free reports and breaking news that affects the stocks you care about.

