


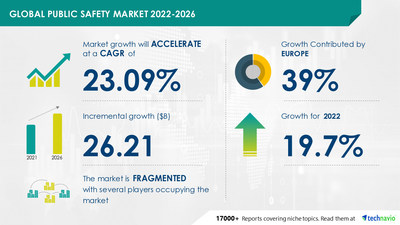
NEW YORK, April 13, 2022 /PRNewswire/ -- Public Safety Market by Deployment and Geography - Forecast and Analysis 2022-2026 report has been added to Technavio's offering. The report expects the market to observe an incremental growth of USD 26.21 billion between 2021 and 2026, expanding at a CAGR of 23.09% during the forecast period. According to the report, the market will observe the highest growth in Europe. The increased demand for efficient public safety operations is creating significant growth opportunities for market players.

Download a Free Sample Report Now for highlights on market size, growth opportunities, and other important statistics.
Market Dynamics
The market is driven by factors such as the adoption of machine learning and AI-based public safety solution, governmental regulations for industrial safety, and the rising infiltration activities and criminal activities. On the other hand, public safety in natural and man-made disasters might hamper market growth.
Company Profiles
Some of the companies covered in this report are Atos SE, CentralSquare, Cisco Systems Inc., Environmental Systems Research Institute Inc., General Dynamics Corp., Hexagon AB, Honeywell International Inc., Huawei Investment and Holding Co. Ltd., International Business Machines Corp., L3Harris Technologies Inc., Motorola Solutions Inc., NEC Corp., NICE Ltd., Northrop Grumman Corp., Nuance Communications Inc., OSI Systems Inc., Sun Ridge Systems Inc., Tandu Technologies and Security Systems Ltd., Telefonaktiebolaget LM Ericsson, and Telstra Corp. Ltd.
Competitive Analysis
The global public safety market is fragmented. The competitive rivalry among existing players in the public safety market ranges from moderate to high, and it is expected to increase when new competitors enter the market. Vendors are adopting acquisitions, partnerships with industry participants, and new product/service rollouts as important competitive strategies.
The report includes the competitive analysis which analyzes and evaluates the position of companies based on their industry position score and market performance score. The tool uses various factors for categorizing the players into four categories. Some of the factors considered for analysis are financial performance over the last 3 years, growth strategies, innovation score, new product launches, investments, growth in market share, etc.
Market Segmentation by Deployment
- By Deployment, the market is classified into cloud and on-premise segments.
- The cloud segment will have the largest share of the market.
- Cloud solutions offer various benefits, which is driving the growth of the segment.
- The market growth in the segment will be significant during the forecast period.
Market Segmentation by Geography
- By Geography, the market is analyzed across Europe, North America, APAC, South America, and the Middle East and Africa.
- Europe will have the largest share of the market.
- The region currently holds 39% of the global market share.
- Germany and the UK are the key markets for public safety in Europe.
- The increasing threat of global terrorism in Europe is driving the growth of the regional market.
- However, the market growth in this region will be slower than the growth of the market in APAC.
Purchase our full report for a comprehensive analysis of recent developments, new product launches, major revenue-generating segments, and market behavior across geographies.
Read Our Free Sample Report before purchasing.
Related Reports:
Wireless Fire Detection System Market by End-user and Geography - Forecast and Analysis 2022-2026
Public Safety Market Scope | |
Report Coverage | Details |
Page number | 120 |
Base year | 2021 |
Forecast period | 2022-2026 |
Growth momentum & CAGR | Accelerate at a CAGR of 23.09% |
Market growth 2022-2026 | USD 26.21 billion |
Market structure | Fragmented |
YoY growth (%) | 19.7 |
Regional analysis | Europe, North America, APAC, South America, and Middle East and Africa |
Performing market contribution | Europe at 39% |
Key consumer countries | US, China, India, Germany, and UK |
Competitive landscape | Leading companies, competitive strategies, consumer engagement scope |
Companies profiled | Atos SE, CentralSquare, Cisco Systems Inc., Environmental Systems Research Institute Inc., General Dynamics Corp., Hexagon AB, Honeywell International Inc., Huawei Investment and Holding Co. Ltd., International Business Machines Corp., L3Harris Technologies Inc., Motorola Solutions Inc., NEC Corp., NICE Ltd., Northrop Grumman Corp., Nuance Communications Inc., OSI Systems Inc., Sun Ridge Systems Inc., Tandu Technologies and Security Systems Ltd., Telefonaktiebolaget LM Ericsson, and Telstra Corp. Ltd. |
Market Dynamics | Parent market analysis, Market growth inducers and obstacles, Fast-growing and slow-growing segment analysis, COVID 19 impact and future consumer dynamics, market condition analysis for forecast period. |
Customization purview | If our report has not included the data that you are looking for, you can reach out to our analysts and get segments customized. |
Table of Contents:
1 Executive Summary
- 1.1 Market overview
- Exhibit 01: Executive Summary – Chart on Market Overview
- Exhibit 02: Executive Summary – Data Table on Market Overview
- Exhibit 03: Executive Summary – Chart on Global Market Characteristics
- Exhibit 04: Executive Summary – Chart on Market by Geography
- Exhibit 05: Executive Summary – Chart on Market Segmentation by Deployment
- Exhibit 06: Executive Summary – Chart on Incremental Growth
- Exhibit 07: Executive Summary – Data Table on Incremental Growth
- Exhibit 08: Executive Summary – Chart on Vendor Market Positioning
2 Market Landscape
- 2.1 Market ecosystem
- Exhibit 09: Parent market
- Exhibit 10: Market Characteristics
3 Market Sizing
- 3.1 Market definition
- Exhibit 11: Offerings of vendors included in the market definition
- 3.2 Market segment analysis
- Exhibit 12: Market segments
- 3.3 Market size 2021
- 3.4 Market outlook: Forecast for 2021-2026
- Exhibit 13: Chart on Global - Market size and forecast 2021-2026 ($ million)
- Exhibit 14: Data Table on Global - Market size and forecast 2021-2026 ($ million)
- Exhibit 15: Chart on Global Market: Year-over-year growth 2021-2026 (%)
- Exhibit 16: Data Table on Global Market: Year-over-year growth 2021-2026 (%)
4 Five Forces Analysis
- 4.1 Five forces summary
- Exhibit 17: Five forces analysis - Comparison between2021 and 2026
- 4.2 Bargaining power of buyers
- Exhibit 18: Chart on Bargaining power of buyers – Impact of key factors 2021 and 2026
- 4.3 Bargaining power of suppliers
- Exhibit 19: Bargaining power of suppliers – Impact of key factors in 2021 and 2026
- 4.4 Threat of new entrants
- Exhibit 20: Threat of new entrants – Impact of key factors in 2021 and 2026
- 4.5 Threat of substitutes
- Exhibit 21: Threat of substitutes – Impact of key factors in 2021 and 2026
- 4.6 Threat of rivalry
- Exhibit 22: Threat of rivalry – Impact of key factors in 2021 and 2026
- 4.7 Market condition
- Exhibit 23: Chart on Market condition - Five forces 2021 and 2026
5 Market Segmentation by Deployment
- 5.1 Market segments
- Exhibit 24: Chart on Deployment - Market share 2021-2026 (%)
- Exhibit 25: Data Table on Deployment - Market share 2021-2026 (%)
- 5.2 Comparison by Deployment
- Exhibit 26: Chart on Comparison by Deployment
- Exhibit 27: Data Table on Comparison by Deployment
- 5.3 Cloud - Market size and forecast 2021-2026
- Exhibit 28: Chart on Cloud - Market size and forecast 2021-2026 ($ million)
- Exhibit 29: Data Table on Cloud - Market size and forecast 2021-2026 ($ million)
- Exhibit 30: Chart on Cloud - Year-over-year growth 2021-2026 (%)
- Exhibit 31: Data Table on Cloud - Year-over-year growth 2021-2026 (%)
- 5.4 On-premise - Market size and forecast 2021-2026
- Exhibit 32: Chart on On-premise - Market size and forecast 2021-2026 ($ million)
- Exhibit 33: Data Table on On-premise - Market size and forecast 2021-2026 ($ million)
- Exhibit 34: Chart on On-premise - Year-over-year growth 2021-2026 (%)
- Exhibit 35: Data Table on On-premise - Year-over-year growth 2021-2026 (%)
- 5.5 Market opportunity by Deployment
- Exhibit 36: Market opportunity by Deployment ($ million)
6 Customer Landscape
- 6.1 Customer landscape overview
- Exhibit 37: Analysis of price sensitivity, lifecycle, customer purchase basket, adoption rates, and purchase criteria
7 Geographic Landscape
- 7.1 Geographic segmentation
- Exhibit 38: Chart on Market share by geography 2021-2026 (%)
- Exhibit 39: Data Table on Market share by geography 2021-2026 (%)
- 7.2 Geographic comparison
- Exhibit 40: Chart on Geographic comparison
- Exhibit 41: Data Table on Geographic comparison
- 7.3 Europe - Market size and forecast 2021-2026
- Exhibit 42: Chart on Europe - Market size and forecast 2021-2026 ($ million)
- Exhibit 43: Data Table on Europe - Market size and forecast 2021-2026 ($ million)
- Exhibit 44: Chart on Europe - Year-over-year growth 2021-2026 (%)
- Exhibit 45: Data Table on Europe - Year-over-year growth 2021-2026 (%)
- 7.4 North America - Market size and forecast 2021-2026
- Exhibit 46: Chart on North America - Market size and forecast 2021-2026 ($ million)
- Exhibit 47: Data Table on North America - Market size and forecast 2021-2026 ($ million)
- Exhibit 48: Chart on North America - Year-over-year growth 2021-2026 (%)
- Exhibit 49: Data Table on North America - Year-over-year growth 2021-2026 (%)
- 7.5 APAC - Market size and forecast 2021-2026
- Exhibit 50: Chart on APAC - Market size and forecast 2021-2026 ($ million)
- Exhibit 51: Data Table on APAC - Market size and forecast 2021-2026 ($ million)
- Exhibit 52: Chart on APAC - Year-over-year growth 2021-2026 (%)
- Exhibit 53: Data Table on APAC - Year-over-year growth 2021-2026 (%)
- 7.6 South America - Market size and forecast 2021-2026
- Exhibit 54: Chart on South America - Market size and forecast 2021-2026 ($ million)
- Exhibit 55: Data Table on South America - Market size and forecast 2021-2026 ($ million)
- Exhibit 56: Chart on South America - Year-over-year growth 2021-2026 (%)
- Exhibit 57: Data Table on South America - Year-over-year growth 2021-2026 (%)
- 7.7 Middle East and Africa - Market size and forecast 2021-2026
- Exhibit 58: Chart on Middle East and Africa - Market size and forecast 2021-2026 ($ million)
- Exhibit 59: Data Table on Middle East and Africa - Market size and forecast 2021-2026 ($ million)
- Exhibit 60: Chart on Middle East and Africa - Year-over-year growth 2021-2026 (%)
- Exhibit 61: Data Table on Middle East and Africa - Year-over-year growth 2021-2026 (%)
- 7.8 Germany - Market size and forecast 2021-2026
- Exhibit 62: Chart on Germany - Market size and forecast 2021-2026 ($ million)
- Exhibit 63: Data Table on Germany - Market size and forecast 2021-2026 ($ million)
- Exhibit 64: Chart on Germany - Year-over-year growth 2021-2026 (%)
- Exhibit 65: Data Table on Germany - Year-over-year growth 2021-2026 (%)
- 7.9 UK - Market size and forecast 2021-2026
- Exhibit 66: Chart on UK - Market size and forecast 2021-2026 ($ million)
- Exhibit 67: Data Table on UK - Market size and forecast 2021-2026 ($ million)
- Exhibit 68: Chart on UK - Year-over-year growth 2021-2026 (%)
- Exhibit 69: Data Table on UK - Year-over-year growth 2021-2026 (%)
- 7.10 US - Market size and forecast 2021-2026
- Exhibit 70: Chart on US - Market size and forecast 2021-2026 ($ million)
- Exhibit 71: Data Table on US - Market size and forecast 2021-2026 ($ million)
- Exhibit 72: Chart on US - Year-over-year growth 2021-2026 (%)
- Exhibit 73: Data Table on US - Year-over-year growth 2021-2026 (%)
- 7.11 China - Market size and forecast 2021-2026
- Exhibit 74: Chart on China - Market size and forecast 2021-2026 ($ million)
- Exhibit 75: Data Table on China - Market size and forecast 2021-2026 ($ million)
- Exhibit 76: Chart on China - Year-over-year growth 2021-2026 (%)
- Exhibit 77: Data Table on China - Year-over-year growth 2021-2026 (%)
- 7.12 India - Market size and forecast 2021-2026
- Exhibit 78: Chart on India - Market size and forecast 2021-2026 ($ million)
- Exhibit 79: Data Table on India - Market size and forecast 2021-2026 ($ million)
- Exhibit 80: Chart on India - Year-over-year growth 2021-2026 (%)
- Exhibit 81: Data Table on India - Year-over-year growth 2021-2026 (%)
- 7.13 Market opportunity by geography
- Exhibit 82: Market opportunity by geography ($ million)
8 Drivers, Challenges, and Trends
- 8.1 Market drivers
- 8.2 Market challenges
- 8.3 Impact of drivers and challenges
- Exhibit 83: Impact of drivers and challenges in 2021 and 2026
- 8.4 Market trends
9 Vendor Landscape
- 9.1 Overview
- 9.2 Vendor landscape
- Exhibit 84: Overview on Criticality of inputs and Factors of differentiation
- 9.3 Landscape disruption
- Exhibit 85: Overview on factors of disruption
- 9.4 Industry risks
- Exhibit 86: Impact of key risks on business
10 Vendor Analysis
- 10.1 Vendors covered
- Exhibit 87: Vendors covered
- 10.2 Market positioning of vendors
- Exhibit 88: Matrix on vendor position and classification
- 10.3 Atos SE
- Exhibit 89: Atos SE - Overview
- Exhibit 90: Atos SE - Business segments
- Exhibit 91: Atos SE - Key news
- Exhibit 92: Atos SE - Key offerings
- Exhibit 93: Atos SE - Segment focus
- 10.4 CentralSquare
- Exhibit 94: CentralSquare - Overview
- Exhibit 95: CentralSquare - Product / Service
- Exhibit 96: CentralSquare - Key offerings
- 10.5 Cisco Systems Inc.
- Exhibit 97: Cisco Systems Inc. - Overview
- Exhibit 98: Cisco Systems Inc. - Business segments
- Exhibit 99: Cisco Systems Inc. - Key news
- Exhibit 100: Cisco Systems Inc. - Key offerings
- Exhibit 101: Cisco Systems Inc. - Segment focus
- 10.6 General Dynamics Corp.
- Exhibit 102: General Dynamics Corp. - Overview
- Exhibit 103: General Dynamics Corp. - Business segments
- Exhibit 104: General Dynamics Corp. - Key news
- Exhibit 105: General Dynamics Corp. - Key offerings
- Exhibit 106: General Dynamics Corp. - Segment focus
- 10.7 Hexagon AB
- Exhibit 107: Hexagon AB - Overview
- Exhibit 108: Hexagon AB - Business segments
- Exhibit 109: Hexagon AB - Key news
- Exhibit 110: Hexagon AB - Key offerings
- Exhibit 111: Hexagon AB - Segment focus
- 10.8 International Business Machines Corp.
- Exhibit 112: International Business Machines Corp. - Overview
- Exhibit 113: International Business Machines Corp. - Business segments
- Exhibit 114: International Business Machines Corp. - Key offerings
- Exhibit 115: International Business Machines Corp. - Segment focus
- 10.9 L3Harris Technologies Inc.
- Exhibit 116: L3Harris Technologies Inc. - Overview
- Exhibit 117: L3Harris Technologies Inc. - Business segments
- Exhibit 118: L3Harris Technologies Inc. - Key news
- Exhibit 119: L3Harris Technologies Inc. - Key offerings
- Exhibit 120: L3Harris Technologies Inc. - Segment focus
- 10.10 Motorola Solutions Inc.
- Exhibit 121: Motorola Solutions Inc. - Overview
- Exhibit 122: Motorola Solutions Inc. - Business segments
- Exhibit 123: Motorola Solutions Inc. - Key offerings
- Exhibit 124: Motorola Solutions Inc. - Segment focus
- 10.11 NEC Corp.
- Exhibit 125: NEC Corp. - Overview
- Exhibit 126: NEC Corp. - Business segments
- Exhibit 127: NEC Corp. - Key news
- Exhibit 128: NEC Corp. - Key offerings
- Exhibit 129: NEC Corp. - Segment focus
- 10.12 Telefonaktiebolaget LM Ericsson
- Exhibit 130: Telefonaktiebolaget LM Ericsson - Overview
- Exhibit 131: Telefonaktiebolaget LM Ericsson - Business segments
- Exhibit 132: Telefonaktiebolaget LM Ericsson - Key news
- Exhibit 133: Telefonaktiebolaget LM Ericsson - Key offerings
- Exhibit 134: Telefonaktiebolaget LM Ericsson - Segment focus
11 Appendix
- 11.1 Scope of the report
- 11.2 Inclusions and exclusions checklist
- Exhibit 135: Inclusions checklist
- Exhibit 136: Exclusions checklist
- 11.3 Currency conversion rates for US$
- Exhibit 137: Currency conversion rates for US$
- 11.4 Research methodology
- Exhibit 138: Research methodology
- Exhibit 139: Validation techniques employed for market sizing
- Exhibit 140: Information sources
- 11.5 List of abbreviations
- Exhibit 141: List of abbreviations
About Us
Technavio is a leading global technology research and advisory company. Their research and analysis focus on emerging market trends and provides actionable insights to help businesses identify market opportunities and develop effective strategies to optimize their market positions. With over 500 specialized analysts, Technavio's report library consists of more than 17,000 reports and counting, covering 800 technologies, spanning across 50 countries. Their client base consists of enterprises of all sizes, including more than 1 00 Fortune 500 companies. This growing client base relies on Technavio's comprehensive coverage, extensive research, and actionable market insights to identify opportunities in existing and potential markets and assess their competitive positions within changing market scenarios.
Contact
Technavio Research
Jesse Maida
Media & Marketing Executive
US: +1 844 364 1100
UK: +44 203 893 3200
Email: media@technavio.com
Website: www.technavio.com/


SOURCE Technavio
© 2024 Benzinga.com. Benzinga does not provide investment advice. All rights reserved.
Trade confidently with insights and alerts from analyst ratings, free reports and breaking news that affects the stocks you care about.

