


CALGARY, Alberta, Nov. 02, 2018 (GLOBE NEWSWIRE) -- Baytex Energy Corp. ("Baytex") (((TSX, NYSE:BTE) reports its operating and financial results for the three and nine months ended September 30, 2018 (all amounts are in Canadian dollars unless otherwise noted).
|
|||
"Our strategic combination has repositioned Baytex as a North American crude oil producer with strong free cash flow and an improved balance sheet. We have completed the integration while delivering excellent drilling results, particularly the oil flow rates from our two new wells in the Pembina region of our Duvernay light oil play. We are also benefiting from strong oil price diversification, which includes light oil production in the Eagle Ford and high netback Viking light oil production in Canada. As we plan for 2019, our top priority will be disciplined capital allocation to drive meaningful free cash flow," commented Ed LaFehr, President and Chief Executive Officer.
Highlights
- Completed the strategic combination with Raging River Exploration Inc. ("Raging River") on August 22, 2018, creating a well-capitalized, light oil company with an attractive free cash flow profile and improved balance sheet. Our light oil assets generate approximately 80% of our operating netback.
- Generated adjusted funds flow of $171 million ($0.46 per basic share), $32 million in excess of exploration and development capital expenditures of $139 million, which delivered production of 82,412 boe/d (81% oil and NGL) during Q3/2018. Our results reflect a 40 day contribution from the Raging River assets.
- Completed two (2.0 net) significant light oil discovery wells in the Pembina area of the East Duvernay Shale. These two wells established an average 30-day initial production rate of approximately 750 boe/d per well (88% oil and NGLs), further proving the oil window in the Pembina area where we control 256 prospective sections of 100% interest land.
- Produced approximately 97,000 boe/d (84% crude oil and NGL) during the month of October, demonstrating continued strong operating results across our portfolio of oil assets and the successful integration of Raging River.
- Reduced annual guidance for operating expenses by 4% (at mid-point) to $10.50-$10.75/boe, reflecting strong performance year-to-date of $10.54/boe. Continued to drive efficiency across our business with a 5% reduction in forecast 2018 general and administrative expenses to $1.55/boe.
- Implemented plans to optimize our heavy oil production in the face of volatile heavy oil prices. Our optimization strategy will reduce our Q4/2018 heavy oil volumes by approximately 5,000 boe/d (90% oil), which represents 5% of our total production, and given current pricing, will have a minimal impact on our adjusted funds flow.
- Secured additional rail capacity, which increases our crude oil volumes delivered to market by rail to 11,000 bbl/d (approximately 40% of our heavy oil production) through 2019. Commencing January 1, 2019, approximately 70% of our crude by rail commitments are WTI based contracts with no WCS pricing exposure.
- Based on preliminary 2019 plans, we expect to generate approximately $900 million of adjusted funds flow, 80% of which is derived from our light oil assets in the Eagle Ford and Viking. With an updated capital program of $700 million (at the mid-point), we expect to generate $200 million of cash flow above capital expenditures.
| Three Months Ended | Nine Months Ended | ||||||||||||||
| September 30, 2018 | June 30, 2018 | September 30, 2017 | September 30, 2018 | September 30, 2017 | |||||||||||
| FINANCIAL (thousands of Canadian dollars, except per common share amounts) | |||||||||||||||
| Petroleum and natural gas sales | $ | 436,761 | $ | 347,605 | $ | 258,620 | $ | 1,070,433 | $ | 796,706 | |||||
| Adjusted funds flow (1) | 171,210 | 106,690 | 77,340 | 362,155 | 241,845 | ||||||||||
| Per share – basic | 0.46 | 0.45 | 0.33 | 1.28 | 1.03 | ||||||||||
| Per share – diluted | 0.45 | 0.45 | 0.33 | 1.28 | 1.02 | ||||||||||
| Net income (loss) | 27,412 | (58,761) | (9,228) | (94,071) | 11,136 | ||||||||||
| Per share – basic | 0.07 | (0.25) | (0.04) | (0.33) | 0.05 | ||||||||||
| Per share – diluted | 0.07 | (0.25) | (0.04) | (0.33) | 0.05 | ||||||||||
| Shares Outstanding – basic (thousands) | |||||||||||||||
| Weighted average | 375,435 | 236,628 | 235,451 | 283,302 | 234,563 | ||||||||||
| End of period | 553,950 | 236,662 | 235,451 | 553,950 | 235,451 | ||||||||||
| Three Months Ended | Nine Months Ended | ||||||||||||||||||||||||||||
| September 30, 2018 | June 30, 2018 | September 30, 2017 | September 30, 2018 | September 30, 2017 | |||||||||||||||||||||||||
| FINANCIAL (thousands of Canadian dollars) | |||||||||||||||||||||||||||||
| Exploration and development | $ | 139,195 | $ | 78,830 | $ | 61,544 | $ | 311,559 | $ | 236,110 | |||||||||||||||||||
| Acquisitions, net of divestitures | 46 | (21) | (7,436) | (2,001) | 63,794 | ||||||||||||||||||||||||
| Total oil and natural gas capital expenditures | $ | 139,241 | $ | 78,809 | $ | 54,108 | $ | 309,558 | $ | 299,904 | |||||||||||||||||||
| Bank loan (2) | $ | 490,565 | $ | 213,538 | $ | 226,249 | $ | 490,565 | $ | 226,249 | |||||||||||||||||||
| Long-term notes (2) | 1,527,733 | 1,548,490 | 1,488,450 | 1,527,733 | 1,488,450 | ||||||||||||||||||||||||
| Long-term debt | 2,018,298 | 1,762,028 | 1,714,699 | 2,018,298 | 1,714,699 | ||||||||||||||||||||||||
| Working capital (surplus) deficiency | 93,792 | 22,807 | 34,106 | 93,792 | 34,106 | ||||||||||||||||||||||||
| Net debt (3) | $ | 2,112,090 | $ | 1,784,835 | $ | 1,748,805 | $ | 2,112,090 | $ | 1,748,805 | |||||||||||||||||||
| OPERATING | |||||||||||||||||||||||||||||
| Daily Production | |||||||||||||||||||||||||||||
| Light oil and condensate (bbl/d) | 29,731 | 21,100 | 20,041 | 23,965 | 21,343 | ||||||||||||||||||||||||
| Heavy oil (bbl/d) | 27,036 | 25,544 | 26,161 | 25,824 | 25,454 | ||||||||||||||||||||||||
| NGL (bbl/d) | 10,076 | 9,419 | 8,940 | 9,549 | 8,982 | ||||||||||||||||||||||||
| Total liquids (bbl/d) | 66,843 | 56,063 | 55,142 | 59,338 | 55,779 | ||||||||||||||||||||||||
| Natural gas (mcf/d) | 93,414 | 87,605 | 85,006 | 89,449 | 88,166 | ||||||||||||||||||||||||
| Oil equivalent (boe/d @ 6:1) (4) | 82,412 | 70,664 | 69,310 | 74,246 | 70,473 | ||||||||||||||||||||||||
| Netback (thousands of Canadian dollars) | |||||||||||||||||||||||||||||
| Total sales, net of blending and other expense | $ | 417,213 | $ | 329,366 | $ | 242,551 | $ | 1,015,356 | $ | 754,152 | |||||||||||||||||||
| Royalties | (91,945) | (77,205) | (55,176) | (233,989) | (172,367) | ||||||||||||||||||||||||
| Operating expense | (77,698) | (70,149) | (64,391) | (213,735) | (199,446) | ||||||||||||||||||||||||
| Transportation expense | (9,520) | (7,836) | (9,312) | (25,875) | (26,327) | ||||||||||||||||||||||||
| Operating netback | $ | 238,050 | $ | 174,176 | $ | 113,672 | $ | 541,757 | $ | 356,012 | |||||||||||||||||||
| General and administrative | (10,158) | (10,563) | (11,074) | (31,729) | (37,672) | ||||||||||||||||||||||||
| Cash financing and interest | (26,343) | (25,530) | (24,526) | (76,384) | (75,632) | ||||||||||||||||||||||||
| Realized financial derivatives (loss) gain | (30,854) | (29,408) | 2,795 | (70,103) | 5,719 | ||||||||||||||||||||||||
| Other (5) | 515 | (1,985) | (3,527) | (1,386) | (6,582) | ||||||||||||||||||||||||
| Adjusted funds flow | $ | 171,210 | $ | 106,690 | $ | 77,340 | $ | 362,155 | $ | 241,845 | |||||||||||||||||||
| Netback (per boe) | |||||||||||||||||||||||||||||
| Total sales, net of blending and other expense | $ | 55.03 | $ | 51.22 | $ | 38.04 | $ | 50.09 | $ | 39.20 | |||||||||||||||||||
| Royalties | (12.13) | (12.01) | (8.65) | (11.54) | (8.96) | ||||||||||||||||||||||||
| Operating expense | (10.25) | (10.91) | (10.10) | (10.54) | (10.37) | ||||||||||||||||||||||||
| Transportation expense | (1.26) | (1.22) | (1.46) | (1.28) | (1.37) | ||||||||||||||||||||||||
| Operating netback | $ | 31.39 | $ | 27.08 | $ | 17.83 | $ | 26.73 | $ | 18.50 | |||||||||||||||||||
| General and administrative | (1.34) | (1.64) | (1.74) | (1.57) | (1.96) | ||||||||||||||||||||||||
| Cash financing and interest | (3.47) | (3.97) | (3.85) | (3.77) | (3.93) | ||||||||||||||||||||||||
| Realized financial derivatives (loss) gain | (4.07) | (4.57) | 0.44 | (3.46) | 0.30 | ||||||||||||||||||||||||
| Other (5) | 0.07 | (0.31) | (0.55) | (0.06) | (0.34) | ||||||||||||||||||||||||
| Adjusted funds flow | $ | 22.58 | $ | 16.59 | $ | 12.13 | $ | 17.87 | $ | 12.57 | |||||||||||||||||||
| Notes: | ||
| (1) | Adjusted funds flow is not a measurement based on generally accepted accounting principles ("GAAP") in Canada, but is a financial term commonly used in the oil and gas industry. We define adjusted funds flow as cash flow from operating activities adjusted for changes in non-cash operating working capital, asset retirement obligations settled and transaction costs. Our determination of adjusted funds flow may not be comparable to other issuers. We consider adjusted funds flow a key measure of performance as it demonstrates our ability to generate the cash flow necessary to fund capital investments, debt repayment, settlement of our abandonment obligations and potential future dividends. In addition, we use the ratio of net debt to adjusted funds flow to manage our capital structure. We eliminate changes in non-cash working capital and settlements of abandonment obligations from cash flow from operations as the amounts can be discretionary and may vary from period to period depending on our capital programs and the maturity of our operating areas. The settlement of abandonment obligations are managed with our capital budgeting process which considers available adjusted funds flow. In addition, we have removed transaction costs from the Raging River combination as we consider these costs non-recurring and not reflective of our ongoing ability to generate adjusted funds flow. For a reconciliation of adjusted funds flow to cash flow from operating activities, see Management's Discussion and Analysis of the operating and financial results for the three and nine months ended September 30, 2018. | |
| (2) | Principal amount of instruments. | |
| (3) | Net debt is not a measurement based on GAAP in Canada, but is a financial term commonly used in the oil and gas industry. We define net debt to be the sum of monetary working capital (which is current assets less current liabilities excluding current financial derivatives and onerous contracts) and the principal amount of both the long-term notes and the bank loan. | |
| (4) | Barrel of oil equivalent ("boe") amounts have been calculated using a conversion rate of six thousand cubic feet of natural gas to one barrel of oil. The use of boe amounts may be misleading, particularly if used in isolation. A boe conversion ratio of six thousand cubic feet of natural gas to one barrel of oil is based on an energy equivalency conversion method primarily applicable at the burner tip and does not represent a value equivalency at the wellhead. | |
| (5) | Other is comprised of realized foreign exchange gain or loss, other income or expense, current income tax expense or recovery and payments on onerous contracts. Refer to the Q3/2018 MD&A for further information on these amounts. | |
Strategic Combination with Raging River
On August 22, 2018, we completed the strategic combination with Raging River. The transaction resulted in holders of common shares of Raging River receiving 1.36 common shares of Baytex for each Raging River Share owned. Our third quarter results include 40 days of operations from the Raging River assets representing the August 22 to September 30 period. During this period, production from the Raging River assets averaged 23,750 boe/d (Q3/2018 impact of 10,327 boe/d), consistent with our expectations.
Since closing the transaction, we have successfully integrated the two companies, undertaken a detailed strategic review of our operations, confirmed the organic growth opportunities in our diversified portfolio of assets and delivered on our near-term targets. Our strategic combination with Raging River has repositioned Baytex as a self-funding North American producer focused on per share value creation with a target of providing investors with a 10% to 15% total annual return.
In October, we produced approximately 97,000 boe/d (84% crude oil and NGL) from our high quality oil assets, including the Eagle Ford in Texas and the Viking, Peace River, Lloydminster and East Duvernay Shale properties in Canada. We have a deep inventory of high quality drilling prospects that generate top tier returns on invested capital and have the capability to deliver meaningful organic production growth.
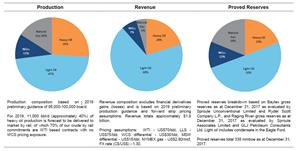
One of the key benefits of the combination with Raging River is our strong oil price diversification, which includes light oil and condensate production in the Eagle Ford which commands premium Louisiana Light Sweet ("LLS") based pricing and our high netback Viking light oil production in Canada. At current prices, approximately 80% of our operating netback is derived from these two assets. The charts at the following link summarize our exposure by commodity based on production, revenue and proved reserves.
http://www.globenewswire.com/NewsRoom/AttachmentNg/dc6e2e3f-000e-463e-abce-ac6b70cc69a7
Operating Results
We continued to deliver on our operational and financial targets during the third quarter. We successfully integrated the Raging River assets and executed our drilling program with strong results realized in the Eagle Ford and Canada.
Production average 82,412 boe/d (81% oil and NGL) in Q3/2018, as compared to 70,664 boe/d (79% oil and NGL) in Q2/2018. Production in the first nine months of 2018 averaged 74,246 boe/d. Production from the legacy Baytex assets (excluding Raging River) averaged 72,085 boe/d in Q3/2018.
During the third quarter, exploration and development capital expenditures totaled $139 million, bringing the aggregate spending in the first nine months of 2018 to $312 million. We participated in the drilling of 116 (74.8 net) wells with a 98% success rate during the third quarter.
Eagle Ford and Viking Light Oil
Our Eagle Ford asset in South Texas is one of the premier oil resource plays in North America. The asset generates a strong operating netback and free cash flow and contains a significant inventory of development prospects. In Q3/2018, we allocated 32% of our exploration and development expenditures to this asset generating production of 37,198 boe/d (77% oil and NGL), as compared to 36,622 boe/d in Q2/2018. During the third quarter, the Eagle Ford generated operating netback of $130 million and free cash flow (after capital expenditures) of $85 million.
We continue to see strong well performance driven by enhanced completions in the Eagle Ford. In Q3/2018, we participated in the drilling of 29 (8.0 net) wells and commenced production from 26 (4.9 net) wells. The wells that have been on production for more than 30 days in the quarter established 30-day initial production rates of approximately 1,600 boe/d (54% light oil and condensate). These wells were completed with approximately 28 effective frac stages per well and proppant per completed foot of approximately 1,800 pounds.
Our Viking asset is a shallow, light oil resource play (approximately 36° API) in western Canada with 460 net sections of prospective lands. For the period August 22 to September 30, production from the Viking averaged 22,158 boe/d (excluding heavy oil) and we drilled 42 (30.5 net) wells. The extended reach horizontal results continue to exceed expectations with multiple, previously untested sections being proven highly economic. We currently have five drilling rigs and 1.5 frac crews executing our development program.
Heavy Oil
Our heavy oil assets at Peace River and Lloydminster produced a combined 27,036 bbl/d during the third quarter, as compared to 25,544 bbl/d in Q2/2018. The higher volumes reflect the continued success of our development program and the addition of heavy oil assets acquired as part of the Raging River combination (964 bbl/d for the period August 22 to September 30).
Our Peace River region, located in northwest Alberta, has been a core asset since we commenced operations in the area in 2004. Through our innovative multi-lateral horizontal drilling and production techniques, we are able to generate some of the strongest capital efficiencies in the oil and gas industry. In Q3/2018, we drilled five (5.0 net) wells and commenced production from four (4.0 net) wells. In the northern Seal area of Peace River, our first six wells have established 30-day initial production rates of approximately 700 boe/d per well.
Our Lloydminster region is characterized by multiple stacked pay formations at relatively shallow depths. The area has been successfully developed through vertical and horizontal drilling, water flood, steam-assisted gravity drainage operations and, more recently, the implementation of polymer flooding to further enhance reserves recovery. We drilled 36 (27.3 net) oil wells during the third quarter. In addition, we successfully completed the expansion of our Kerrobert thermal project with productive capability increasing to approximately 2,000 bbl/d during the fourth quarter.
East Duvernay Shale Light Oil – Significant Pembina Light Oil Discovery
We continue to prudently advance the evaluation of this emerging light oil play in central Alberta. The East Duvernay Shale is an early stage, high netback light oil resource play where we have amassed over 430 sections of land. The early focus has been to delineate and evaluate the potential depth of this light oil resource.
Our development has taken an important step forward with two new light oil discovery wells in the Pembina area located approximately 5 and 7 miles south of our initial 14-36 discovery well. These two wells established an average 30-day initial production rate of approximately 750 boe/d per well (88% oil and NGLs). We are also following up the initial 14-36 discovery with two additional wells from the original surface pad. Drilling operations are complete and we anticipate initiating completion activities in early November.
The two recent discovery wells demonstrate continuity of the oil window and provide a focus for 2019 pad development drilling in addition to incremental delineation drilling to continue to evaluate the commerciality of our lands. We control 256 sections of 100% interest land in the Pembina area.
During the third quarter, we also completed one (1.0 net) well at Ferrybank that is currently shut-in for re-licensing due to encountering H2S in the early phase of flow back and one (1.0 net) well at Gilby, which is currently on production at 80 boe/d (77% oil and NGL).
Financial Review
We generated adjusted funds flow of $171 million ($0.46 per basic share) in Q3/2018, compared to $107 million ($0.45 per basic share) in Q2/2018 and $77 million ($0.33 per basic share) in Q3/2017. Excluding financial derivatives losses, adjusted funds flow in Q3/2018 was $202 million, compared to $136 million in Q2/2018. The increase in adjusted funds flow is largely attributable to an initial contribution from the high netback Raging River production.
In the first nine months of 2018, we generated adjusted funds flow of $362 million ($432 million excluding realized financial derivatives losses), as compared to exploration and development capital expenditures of $312 million.
Financial Liquidity
Our net debt totaled $2.1 billion at September 30, 2018, which is up from $1.8 billion at June 30, 2018. The increase in net debt is due to the $364 million of net debt assumed in conjunction with the Raging River transaction. We maintain strong financial liquidity with our credit facilities approximately 50% undrawn and our first long-term note maturity not until 2021. We have established a new $300 million term loan facility that is due June 2020 and is secured by the assets of Raging River. This additional facility, combined with our existing facilities of US$575 million, increased our credit capacity to approximately $1.04 billion.
Operating Netback
Our operating netback (excluding realized financial derivatives gains and losses) improved 76% to $31.39/boe in Q3/2018, as compared to $17.83/boe in Q3/2017. During the third quarter, we benefited from strong liquids pricing in the Eagle Ford and an initial contribution from our high netback Viking light oil production. The Eagle Ford generated an operating netback of $38.03/boe during Q3/2018 while our Canadian operations generated an operating netback of $25.94/boe.
In Q3/2018, the price for West Texas Intermediate light oil ("WTI") averaged US$69.50/bbl, as compared to US$48.20/bbl in Q3/2017. The discount for Canadian heavy oil, as measured by the price differential between Western Canadian Select ("WCS") and WTI, averaged US$22.25/bbl in Q3/2018 as compared to US$9.94/bbl in Q3/2017.
In the Eagle Ford, our assets are proximal to Gulf Coast markets with light oil and condensate production priced off the LLS crude oil benchmark, which is a function of the Brent price. In Q3/2018, the price for LLS averaged US$75.25/bbl as compared to US$50.27/bbl in Q3/2017. During the third quarter, our light oil and condensate realized price in the Eagle Ford of US$71.41/bbl (or $93.37/bbl) represented a US$3.84/bbl discount to LLS.
The following table summarizes our operating netbacks for the periods noted.
| Three Months Ended September 30 | ||||||||||||||||||
| 2018 | 2017 | |||||||||||||||||
| ($ per boe except for volume) | Canada | U.S. | Total | Canada | U.S. | Total | ||||||||||||
| Total production (boe/d) | 45,214 | 37,198 | 82,412 | 34,560 | 34,750 | 69,310 | ||||||||||||
| Total sales, net of blending and other expense | $ | 47.66 | $ | 63.98 | $ | 55.03 | $ | 33.41 | $ | 42.64 | $ | 38.04 | ||||||
| Less: | ||||||||||||||||||
| Royalties | 6.28 | 19.23 | 12.13 | 4.71 | 12.58 | 8.65 | ||||||||||||
| Operating expense | 13.15 | 6.72 | 10.25 | 13.69 | 6.53 | 10.10 | ||||||||||||
| Transportation expense | 2.29 | — | 1.26 | 2.93 | — | 1.46 | ||||||||||||
| Operating netback | $ | 25.94 | $ | 38.03 | $ | 31.39 | $ | 12.08 | $ | 23.53 | $ | 17.83 | ||||||
| Realized financial derivatives (loss) gain | — | — | (4.07) | — | — | 0.44 | ||||||||||||
| Operating netback after financial derivatives | $ | 25.94 | $ | 38.03 | $ | 27.32 | $ | 12.08 | $ | 23.53 | $ | 18.27 | ||||||
Risk Management
As part of our normal operations, we are exposed to movements in commodity prices. In an effort to manage these exposures, we utilize various financial derivative contracts, crude-by-rail and capital allocation optimization to reduce the volatility in our adjusted funds flow. We realized a financial derivatives loss of $31 million in Q3/2018 due to the increased price of crude oil relative to the prices set in our contracts.
For 2019, we have entered into hedges on approximately 35% of our net crude oil exposure. This includes 30% of our net WTI exposure with 11% fixed at US$61.22/bbl and 19% hedged utilizing a 3-way option structure that provides us with an average downside price protection at US$66.74/bbl and an average upside participation to US$73.42/bbl. In addition, we have entered into a Brent-based 3-way option structure for 3,000 bbl/d that provides us with average downside price protection at US$69.50/bbl and average upside participation to US$78.68/bbl.
Crude-by-rail is an integral part of our egress and marketing strategy. In Q3/2018, we delivered 9,500 bbl/d of our heavy oil volumes to market by rail, up from 8,500 bbl/d in Q2/2018. We have secured additional rail capacity, which will see our heavy oil volumes delivered to market by rail increase to approximately 11,000 bbl/d (approximately 40%) through 2019. Commencing January 1, 2019, approximately 70% of our crude by rail commitments are WTI based contracts with no WCS pricing exposure.
A complete listing of our financial derivative contracts can be found in Note 18 to our Q3/2018 financial statements.
Outlook and Guidance Update
On August 22, 2018, we provided updated 2018 guidance and preliminary plans for 2019. We laid out a plan to deliver industry leading returns, attractive production growth and strong free cash flow.
We are currently benefiting from improved WTI and LLS pricing, which has resulted in record operating netback being generated in the Eagle Ford. The Eagle Ford, which represents 37% of our production, generates approximately 47% of our operating netback and approximately $300 million of annual free cash flow. Likewise, the Viking, which represents 25% of our production, generates approximately 33% of our operating netback and approximately $100 million of annual free cash flow.
Offsetting the strong global pricing environment are weak prices for all grades of Canadian crude oil and in particular for heavy oil. Over the last two months, price differentials to WTI have widened due to an increased supply of crude oil from western Canada, refinery turnarounds in the U.S. which has temporarily reduced demand and a slower than anticipated ramp up in crude-by-rail volumes. As a result, based on the forward curve, the WCS differential to WTI for Q4/2018 is approximately US$40/bbl and for 2019, is approximately US$30/bbl.
We are committed to making prudent capital allocation decisions in the face of volatile commodity prices. In the normal pricing environment, our heavy oil assets generate exceptional rates of return and provide meaningful organic growth opportunities. Recognizing the current heavy oil pricing dynamics and an expectation that the volatility around heavy oil in Canada is likely to continue into 2019, we are currently optimizing our heavy oil operations. This includes building crude inventory, deferring several completions and pro-actively shutting in negative margin production. In doing so, we will maximize the value of our resource base and our adjusted funds flow.
Our heavy oil optimization strategy will reduce our Q4/2018 volumes by approximately 5,000 boe/d (90% oil), which represents 5% of our total production, and given current pricing, will have a minimal impact on our adjusted funds flow. The strong operating performance in our other business units is expected to mitigate a portion of the reduced heavy oil volumes in the fourth quarter. As a result, we expect production in Q4/2018 to average 95,000 to 96,000 boe/d (97,000 to 99,000 boe/d, previously). For the full-year 2018, we have tightened our production guidance range to 79,000 to 80,000 boe/d (79,000 to 81,000 boe/d, previously) with an unchanged exploration and development capital expenditure budget of $450 to $500 million.
The following table compares our 2018 annual guidance to our YTD 2018 results.
Summary of 2018 Guidance
| Original Guidance (1) | Current Guidance (2) | YTD Results | ||||
| Exploration and development capital ($ millions) | 450 – 500 | 450 - 500 | 312 | |||
| Production (boe/d) | 79,000 - 81,000 | 79,000 - 80,000 | 74,246 | |||
| Expenses: | ||||||
| Royalty rate (%) | ~ 21.0 | ~ 22.0 | 23.0 | |||
| Operating ($/boe) | 10.75 - 11.25 | 10.50 – 10.75 | 10.54 | |||
| Transportation ($/boe) | 1.35 - 1.45 | 1.25 - 1.30 | 1.28 | |||
| General and administrative ($ millions) | ~ 48 (1.64/boe) | ~ 45 (1.55/boe) | 32 (1.57/boe) | |||
| Interest ($ millions) | ~ 105 (3.60/boe) | ~ 104 (3.58/boe) | 76 (3.77/boe) | |||
| Note: | ||
| (1) | As announced on August 22, 2018 to include Raging River from the closing date of the transaction. | |
| (2) | Updated as at November 2, 2018. | |
As we make plans for 2019, our top priority will be disciplined capital allocation to drive meaningful free cash flow and a strengthened balance sheet. With a diversified asset base and product pricing mix, we have the capability to optimize capital allocation based on commodity prices and economic returns by area.
In addition to the near-term impact of optimizing our heavy oil operations, we currently anticipate moderating our growth expectations in heavy oil over the near term. As a result, we are making plans for a curtailed heavy oil development program through the first half of 2019. We believe with continued growth in crude-by-rail volumes and incremental pipeline egress scheduled for late 2019, a much stronger pricing environment for heavy oil will present itself in the second half of 2019. We will continue to monitor Canadian crude oil pricing dynamics for an opportunity to re-deploy incremental capital as supported by well economics and field netbacks.
For our 2019 preliminary plans, exploration and development expenditures are now expected to total $650 to $750 million ($750 to $850 million previously) which is designed to generate average annual production of approximately 95,000 to 100,000 boe/d (100,000 to 105,000 boe/d, previously). This 2019 production range contemplates the re-start of shut in heavy oil volumes by mid-2019.
Preliminary development plans for 2019 include maintaining a consistent activity set in the Eagle Ford and Viking, both of which are expected to generate significant free cash flow. In addition, we will continue to delineate the East Duvernay Shale oil play with an increased pace of activity. Development plans for our heavy oil portfolio remain flexible based on an evolving outlook for heavy oil prices.
Despite the volatility in commodity prices, we continue to forecast adjusted funds flow for 2019 of approximately $900 million. With reduced spending on heavy oil, we are positioned to allocate approximately $200 million of free cash flow toward debt repayment, up from our original debt reduction plan of approximately $100 million.
Summary of Preliminary 2019 Plans
| Original (1) | Current (2) | |||
| Exploration and Development Capital | $750 - $850 million | $650 - $750 million | ||
| Production | 100,000 - 105,000 boe/d | 95,000 - 100,000 boe/d | ||
| Oil and NGLs | ~ 85% | ~ 85% | ||
| Operating Netback | $28/boe | $31/boe | ||
| Adjusted Funds Flow | $900 million | $900 million | ||
| Adjusted Funds Flow per Share (3) | $1.60 | $1.60 | ||
| Free Cash Flow after Total Capital Spending | $100 million | $200 million | ||
| Net Debt (YE 2019) | $2.0 billion | $1.9 billion | ||
| Net Debt to Adjusted Funds Flow (4) | 2.2x | 2.1x |
| Notes: | ||
| (1) | As announced August 22, 2018. Pricing assumptions: WTI - US$63/bbl; LLS - US$67/bbl; WCS differential - US$23/bbl; MSW differential – US$8/bbl, NYMEX Gas - US$2.80/mcf; and Exchange Rate (CAD/USD) - 1.30. | |
| (2) | As announced November 2, 2018. Pricing assumptions: WTI - US$70/bbl; LLS - US$75/bbl; WCS differential - US$30/bbl; MSW differential – US$15/bbl, NYMEX Gas - US$2.90/mcf; and Exchange Rate (CAD/USD) - 1.30. | |
| (3) | Based on 555 million common shares outstanding. | |
| (4) | Net debt ratio based on forecast net debt at year-end 2019 and forecast 2019 adjusted funds flow. | |
| (5) | Certain terms referenced above are non-GAAP measures. See advisory regarding Non-GAAP Financial and Capital Management Measures at the end of the press release. | |
We will provide 2019 guidance in early December upon approval by the board of directors.
Additional Information
Our condensed consolidated interim unaudited financial statements for the three and nine months ended September 30, 2018 and the related Management's Discussion and Analysis of the operating and financial results can be accessed immediately on our website at www.baytexenergy.com and will be available shortly through SEDAR at www.sedar.com and EDGAR at www.sec.gov/edgar.shtml.
| Conference Call Today |
| 9:00 a.m. MDT (11:00 a.m. EDT) |
| Baytex will host a conference call today, November 2, 2018, starting at 9:00am MDT (11:00am EDT). To participate, please dial toll free in North America 1-800-319-4610 or international 1-416-915-3239. Alternatively, to listen to the conference call online, please enter http://services.choruscall.ca/links/baytexq320181102.html in your web browser. |
| An archived recording of the conference call will be available shortly after the event by accessing the webcast link above. The conference call will also be archived on the Baytex website at www.baytexenergy.com. |
Advisory Regarding Forward-Looking Statements
In the interest of providing Baytex's shareholders and potential investors with information regarding Baytex, including management's assessment of Baytex's future plans and operations, certain statements in this press release are "forward-looking statements" within the meaning of the United States Private Securities Litigation Reform Act of 1995 and "forward-looking information" within the meaning of applicable Canadian securities legislation (collectively, "forward-looking statements"). In some cases, forward-looking statements can be identified by terminology such as "anticipate", "believe", "continue", "could", "estimate", "expect", "forecast", "intend", "may", "objective", "ongoing", "outlook", "potential", "project", "plan", "should", "target", "would", "will" or similar words suggesting future outcomes, events or performance. The forward-looking statements contained in this press release speak only as of the date thereof and are expressly qualified by this cautionary statement.
Specifically, this press release contains forward-looking statements relating to but not limited to: our business strategies, plans and objectives; that we benefit from oil price diversification; that our top priority is disciplined capital allocation to drive meaningful free cash flow; that we are a well-capitalized, oil-weighted company with an attractive free cash flow profile and an improved balance sheet; our reduced guidance for 2018 operating and general and administrative expenses; the impact of our heavy oil optimization strategy; our plans to optimize heavy oil prices, including: the volume of oil we expect to deliver to market by rail and the percentage of our rail commitments exposed to WCS pricing; our 2019 preliminary plans, including our expected: adjusted funds flow, percentage of adjusted funds flow to be derived from our light oil assets, capital spending plan, cash flow above capital expenditures and free cash flow yield; that we are a self-funded producer focused on per share value creation, targeting shareholder returns of 10% to 15%; that our drilling prospects will generate top tier returns on invested capital and that we have the ability to deliver meaningful organic production growth; our commodity exposure on a production, revenue and proved reserves basis; our Eagle Ford assets, including our assessment that: it is a premier oil resource play, generates strong operating netbacks and free cash flow and has a significant development inventory; that 460 net sections in our Viking asset are prospective; our assessment that we can generate some of the strongest capital efficiencies in the oil and gas industry at our Peace River assets; that polymer flooding will enhance reserves recovery at our Lloydminster asset; our East Duvernay assets, including: that we are prudently advancing the evaluation of the play, our plan to complete two wells in November, that the Pembina area will be a focus of pad drilling and incremental delineation drilling in 2019; our belief that we have strong financial liquidity; our ability to partially reduce the volatility in our adjusted funds flow by utilizing financial derivative contracts, crude-by-rail and capital allocation optimization; the percentage of our net WTI exposure that we have hedged for 2019; the percentage of production and cash flow and dollar amount of free cash flow expected from our Eagle Ford and Viking assets in 2019; that our heavy oil assets generate exceptional rates of return and provide meaningful growth opportunities in the right pricing environment; our expectation the heavy oil prices will remain volatile into 2019; that we are maximizing the value of our heavy oil resource base and adjusted funds flow by and will: build inventory, defer completions and shut-in low or negative margin production; the expected impact of our heavy oil optimization in Q4/2018 on production and adjusted fuds flow; that strong performance in other business units will mitigate the a portion of the heavy oil reduction; our 2018 guidance for exploration and development capital, production and royalty rate, operating, transportation, general and administration and interest expenses; our top priority for 2019 will be disciplined capital allocation to drive meaningful cash flow and a strengthened balance sheet; that we have the ability to optimize capital allocation based on commodity prices and economic returns by area; our preliminary plans for 2019, including: moderated growth in heavy oil, that heavy oil prices will be higher in the second half of 2019, 2019 guidance for exploration and development capital and production, that we will re-start shut in heavy oil volumes by mid-2019, that we will have a consistent activity set in the Eagle Ford and Viking that will generate significant free cash flow, that we will continue to delineate the Duvernay, that our heavy oil development will be flexible, our forecast adjusted funds flow, the amount of free cash flow available for debt repayment, our Summary of Preliminary 2019 Plans and that we will provide 2019 guidance in early December upon approval by the board of directors.
In addition, information and statements relating to reserves and contingent resources are deemed to be forward-looking statements, as they involve implied assessment, based on certain estimates and assumptions, that the reserves and contingent resources described exist in quantities predicted or estimated, and that they can be profitably produced in the future.
These forward-looking statements are based on certain key assumptions regarding, among other things: petroleum and natural gas prices and differentials between light, medium and heavy oil prices; well production rates and reserve volumes; our ability to add production and reserves through our exploration and development activities; capital expenditure levels; our ability to borrow under our credit agreements; the receipt, in a timely manner, of regulatory and other required approvals for our operating activities; the availability and cost of labour and other industry services; interest and foreign exchange rates; the continuance of existing and, in certain circumstances, proposed tax and royalty regimes; our ability to develop our crude oil and natural gas properties in the manner currently contemplated; and current industry conditions, laws and regulations continuing in effect (or, where changes are proposed, such changes being adopted as anticipated). Readers are cautioned that such assumptions, although considered reasonable by Baytex at the time of preparation, may prove to be incorrect.
Actual results achieved will vary from the information provided herein as a result of numerous known and unknown risks and uncertainties and other factors. Such factors include, but are not limited to: the volatility of oil and natural gas prices and price differentials; the availability and cost of capital or borrowing; that our credit facilities may not provide sufficient liquidity or may not be renewed; failure to comply with the covenants in our debt agreements; risks associated with a third-party operating our Eagle Ford properties; availability and cost of gathering, processing and pipeline systems; public perception and its influence on the regulatory regime; changes in government regulations that affect the oil and gas industry; changes in environmental, health and safety regulations; restrictions or costs imposed by climate change initiatives; variations in interest rates and foreign exchange rates; risks associated with our hedging activities; the cost of developing and operating our assets; depletion of our reserves; risks associated with the exploitation of our properties and our ability to acquire reserves; changes in income tax or other laws or government incentive programs; uncertainties associated with estimating oil and natural gas reserves; our inability to fully insure against all risks; risks of counterparty default; risks associated with acquiring, developing and exploring for oil and natural gas and other aspects of our operations; risks associated with large projects; risks related to our thermal heavy oil projects; risks associated with our use of information technology systems; risks associated with the ownership of our securities, including changes in market-based factors; risks for United States and other non-resident shareholders, including the ability to enforce civil remedies, differing practices for reporting reserves and production, additional taxation applicable to non-residents and foreign exchange risk; and other factors, many of which are beyond our control. These and additional risk factors are discussed in our Annual Information Form, Annual Report on Form 40-F and Management's Discussion and Analysis for the year ended December 31, 2017, as filed with Canadian securities regulatory authorities and the U.S. Securities and Exchange Commission.
The above summary of assumptions and risks related to forward-looking statements has been provided in order to provide shareholders and potential investors with a more complete perspective on Baytex's current and future operations and such information may not be appropriate for other purposes.
There is no representation by Baytex that actual results achieved will be the same in whole or in part as those referenced in the forward-looking statements and Baytex does not undertake any obligation to update publicly or to revise any of the included forward-looking statements, whether as a result of new information, future events or otherwise, except as may be required by applicable securities law.
All amounts in this press release are stated in Canadian dollars unless otherwise specified.
Non-GAAP Financial and Capital Management Measures
Adjusted funds flow is not a measurement based on generally accepted accounting principles ("GAAP") in Canada, but is a financial term commonly used in the oil and gas industry. We define adjusted funds flow as cash flow from operating activities adjusted for changes in non-cash operating working capital, asset retirement obligations settled and transaction costs. Our determination of adjusted funds flow may not be comparable to other issuers. We consider adjusted funds flow a key measure of performance as it demonstrates our ability to generate the cash flow necessary to fund capital investments, debt repayment, settlement of our abandonment obligations and potential future dividends. In addition, we use the ratio of net debt to adjusted funds flow to manage our capital structure. We eliminate changes in non-cash working capital and settlements of abandonment obligations from cash flow from operations as the amounts can be discretionary and may vary from period to period depending on our capital programs and the maturity of our operating areas. The settlement of abandonment obligations are managed with our capital budgeting process which considers available adjusted funds flow. In addition, we have removed transaction costs from the Raging River combination as we consider these costs non-recurring and not reflective of our ongoing ability to generate adjusted funds flow. For a reconciliation of adjusted funds flow to cash flow from operating activities, see Management's Discussion and Analysis of the operating and financial results for the three and nine months ended September 30, 2018.
Free cash flow is not a measurement based on GAAP in Canada. We define free cash flow as adjusted funds flow less sustaining capital. Sustaining capital is an estimate of the amount of exploration and development capital required to offset production declines on an annual basis and maintain flat production volumes.
Net debt is not a measurement based on GAAP in Canada. We define net debt to be the sum of monetary working capital (which is current assets less current liabilities excluding current financial derivatives and onerous contracts) and the principal amount of both the long-term notes and the bank loan. We believe that this measure assists in providing a more complete understanding of our cash liabilities.
Bank EBITDA is not a measurement based on GAAP in Canada. We define Bank EBITDA as our consolidated net income attributable to shareholders before interest, taxes, depletion and depreciation, and certain other non-cash items as set out in the credit agreement governing our revolving credit facilities. Bank EBITDA is used to measure compliance with certain financial covenants.
Operating netback is not a measurement based on GAAP in Canada, but is a financial term commonly used in the oil and gas industry. Operating netback is equal to petroleum and natural gas sales less blending expense, royalties, production and operating expense and transportation expense divided by barrels of oil equivalent sales volume for the applicable period. Our determination of operating netback may not be comparable with the calculation of similar measures for other entities. We believe that this measure assists in characterizing our ability to generate cash margin on a unit of production basis.
Advisory Regarding Oil and Gas Information
Where applicable, oil equivalent amounts have been calculated using a conversion rate of six thousand cubic feet of natural gas to one barrel of oil. The use of boe amounts may be misleading, particularly if used in isolation. A boe conversion ratio of six thousand cubic feet of natural gas to one barrel of oil is based on an energy equivalency conversion method primarily applicable at the burner tip and does not represent a value equivalency at the wellhead.
References herein to average 30-day initial production rates and other short-term production rates are useful in confirming the presence of hydrocarbons, however, such rates are not determinative of the rates at which such wells will commence production and decline thereafter and are not indicative of long term performance or of ultimate recovery. While encouraging, readers are cautioned not to place reliance on such rates in calculating aggregate production for us or the assets for which such rates are provided. A pressure transient analysis or well-test interpretation has not been carried out in respect of all wells. Accordingly, we caution that the test results should be considered to be preliminary.
Baytex Energy Corp.
Baytex Energy Corp. is an oil and gas corporation based in Calgary, Alberta. The company is engaged in the acquisition, development and production of crude oil and natural gas in the Western Canadian Sedimentary Basin and in the Eagle Ford in the United States. Approximately 85% of Baytex's production is weighted toward crude oil and natural gas liquids. Baytex's common shares trade on the Toronto Stock Exchange and the New York Stock Exchange under the symbol BTE.
For further information about Baytex, please visit our website at www.baytexenergy.com or contact:
Brian Ector, Vice President, Capital Markets
Toll Free Number: 1-800-524-5521
Email: investor@baytexenergy.com


© 2024 Benzinga.com. Benzinga does not provide investment advice. All rights reserved.
Date | ticker | name | Actual EPS | EPS Surprise | Actual Rev | Rev Surprise |
|---|
Trade confidently with insights and alerts from analyst ratings, free reports and breaking news that affects the stocks you care about.

