


Debt Refinancing Enhances Capital Structure and Reduces Interest Expense
NEW YORK, Aug. 14, 2017 /PRNewswire/ --
- Focused growth strategy drove 2.4% increase in consolidated revenues and 8.5% in multisector:
- Strong growth in revenue from Brazil, up 5.8%
- Revenues from multisector up 390bps to 60.5%
- Improved revenue mix, with higher value-added solutions up 330bps to 26.3% of revenue in Q2 2017
- Adjusted EBITDA margin of 11.1% in Q2 2017, with year-to-date 2017 margin of 11.3% in line with FY 2017 guidance
- Operating cash flow reached $30 million in Q2 2017, free cash flow before interest and acquisitions of $15.4 million
- Revised full-year 2017 guidance, highlighted by improved revenue growth outlook of 5% to 8%, from 1% to 5%
- Debt refinance estimated to reduce interest expenses by $10-15mm p.a. as of 2018
Atento S.A. ATTO, the largest provider of customer-relationship management and business-process outsourcing services in Latin America, and among the top five providers globally, today announced its second-quarter 2017 operating results. All comparisons in this announcement are year-over-year and in constant-currency (CCY), unless noted otherwise.
Summary
|
($ in millions except EPS) |
Q2 2017 |
Q2 2016 |
CCY Growth |
YTD 2017 |
YTD 2016 |
CCY Growth | |
|
Income Statement |
|||||||
|
Revenue (1) |
473.7 |
448.6 |
+2.4% |
941.7 |
864.3 |
+2.7% | |
|
Adjusted EBITDA (3) |
52.5 |
54.2 |
-6.1% |
106.2 |
103.0 |
-3.2% | |
|
Adjusted EBITDA Margin (3) |
11.1% |
12.1% |
-1.0pp |
11.3% |
11.9% |
-0.6pp | |
|
Recurring Net Income (2) |
9.6 |
9.5 |
-3.0% |
22.1 |
19.9 |
+8.9% | |
|
Recurring Earnings Per Share (2) |
$0.13 |
$0.13 |
- |
$0.30 |
$0.26 |
+7.1% | |
|
Reported EBITDA (3) |
46.1 |
46.1 |
-2.9% |
96.4 |
83.4 |
8.8% | |
|
Reported Net Income (2) |
(3.7) |
(8.1) |
+57.5% |
5.4 |
(12.9) |
n.m. | |
|
Reported Earnings Per Share (2) |
($0.05) |
($0.11) |
+54.5% |
$0.07 |
$(0.16) |
n.m. | |
|
Cashflow, Debt and Leverage |
|||||||
|
FCF before Interest and Acquisitions (4) |
15.4 |
33.8 |
5.8 |
6.3 |
|||
|
Net Debt |
400.4 |
459.1 |
|||||
|
Leverage (x) (5) |
1.8x |
2.0x |
1.8x |
2.0x |
|||
|
(1) |
Revenue excludes Morocco which was divested in September 2016. |
|
(2) |
Reported Net Income and Earnings Per Share and Adjusted EBITDA, Adjusted EBITDA Margin and Adjusted Earnings Per Share refer only to continuing operations. Reported and Adjusted Earnings Per Share, for the period ended June 30, 2017, were calculated considering the number of ordinary shares of 73,909,056. For the period ended June 30, 2016, the number of ordinary shares was 73,751,131. |
|
(3) |
EBITDA is defined as profit/(loss) for the period from continuing operations before net finance costs, income taxes and depreciation and amortization. Adjusted EBITDA is defined as EBITDA adjusted to exclude acquisition and integration related costs, restructuring costs, sponsor management fees, asset impairments, site relocation costs, financing and IPO fees, and other items which are not related to our core results of operations. EBITDA and Adjusted EBITDA are not measures defined by IFRS. The most directly comparable IFRS measure to EBITDA and Adjusted EBITDA is net income for the period from continuing operations. |
|
(4) |
We define Free Cash flow before interest and acquisitions as operating cashflow minus Capex payments and income tax expenses. |
|
(5) |
Does not consider the debt refinance. On a pro-forma basis, leverage ratio would be 1.6x. |
Alejandro Reynal, Atento's Chief Executive Officer, commented, "We are pleased with our results during the first half of 2017, as we continued to deliver solid topline growth, protect profitability and generate positive operating cash flow. Our growth strategy, which has been improving our revenue mix in the last couple years, continued to contribute to commercial wins in the quarter. Our enhanced capabilities from the latest acquisitions of RBrasil and Interfile, combined with our new digital platform, will help Atento to drive future growth by expanding our portfolio of services to offer complete end-to-end solutions to our clients. Based on our results in the first half of 2017 and the strength of our commercial pipeline, we remain confident in the trajectory of our business and we are revising our full-year guidance, notably increasing our outlook for revenue growth."
Mr. Reynal continued, "Our new digital business unit continues to generate value for our clients and drive broad-based growth in each of our key markets. We recently announced a partnership with Keepcon, which will further expand our digital capabilities and allow us to provide differentiated customer experience solutions to generate competitive advantages for companies and increased satisfaction for consumers."
Mauricio Montilha, Atento´s Chief Financial Officer, said, "We strengthened our balance sheet and enhanced our financial flexibility through disciplined capital allocation and vigilance over working capital. Our recent debt refinancing improves our cash flow, is accretive to our bottom line and will further increase our financial flexibility to allow us to remain focused on targeting investments aligned with our growth strategy."
Second Quarter Consolidated Operating Results
All comparisons in this announcement, unless otherwise noted, are year-over-year, in constant-currency (CCY) and exclude the effects of our divestiture of Morocco in September 2016.
We continue to deliver solid topline growth, with consolidated revenue in constant currency up 2.4%, driven by the significant 5.8% growth in Brazil. Revenues from multisector grew a strong 8.5%, mainly in Brazil and Americas. As a percentage of revenues, multisector increased 390 basis points to a record 60.5% in Q2 2017, showing stability vs Q1 2017. Revenues from Telefonica remained stable versus Q1 2017, and declined 5.8% in the quarter, driven by lower volumes in Brazil, Mexico and Argentina. The mix of revenue from higher value-added solutions increased 330 basis points to 26.3% in the quarter. On a reported basis, total revenue increased 5.6%.
Recurring net income of $9.6 million, with recurring EPS of $0.13 flat year-over-year. Adjusted EBITDA reached $52.5 million, implying an 11.1% margin. Adjusted EBITDA margin was impacted by the ramp up of new clients and lower business volumes in Mexico and Argentina.
Operating cash flow totaled $30.0 million in the quarter, and free cash flow before interest and acquisitions totaled $15.4 million, with Adjusted EBITDA to cash conversion of 29.4% in the quarter.
At the end of the second quarter, the Company had a cash position of $146.3 million with a net debt of $400.4 million. Net Debt to adjusted EBITDA improved to 1.8x from 2.0x in 2016. Important to highlight that the leverage ratio does not consider the debt refinance announced in early August. On a pro-forma basis, leverage ratio would be 1.6x.
Adjusted earnings, adjusted EBITDA and adjusted earnings per share are non-GAAP financial measures and are reconciled to their most directly comparable GAAP measures in the accompanying financial tables.
Segment Reporting
|
($ in millions) |
Q2 2017 |
Q2 2016 |
CCY growth |
YTD 2017 |
YTD 2016 |
CCY growth |
|
Brazil Region |
||||||
|
Revenue |
233.5 |
202.2 |
5.8% |
471.8 |
384.7 |
5.5% |
|
Operating Income |
13.4 |
10.3 |
26.4% |
32.1 |
17.4 |
66.3% |
|
Adjusted EBITDA |
28.7 |
27.1 |
-1.0% |
63.0 |
52.0 |
6.1% |
|
Margin |
12.3% |
13.4% |
13.4% |
13.5% |
||
|
Americas Region |
||||||
|
Revenue |
185.7 |
189.1 |
-0.3% |
359.1 |
366.3 |
-0.3% |
|
Operating Income |
10.4 |
14.3 |
-26.8% |
17.2 |
28.8 |
-39.6% |
|
Adjusted EBITDA |
21.7 |
24.3 |
-11.8% |
39.1 |
47.7 |
-18.0% |
|
Margin |
11.7% |
12.9% |
10.9% |
13.0% |
||
|
EMEA Region |
||||||
|
Revenue |
55.1 |
57.8 |
-2.0% |
111.8 |
114.1 |
1.1% |
|
Operating Income |
1.2 |
(1.7) |
N.M. |
3.1 |
(4.9) |
N.M |
|
Adjusted EBITDA |
3.8 |
3.6 |
8.6% |
8.1 |
6.3 |
28.6% |
|
Margin |
6.9% |
6.2% |
7.2% |
5.5% |
Brazil Region
Revenues in the region continued to present significant growth, up 5.8% in Q2 2017, primarily driven by an increase of 11.2% in revenues from multisector supported by new services and client wins, mostly Non-Telefonica Telcos and financial services. Revenues from Telefonica decreased 4.4% in the quarter, driven by volume reductions, however was stable as compared to Q1 2017 and Q4 2016. As a percentage of revenues, multisector increased 3.3 percentage points to a record of 68.8% in Q2 2017, while revenue mix from higher value-added solutions reached 36.3%. On a reported basis, revenue increased 15.5% in Q2 2017.
Operating Income was $13.4 million, up 26.4% in Q2 2017. Adjusted EBITDA was $28.7 million, with an adjusted EBITDA margin of 12.3%, down 1.1 percentage points, driven by ramp up costs from newly acquired services and clients.
Americas Region
Americas revenue presented stability in Q2 2017 and year-to-date, down only 0.3% in both periods. Revenues from multisector presented a 6.5% increase in Q2 2017, driven by new client wins in Argentina, Colombia, Chile, and U.S. Nearshore. Revenues from Telefonica presented a decrease of 8.1% in Q2 2017, reflecting late 2016 volume reduction in Mexico and Argentina.
As a percentage of revenues, multisector reached 57.6% in Q2 2017, up 3.7 percentage points. The mix of revenue from higher value-added solutions increased 5.2 percentage points to historical high of 17.5%. On a reported basis, revenue declined 1.8% in Q2 2017.
Operating income was $10.4 million. Adjusted EBITDA was $21.7 million, with an adjusted EBITDA margin of 11.7%. Profitability decreased when compared to Q2 2016 due to the ramp up of new multisector clients in Argentina, Colombia and Chile, combined with volume adjustments from Telefonica in Mexico and Argentina.
EMEA Region
Revenue in EMEA decreased 2.0% in Q2 2017, driven by a 3.0% decline in revenues from Telefonica, partially offset by the stability in multisector revenues. Revenues from multisector increased 70 basis points to 35.7%, while the mix of revenue from higher value-added solutions increased 2.0 percentage points to 12.2%. On a reported basis, revenue declined 4.7% in Q2 2017.
Operating profit was $1.2 million in Q2 2017. Adjusted EBITDA was $3.8 million, with an adjusted EBITDA margin of 6.9%, up 70 basis points. The continued improvement in profitability was supported by improved business mix and lower fixed costs, as a result of cost saving initiatives implemented during 2016.
Strong Balance Sheet and Debt Refinancing Enhances Financial Flexibility
As of June 30, 2017, the Company had of $146.3 million and undrawn revolving credit facilities of €50 million, implying total liquidity of $203.4 million. Total net debt with third parties was $400.4 million and last twelve month (LTM) adjusted EBITDA to net debt with third parties was 1.8x compared to 2.0x at June 30, 2016. Including the debt refinancing, the pro forma leverage ratio would be 1.6x.
As announced on April 28, 2017, the Company continued the accelerated debt pay down program, with a voluntary payment of $27 million of higher-cost Brazil debentures. The $27 million payment was comprised of $20 million accelerated from Q4 2017 and $7 million from 2018.
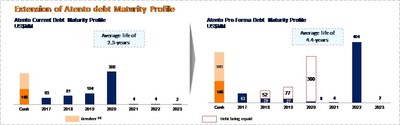
On July 28, 2017, the Company announced that its wholly-owned subsidiary, Atento Luxco 1 S.A., issued a new Senior Secured Notes due 2022, in aggregate principal amount of US$400 million with a coupon on 6.125%. The proceeds, combined with the use of cash in hands, are being used to redeem all outstanding 7.375% Senior Secured Notes due 2020 and all the existing debentures due 2019 in Brazil. In addition, it was announced a new Revolver Credit Facility of $105 million to replace the current existing €50 million line. The debt refinancing reaffirms the commitment in strengthening balance sheet and improving financial flexibility. The debt refinance is estimated to reduce annual interest expense by $10-15 million as of 2018 versus the FY 2017 revised Guidance.
|
Debt Refinance - Overview | |||
|
US$MM |
Actual |
Adjustments |
Proforma |
|
Cash Balance |
146.3 |
- |
146.3 |
|
EUR RCF |
57.1 |
(57.1) |
- |
|
Undrawn SS RCF (Club Multicurrency) |
- |
+50.0 |
50.0 |
|
Undrawn SS RCF (Bilateral Multicurrency) |
- |
+55.0 |
55.0 |
|
(=) Total Liquidity |
203.4 |
47.9 |
251.3 |
|
1st Brazilian Debenture (CDI+3.7%) |
129.4 |
(129.4) |
- |
|
2nd Brazilian Debenture (CDI+3.75%) |
20.8 |
- |
20.8 |
|
7.375% Senior Secured Notes due 2020 |
304.2 |
(304.2) |
- |
|
6.125% Senior Secured Notes due 2022 |
- |
+400.0 |
400.0 |
|
BNDES Credit Facility |
59.4 |
- |
59.4 |
|
Other Borrowings |
32.9 |
- |
32.9 |
|
(=) Total Debt |
546.7 |
-33.6 |
513.1 |
|
(=) Net Debt |
400.4 |
366.8 | |
|
Net Leverage (Net Debt / LTM Adj. EBITDA) |
1.8x |
1.6x | |


Revising Fiscal 2017 Guidance
The Company is revising its guidance for Fiscal 2017, notably increasing its revenue growth target to 5% to 8%, on a constant currency basis, and reducing its net interest expense target to reflect the debt refinancing starting as of Q4 2017. The increase in effective tax rate to ~39%.
|
Guidance |
New |
Prior |
|
Consolidated Revenue Growth (CCY) |
5% to 8% |
1% to 5% |
|
Adjusted EBITDA Margin Range (CCY) |
11% to 12% |
11% to 12% |
|
Net Interest Expense Range |
$55MM to $60MM |
$60MM to $65MM |
|
Cash Capex (% of Revenue) |
~3-4% |
~3-4% |
|
Effective Tax Rate |
~39% |
~34% |
|
Diluted Share Count |
~73.9MM shares |
~73.9MM shares |
|
Cash Conversion as % of Adj. EBITDA |
~40% |
~40% |
This guidance assumes no change in the current operating environment, capital structure or exchange rates movements on the translation of our financial statements into U.S. dollars except where noted.
Conference Call
The Company will host a conference call and webcast for analysts on Tuesday, August 15, 2017 at 10:00 am ET to discuss its financial results. The conference call can be accessed by dialing: +1 (877) 407-3982 toll free domestic, UK: (+44) 0 800 756 3429 toll free, Brazil: (+55) 0 800 891 6221 toll free, or Spain: (+34) 900 834 236 toll free. All other international callers can access the conference call by dialing: +1 (201) 493-6780 toll free. No passcode is required. Individuals who dial in will be asked to identify themselves and their affiliations. The conference call will also be webcasted through a link on the Investor Relations website at investors.atento.com. A web-based archive of the conference call will also be available at the above website.
About Atento
Atento is the largest provider of customer relationship management and business process outsourcing (CRM BPO) solutions in Latin America, and among the top five providers globally, based on revenues. Atento is also a leading provider of nearshoring CRM/BPO services to companies that carry out their activities in the United States. Since 1999, the company has developed its business model in 13 countries where it employs 150,000 people. Atento has over 400 clients to whom it offers a wide range of CRM/BPO services through multiple channels. Atento's clients are mostly leading multinational corporations in sectors such as telecommunications, banking and financial services, health, retail and public administrations, among others. Atento´s shares trade under the symbol ATTO on the New York Stock Exchange (NYSE). In 2016, Atento was named one of the World´s 25 Best Multinational Workplaces by Great Place to Work® for a fourth consecutive year. For more information visit www.atento.com
Forward-Looking Statements
This press release contains forward-looking statements. Forward-looking statements can be identified by the use of words such as "may," "should," "expects," "plans," "anticipates," "believes," "estimates," "predicts," "intends," "continue" or similar terminology. These statements reflect only Atento's current expectations and are not guarantees of future performance or results. These statements are subject to risks and uncertainties that could cause actual results to differ materially from those contained in the forward-looking statements. These risks and uncertainties include, but are not limited to, competition in Atento's highly competitive industries; increases in the cost of voice and data services or significant interruptions in these services; Atento's ability to keep pace with its clients' needs for rapid technological change and systems availability; the continued deployment and adoption of emerging technologies; the loss, financial difficulties or bankruptcy of any key clients; the effects of global economic trends on the businesses of Atento's clients; the non-exclusive nature of Atento's client contracts and the absence of revenue commitments; security and privacy breaches of the systems Atento uses to protect personal data; the cost of pending and future litigation; the cost of defending Atento against intellectual property infringement claims; extensive regulation affecting many of Atento's businesses; Atento's ability to protect its proprietary information or technology; service interruptions to Atento's data and operation centers; Atento's ability to retain key personnel and attract a sufficient number of qualified employees; increases in labor costs and turnover rates; the political, economic and other conditions in the countries where Atento operates; changes in foreign exchange rates; Atento's ability to complete future acquisitions and integrate or achieve the objectives of its recent and future acquisitions; future impairments of our substantial goodwill, intangible assets, or other long-lived assets; and Atento's ability to recover consumer receivables on behalf of its clients. In addition, Atento is subject to risks related to its level of indebtedness. Such risks include Atento's ability to generate sufficient cash to service its indebtedness and fund its other liquidity needs; Atento's ability to comply with covenants contained in its debt instruments; the ability to obtain additional financing; the incurrence of significant additional indebtedness by Atento and its subsidiaries; and the ability of Atento's lenders to fulfill their lending commitments. Atento is also subject to other risk factors described in documents filed by the company with the United States Securities and Exchange Commission.
These forward-looking statements speak only as of the date on which the statements were made. Atento undertakes no obligation to update or revise publicly any forward-looking statements, whether as a result of new information, future events or otherwise.
SELECTED FINANCIAL DATA
The following selected financial information should be read in conjunction with the interim consolidated financial statements and the section entitled "Management's Discussion and Analysis of Financial Condition and Results of Operations" presented elsewhere in the Form 6-K.
|
Consolidated Income Statements for the Three and Six Months Ended June 30, 2016 and 2017 | |||||||||||||||
|
($ in millions, except percentage changes) |
For the three months ended June 30, |
Change |
Change excluding |
For the six months ended June 30, |
Change |
Change excluding | |||||||||
|
2016 (*) |
2017 |
(%) |
FX (%) |
2016 (*) |
2017 |
(%) |
FX (%) | ||||||||
|
(unaudited) |
(unaudited) |
||||||||||||||
|
Revenue |
448.6 |
473.7 |
5.6 |
2.4 |
864.3 |
941.7 |
9.0 |
2.7 | |||||||
|
Other operating income |
0.7 |
8.3 |
N.M. |
N.M. |
1.5 |
9.1 |
N.M. |
N.M. | |||||||
|
Operating expenses: |
|||||||||||||||
|
Supplies |
(14.9) |
(17.5) |
(17.4) |
(15.9) |
(29.9) |
(34.3) |
(14.7) |
(9.2) | |||||||
|
Employee benefit expenses |
(338.3) |
(355.1) |
(5.0) |
(1.8) |
(651.1) |
(700.8) |
(7.6) |
(1.7) | |||||||
|
Depreciation |
(11.8) |
(11.1) |
5.9 |
9.8 |
(22.4) |
(22.9) |
(2.2) |
5.4 | |||||||
|
Amortization |
(13.3) |
(12.3) |
7.5 |
10.9 |
(23.9) |
(25.9) |
(8.4) |
(1.6) | |||||||
|
Changes in trade provisions |
- |
0.2 |
N.M. |
N.M. |
(0.3) |
- |
100.0 |
100.0 | |||||||
|
Other operating expenses |
(50.0) |
(63.5) |
(27.0) |
(22.1) |
(101.1) |
(119.3) |
(18.0) |
(9.1) | |||||||
|
Total operating expenses |
(428.3) |
(459.3) |
(7.2) |
(3.9) |
(828.7) |
(903.2) |
(9.0) |
(2.7) | |||||||
|
Operating profit |
21.0 |
22.7 |
8.1 |
6.1 |
37.1 |
47.6 |
28.3 |
22.4 | |||||||
|
Finance income |
0.7 |
1.5 |
114.3 |
114.3 |
2.2 |
3.6 |
63.6 |
44.0 | |||||||
|
Finance costs |
(19.9) |
(16.0) |
19.6 |
23.1 |
(37.8) |
(33.5) |
11.4 |
17.5 | |||||||
|
Change in fair value of financial instruments |
0.2 |
(0.3) |
N.M. |
N.M. |
0.7 |
(0.3) |
(142.9) |
(142.9) | |||||||
|
Net foreign exchange gain/(loss) |
(9.2) |
(4.3) |
53.3 |
52.7 |
(12.9) |
(0.9) |
93.0 |
93.0 | |||||||
|
Net finance expense |
(28.2) |
(19.1) |
32.3 |
34.1 |
(47.8) |
(31.1) |
34.9 |
38.2 | |||||||
|
(Loss)/profit before tax |
(7.2) |
3.6 |
150.0 |
147.4 |
(10.7) |
16.5 |
N.M. |
N.M. | |||||||
|
Income tax expense |
(0.6) |
(7.3) |
N.M. |
N.M. |
(1.5) |
(11.1) |
N.M. |
N.M. | |||||||
|
(Loss)/profit from continuing operations |
(7.8) |
(3.7) |
52.6 |
56.0 |
(12.2) |
5.4 |
144.3 |
141.9 | |||||||
|
Discontinued operations: |
|||||||||||||||
|
Loss from discontinued operations |
(0.3) |
- |
100.0 |
100.0 |
(0.7) |
- |
100.0 |
100.0 | |||||||
|
(Loss)/profit for the period |
(8.1) |
(3.7) |
54.3 |
57.5 |
(12.9) |
5.4 |
141.9 |
139.7 | |||||||
|
(Loss)/profit attributable to: |
|||||||||||||||
|
Owners of the parent |
(8.1) |
(3.9) |
51.9 |
55.2 |
(12.9) |
5.1 |
139.5 |
137.5 | |||||||
|
Non-controlling interest |
- |
0.2 |
N.M. |
N.M. |
- |
0.3 |
N.M. |
N.M. | |||||||
|
Other financial data: |
|||||||||||||||
|
EBITDA (1) (unaudited) |
46.1 |
46.1 |
- |
(2.9) |
83.4 |
96.4 |
15.6 |
8.8 | |||||||
|
Adjusted EBITDA (1) (unaudited) |
54.2 |
52.5 |
(3.1) |
(6.1) |
103.0 |
106.2 |
3.1 |
(3.2) | |||||||
|
(1) For reconciliation with IFRS as issued by IASB, see section "Summary Historical Consolidated Financial Information - Reconciliation of EBITDA and Adjusted EBITDA to profit/(loss)". | |||||||||||||||
|
(*) Restated, excluding discontinued operations - Morocco. | |||||||||||||||
|
N.M. means not meaningful | |||||||||||||||
|
Reconciliation of EBITDA and Adjusted EBITDA to profit/(loss): |
|||||||||
|
For the three months ended June 30, |
For the six months ended June 30, |
||||||||
|
($ in millions) |
2016 |
2017 |
2016 |
2017 |
|||||
|
(unaudited) |
|||||||||
|
(Loss)/profit from continuing operations (*) |
(7.8) |
(3.7) |
(12.2) |
5.4 |
|||||
|
Net finance expense (*) |
28.2 |
19.1 |
47.8 |
31.1 |
|||||
|
Income tax expense (*) |
0.6 |
7.3 |
1.5 |
11.1 |
|||||
|
Depreciation and amortization (*) |
25.1 |
23.4 |
46.3 |
48.8 |
|||||
|
EBITDA (non-GAAP) (unaudited) |
46.1 |
46.1 |
83.4 |
96.4 |
|||||
|
Restructuring costs (a) |
6.7 |
5.5 |
12.9 |
8.9 |
|||||
|
Site relocation costs (b) |
0.2 |
- |
5.9 |
- |
|||||
|
Asset impairments and Other (c) |
1.2 |
0.9 |
0.8 |
0.9 |
|||||
|
Total non-recurring items (**) |
8.1 |
6.4 |
19.6 |
9.8 |
|||||
|
Adjusted EBITDA (non-GAAP) (unaudited) |
54.2 |
52.5 |
103.0 |
106.2 |
|||||
|
(*) The amounts of June 30, 2016, were restated excluding discontinued operations – Morocco. |
|||||||||
|
(**) We define non-recurring items as items that are limited in number, clearly identifiable, unusual, are unlikely to be repeated in the near future in the ordinary course of business and that have a material impact on the consolidated results of operations. Non-recurring items fall mainly into three categories of investment: |
|||||||||
| |
| |
| |
|
a) |
Restructuring costs for the three and six month ended June 30, 2016, are primarily related to costs to adapt the organizations in EMEA and Brazil to lower levels of activity and other minor restructurings in the Americas. Restructuring costs incurred in three and six months ended June 30, 2017, are primarily related to the costs of adapting the organization in Argentina and Brazil to the lower level of activities and the investments made in Brazil, Mexico and Spain to implement a lower-cost operating model. |
|
b) |
Site relocation costs incurred for the three and six months ended June 30, 2016 are related to the anticipation of site closures in Brazil in connection with the site relocation program. |
|
c) |
Asset impairments and other costs incurred for the three months ended June 30, 2016 and 2017 mainly refer to consulting and other non-recurring costs. |
|
Reconciliation of Adjusted Earnings to profit/(loss): |
||||||||
|
For the three months ended June 30, |
For the six months ended June 30, |
|||||||
|
($ in millions) |
2016 |
2017 |
2016 |
2017 |
||||
|
(unaudited) |
||||||||
|
(Loss)/profit from continuing operations (*) |
(7.8) |
(3.7) |
(12.2) |
5.4 |
||||
|
Amortization of acquisition related intangible assets (a) |
6.2 |
4.3 |
11.4 |
11.1 |
||||
|
Restructuring costs (b) (**) |
6.7 |
5.5 |
12.9 |
8.9 |
||||
|
Site relocation costs (c) (**) |
0.2 |
- |
5.9 |
- |
||||
|
Asset impairments and Other (d) (**) |
1.2 |
0.9 |
0.8 |
0.9 |
||||
|
Net foreign exchange gain on financial instruments (e) |
(0.2) |
0.3 |
(0.7) |
0.3 |
||||
|
Net foreign exchange impacts (f) |
9.2 |
4.3 |
12.9 |
0.9 |
||||
|
Tax effect (g) |
(6.0) |
(2.0) |
(11.1) |
(5.4) |
||||
|
Total of add-backs |
17.3 |
13.3 |
32.1 |
16.7 |
||||
|
Adjusted Earnings (non-GAAP) (unaudited) |
9.5 |
9.6 |
19.9 |
22.1 |
||||
|
Adjusted basic Earnings per share (in U.S. dollars) (***) (unaudited) |
0.13 |
0.13 |
0.26 |
0.30 |
||||
|
(*) The amounts of June 30, 2016 were restated excluding discontinued operations - Morocco. |
||||||||
|
(**) We define non-recurring items as items that are limited in number, clearly identifiable, unusual, are unlikely to be repeated in the near future in the ordinary course of business and that have a material impact on the consolidated results of operations. Non-recurring items fall primarily into three categories of investment: |
||||||||
| |
|
a) |
Amortization of acquisition related intangible assets represents the amortization expense of customer base, recorded as intangible assets. This customer base represents the fair value (within the business combination involving the acquisition of control of Atento Group) of the intangible assets arising from service agreements (tacit or explicitly formulated in contracts) with Telefonica Group and with other customers. |
|
b) |
Restructuring costs for the three and six month ended June 30, 2016, are primarily related to costs to adapt the organizations in EMEA and Brazil to lower levels of activity and other minor restructurings in the Americas. Restructuring costs incurred in three and six months ended June 30, 2017, are primarily related to the costs of adapting the organization in Argentina and Brazil to the lower level of activities and the investments made in Brazil, Mexico and Spain to implement a lower-cost operating model. |
|
c) |
Site relocation costs incurred for the three and six months ended June 30, 2016 are related to the anticipation of site closures in Brazil in connection with the site relocation program. |
|
d) |
Asset impairments and other costs incurred for the three months ended June 30, 2016 and 2017 mainly refer to consulting and other non-recurring costs. |
|
e) |
Since April 1, 2015, the Company designated the foreign currency risk on certain of its subsidiaries as net investment hedges using financial instruments as the hedging items. As a consequence, any gain or loss on the hedging instrument, related to the effective portion of the hedge is recognized in other comprehensive income (equity) as from that date. The gains or losses related to the ineffective portion are recognized in the income statements and for comparability, and those adjustments are added back to calculate Adjusted Earnings. |
|
f) |
Since 2015, our management analyzes the Company financial condition performance excluding net foreign exchange impacts, which eliminates the volatility of foreign exchange variances from our operational results. |
|
g) |
The tax effect represents the impact of the taxable adjustments based on tax rate of 13.1% for the three months period ended June 30, 2017, 30.4% for the same period ended June 30, 2016, 24.4% for the six month period ended June 30, 2017 and 29.4% for the same period ended June 30, 2016. |
|
(***) |
Adjusted Earnings per share, is calculated based on the weighted average number of ordinary shares outstanding of 73,909,056 as of June 30, 2017. For the period ended June 30, 2016 the weighted average number of ordinary shares outstanding was 73,751,131. |
Financing Arrangements
|
As of June 30, | |||
|
($ in millions, except Net Debt/Adj. EBITDA LTM) |
2016 |
2017 | |
|
(unaudited) | |||
|
Cash and cash equivalents |
159.5 |
146.3 | |
|
Debt: |
|||
|
7.375% Senior Secured Notes due 2020 |
302.5 |
304.2 | |
|
Brazilian Debentures |
204.9 |
150.2 | |
|
Contingent Value Instrument (1) |
23.9 |
- | |
|
Finance Lease Payables |
4.1 |
9.1 | |
|
Other Borrowings |
83.2 |
83.2 | |
|
Total Debt |
618.6 |
546.7 | |
|
Net Debt with third parties (2) (unaudited) |
459.1 |
400.4 | |
|
Adjusted EBITDA LTM (3) (*) (non-GAAP) (unaudited) |
232.1 |
225.2 | |
|
Net Debt/Adjusted EBITDA LTM (non-GAAP) (unaudited) |
2.0x |
1.8x | |
|
(*) |
Restated, excluding discontinued operations – Morocco. |
|
(1) |
The CVI was terminated on November 8, 2016. |
|
(2) |
In considering our financial condition, our management analyzes Net debt with third parties, which is defined as total debt less cash and cash equivalents. Net debt with third parties is not a measure defined by IFRS and it has limitations as an analytical tool. Net debt with third parties is neither a measure defined by or presented in accordance with IFRS nor a measure of financial performance, and should not be considered in isolation or as an alternative financial measure determined in accordance with IFRS. Net debt is not necessarily comparable to similarly titled measures used by other companies. |
|
(3) |
Adjusted EBITDA LTM (Last Twelve Months) is defined as EBITDA adjusted to exclude restructuring costs, site relocation costs, asset impairments and other items not related to our core results of operations. |
Free Cash Flow:
|
Q2 |
YTD | |||
|
Free Cash Flow (FCF) US$ MM |
2017 |
2016 |
2017 |
2016 |
|
Operating Cash Flow (1) |
30.0 |
62.1 |
40.1 |
60.2 |
|
Cash Capex (2) |
(10.1) |
(20.6) |
(24.2) |
(39.7) |
|
Income Tax Paid |
(4.4) |
(7.7) |
(10.1) |
(14.2) |
|
Free Cash Flow before interest and Acquisitions |
15.4 |
33.8 |
5.8 |
6.3 |
|
Adj. EBITDA to Cash Conversion (%) |
29.4% |
62.3% |
5.4% |
6.1% |
|
Acquisitions |
(27.1) |
0.0 |
(27.1) |
0.0 |
|
Net Interest Paid |
(14.8) |
(21.7) |
(28.5) |
(36.1) |
|
Free Cash Flow (FCF) |
(26.5) |
12.1 |
(49.9) |
(29.8) |
|
(1) |
We define Operating Cash flow as Net Cash flow from/(used in) operating activities (as per 6K) adding back net interest and income tax expenses. |
|
(2) |
Does not consider acquisitions |
![]()

View original content with multimedia:http://www.prnewswire.com/news-releases/atento-reports-fiscal-2q17-results-highlighted-by-continuation-of-topline-growth-300504215.html
SOURCE Atento S.A.

© 2024 Benzinga.com. Benzinga does not provide investment advice. All rights reserved.
Trade confidently with insights and alerts from analyst ratings, free reports and breaking news that affects the stocks you care about.

