


The six-year bull market lives on after the S&P 500 (SPX) finished at record highs—and in a week for mediocre economic and earnings numbers.
The broad-market index is now up 1.8 percent in May and 3 percent year to date. With its gain, risk perceptions seem to be easing along with market volatility.
But don’t look now. Wall Street’s bullish bias faces more tests from the retail sector and a broader sampling of economic reports in the days ahead.
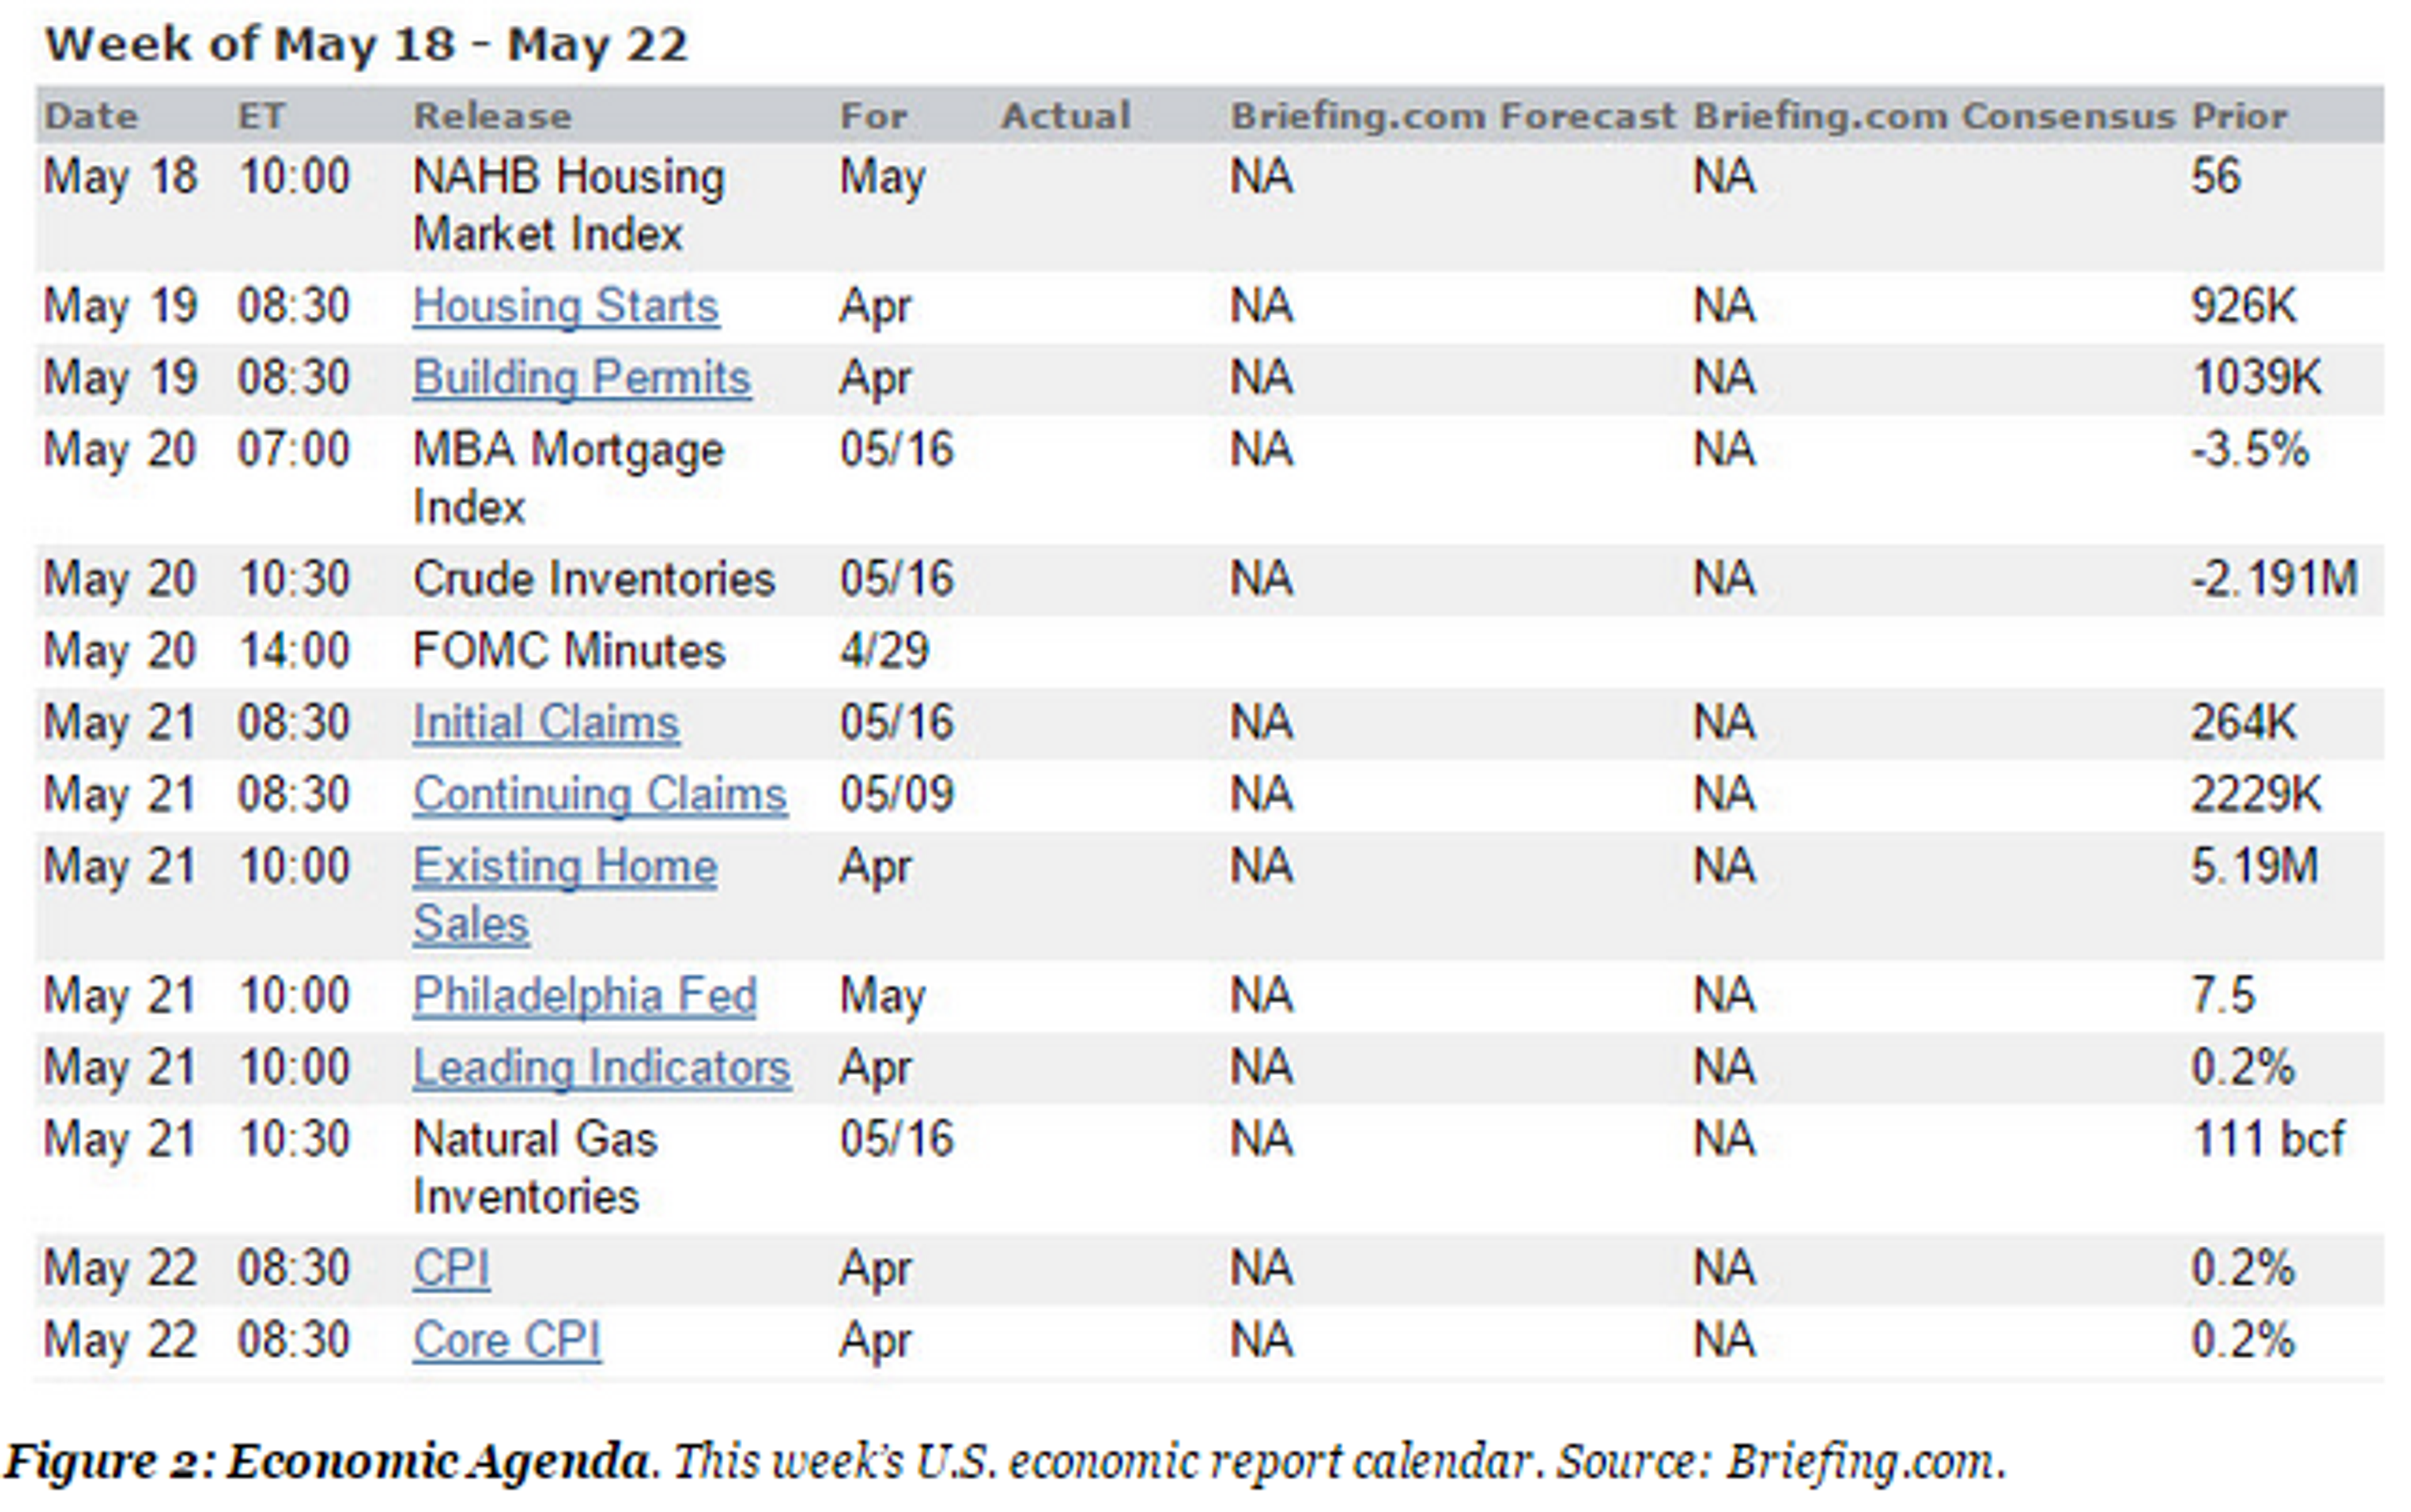
Optimism might be challenged this week as investors digest data on housing, manufacturing, and inflation (see the full schedule in figure 2 below). To top it off, the Federal Reserve issues its meeting minutes, which could potentially trigger volatility in the bond pits and across stock-trading desks if the text reshapes rate expectations. You’ll recall that the big driver behind fresh record stock highs was the belief that a Fed rate hike is on ice after lackluster economic data in April and May.
Bond-market volatility has flared up and we’ve seen some notable outflows from the fixed-income space, apparently headed for stocks. Let’s see if this trend continues and is strong enough to support stock gains. The other side to negative bond trading is the risk that higher market interest rates raise stock-investor nerves.
Meanwhile, it’s a busy week of earnings from the retailers. The list includes Dow components Home Depot HD and Wal-Mart WMT on Tuesday. Lowe’s LOW, Best Buy BBY, Sears Holdings SHLD and Target TGT are also due out with results.
Getting Too Comfortable?
The reports hit after several days of quiet trading last week sent the CBOE Volatility Index (VIX) skidding into a losing streak. The index is down for the past three days and finished last week with a loss of 10 percent. At just 12.38, the market’s so-called “fear gauge” is back within striking distance of this year’s closing low of 12.29 set April 24. It’s now down 15 percent for May and 36 percent year to date.


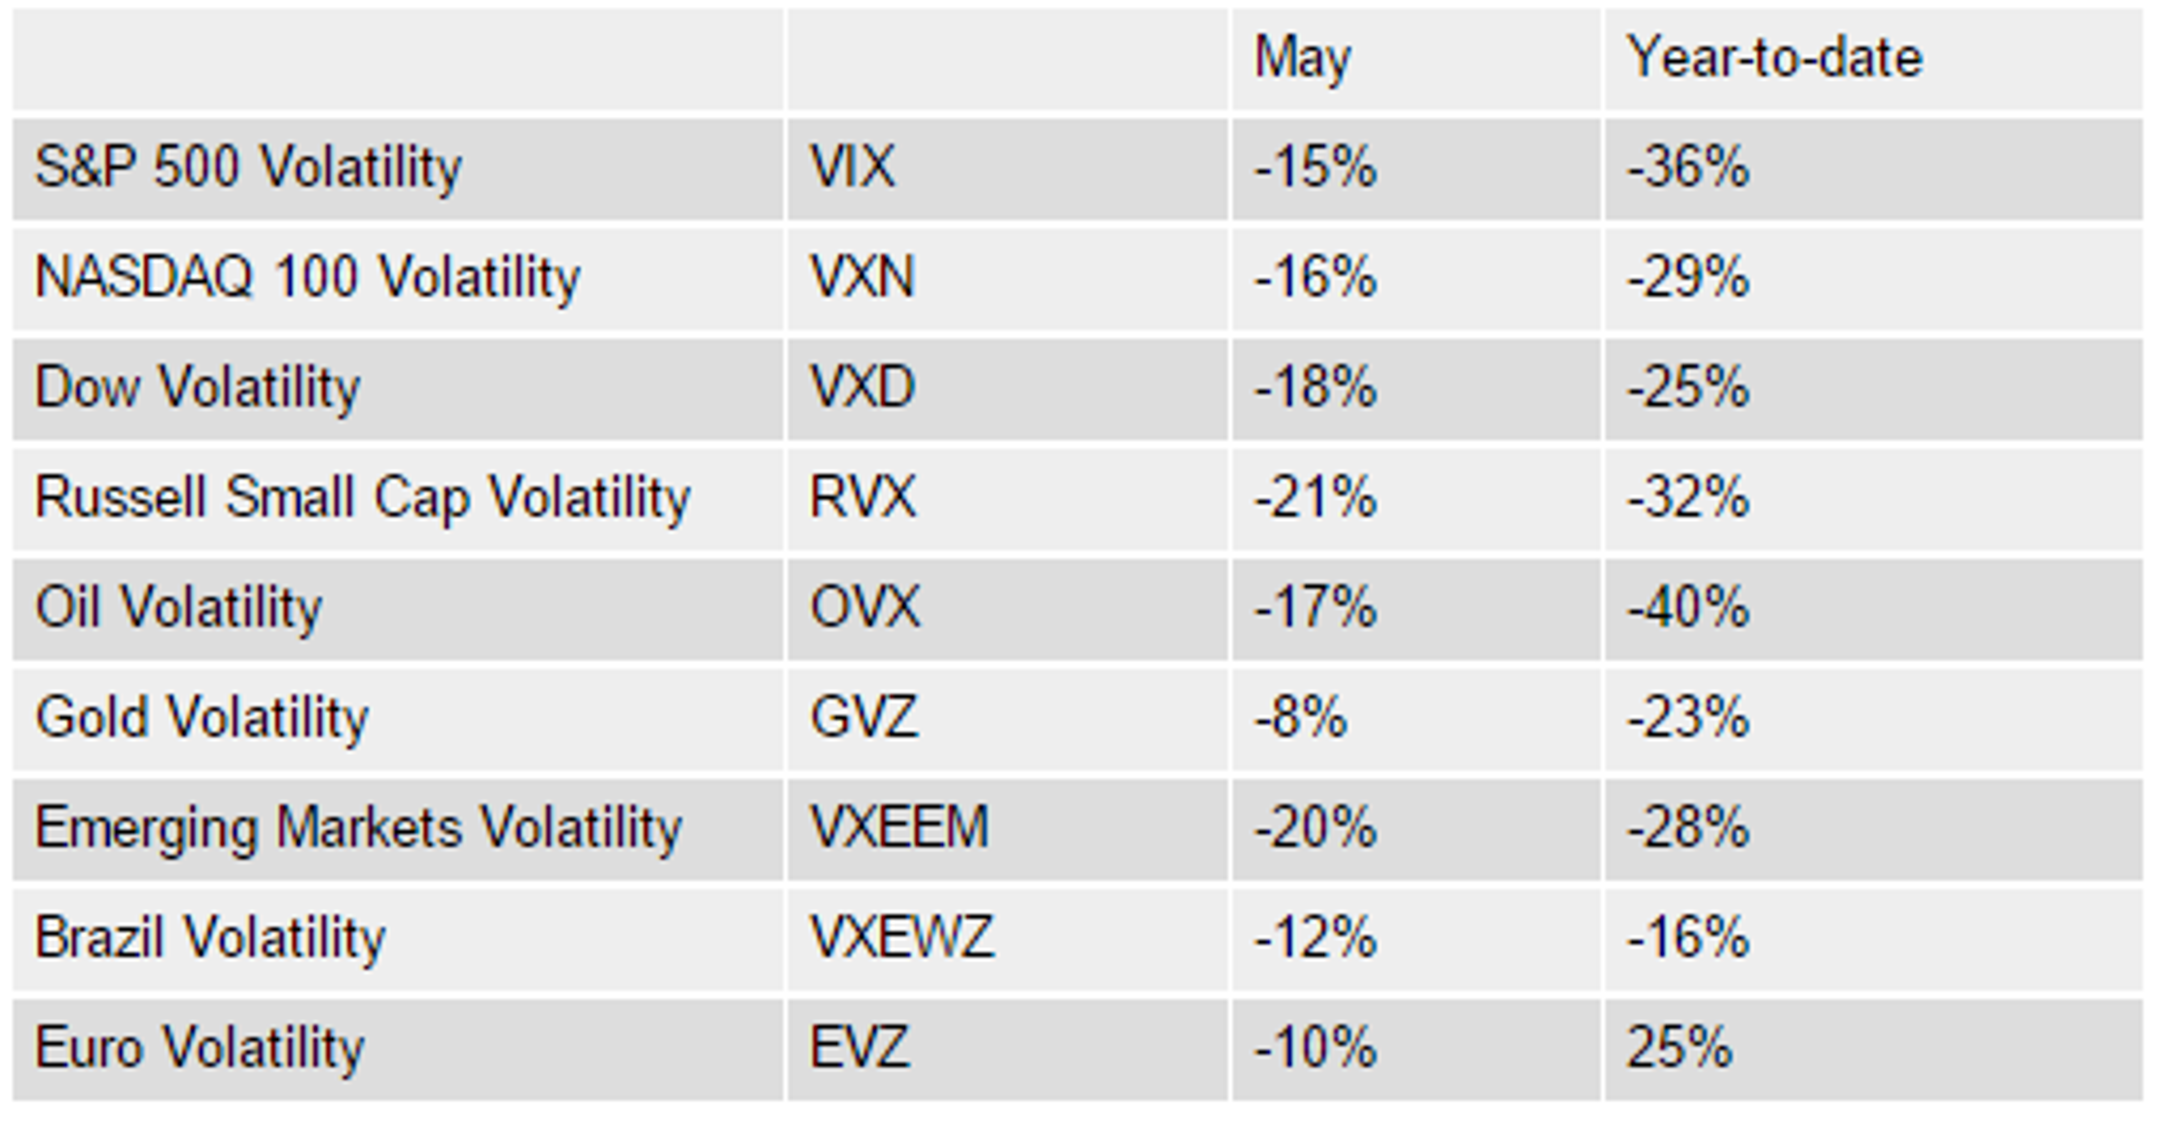
It’s not just the CBOE Volatility Index probing its 2015 lows. Many other measures of market volatility have eased this month. While VIX tracks the expected or implied volatility priced into S&P 500 Index options, volatility in the Dow Jones Industrial Average, as measured by VXD, is down 18 percent in May and 25 percent since the end of December.
In fact, by almost any measure, volatility has dropped in May 2015. The table below shows that the biggest declines have been in the small caps (RVX), oil (OVX), and the emerging markets (VXEEM). Nearly every barometer (excluding the CBOE EuroCurrency Volatility Index, or EVZ) is down year-to-date as well.

Rate Watch Continues
Because VIX and the other volatility indexes are computed using forward-looking options pricing models and current options prices, they tend to reflect expectations about future volatility. The across-the-board decline so far in May seems to suggest that anxiety about energy prices, interest rates, and other macro events that rattled the market earlier this year are receding. For now.
Where the next big catalyst comes from may be anyone’s guess. Beyond the retailers, the Q1 earnings reporting season is coming to a close, and much of the focus is likely to remain on the economy and the risk of higher bond yields.
As we saw earlier this month, any sudden move in yields could potentially spill over and trigger higher volatility in the equities market. Yet, judging by the steep drop in the VIX last week, investors haven’t dug into their defensive positions just yet.
Good trading,
JJ
@TDAJJKinahan

This piece was originally posted here by JJ Kinahan on May 18, 2015.
TD Ameritrade, Inc., member FINRA/SIPC. Commentary provided for educational purposes only. Past performance of a security, strategy, or index is no guarantee of future results or investment success. Inclusion of specific security names in this commentary does not constitute a recommendation from TD Ameritrade to buy, sell, or hold.
Options involve risks and are not suitable for all investors. Please read Characteristics and Risks of Standardized Options before investing. Supporting documentation for any claims, comparison, statistics, or other technical data will be supplied upon request.
The information is not intended to be investment advice and is for illustrative purposes only. Be sure to understand all risks involved with each strategy, including commission costs, before attempting to place any trade. Clients must consider all relevant risk factors, including their own personal financial situations, before trading.
© 2024 Benzinga.com. Benzinga does not provide investment advice. All rights reserved.
Trade confidently with insights and alerts from analyst ratings, free reports and breaking news that affects the stocks you care about.

